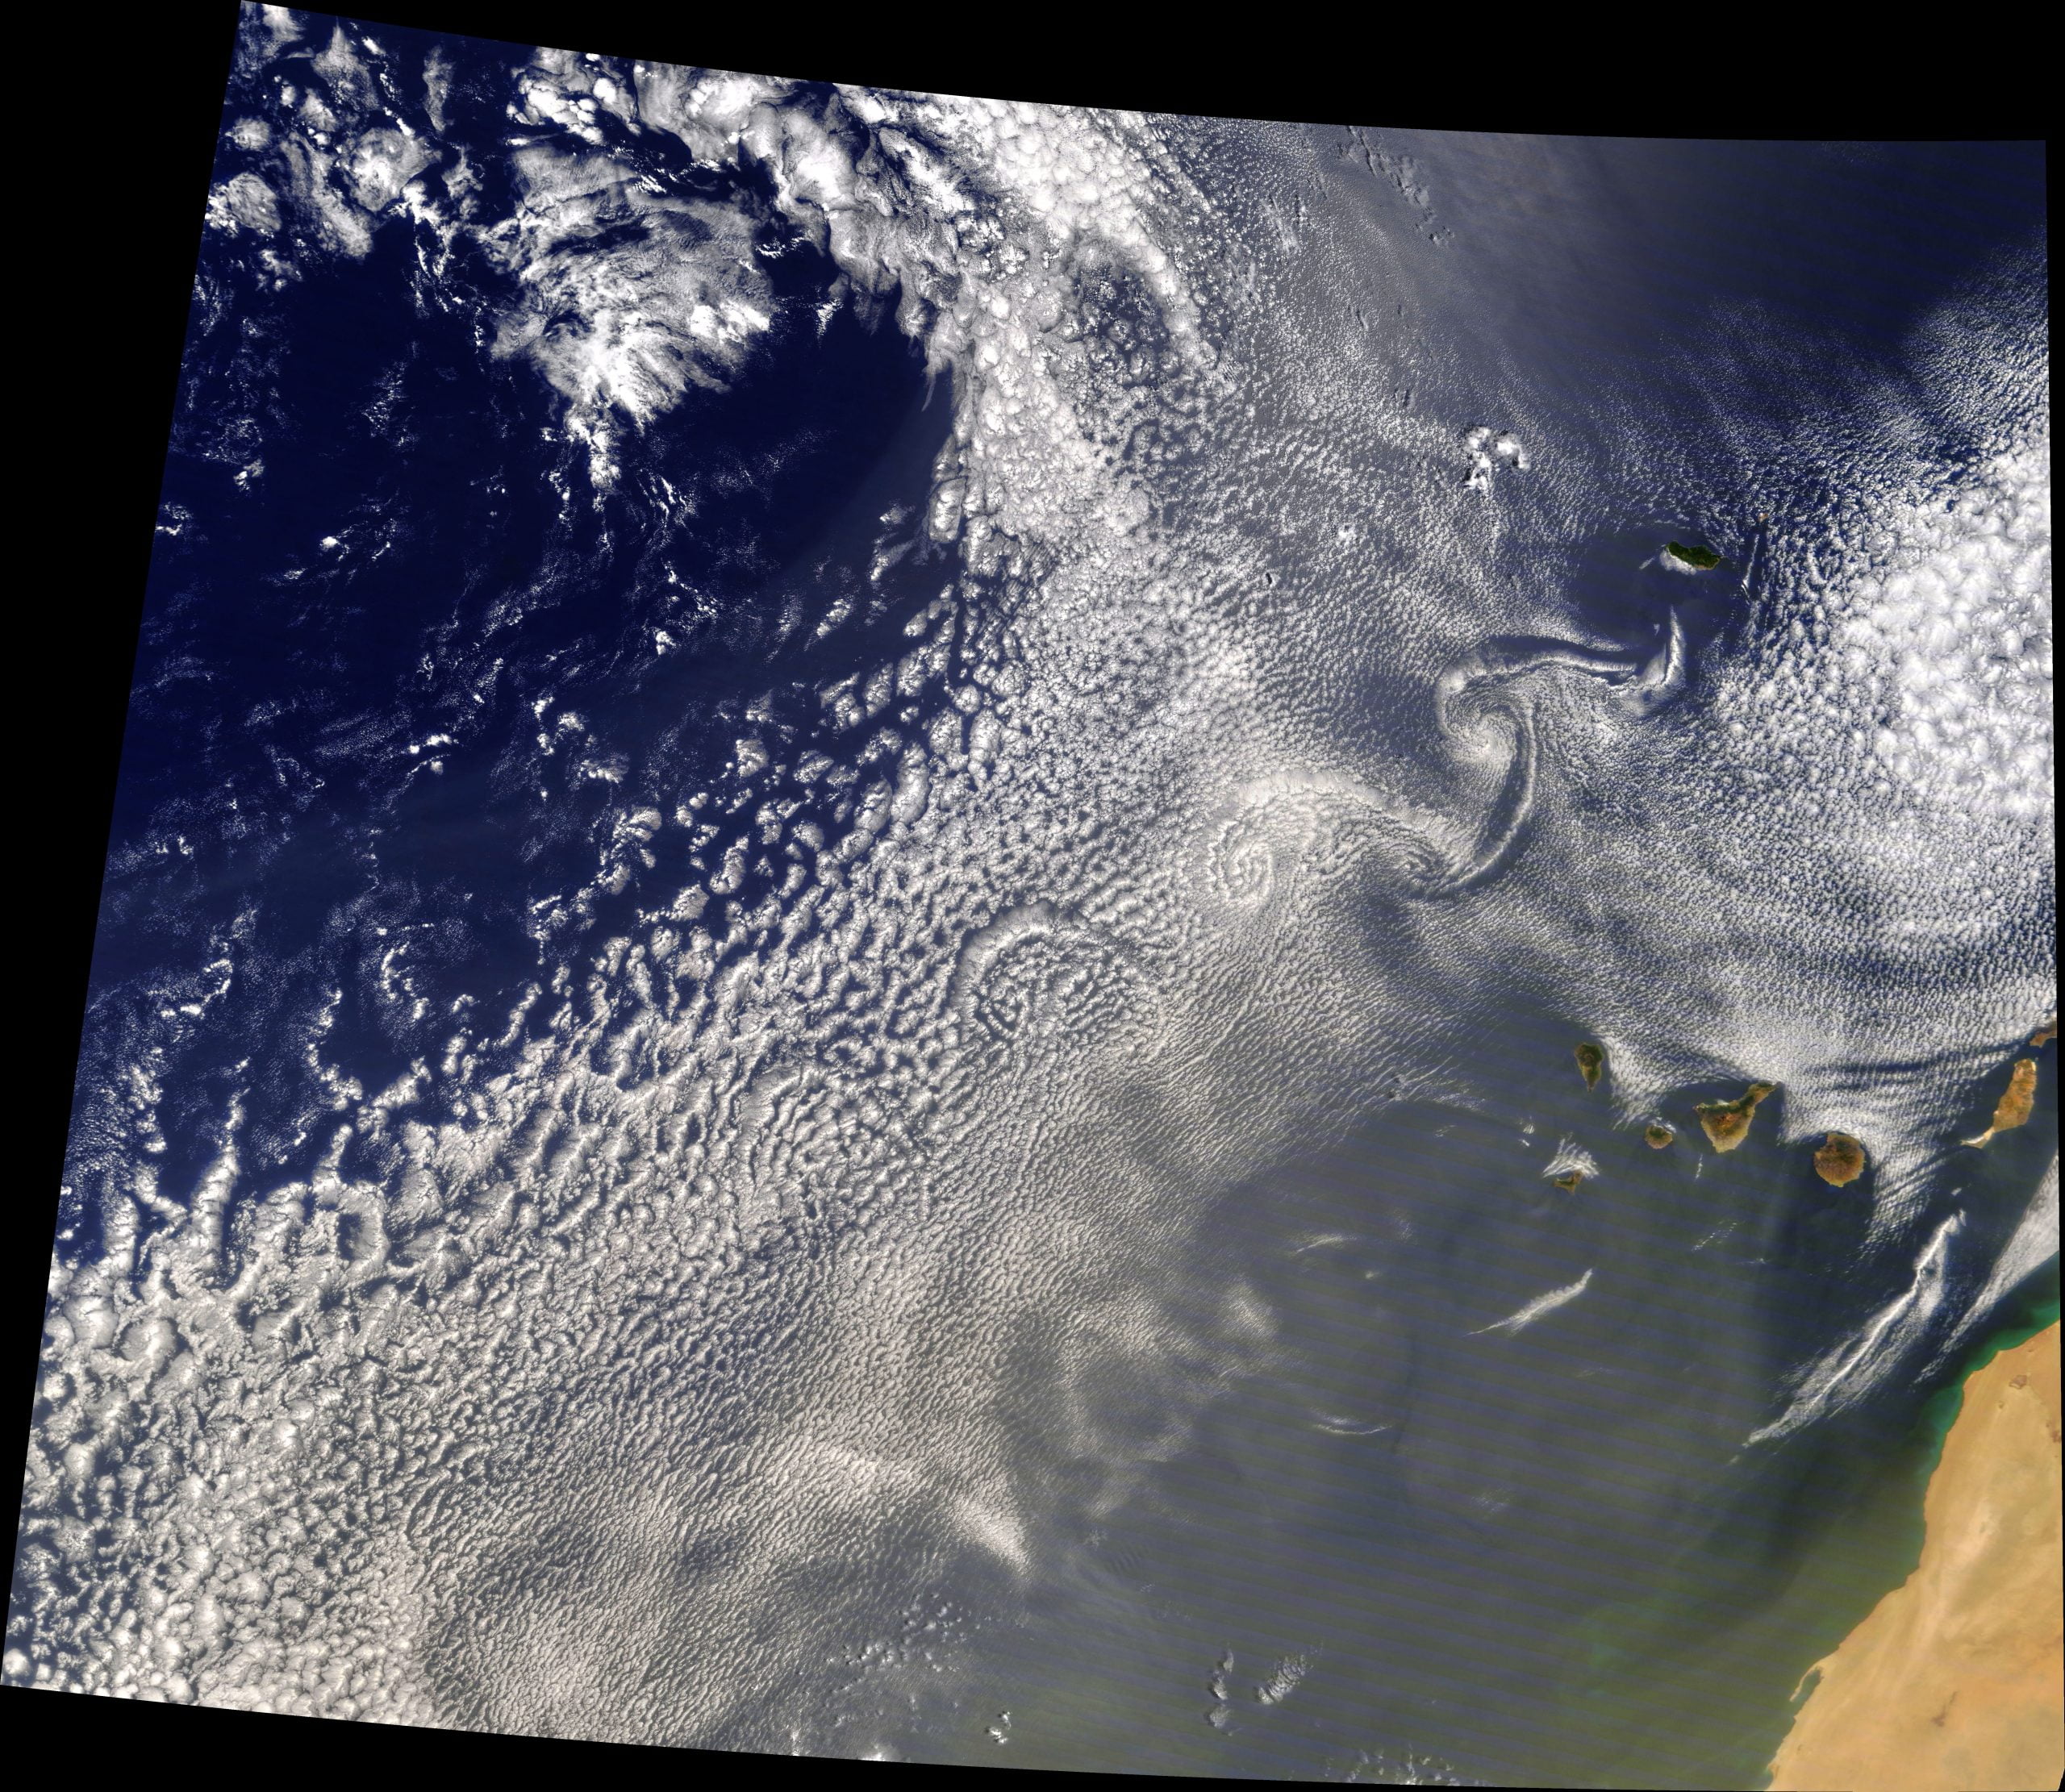
When winds flow past a solitary peak, like an island in the ocean, they’re disrupted into a series of counter-rotating curls. That’s what we see here stretching to the southwest of Madeira Island. The official name for this flow is a von Karman vortex street, and it can be found anywhere from a soap film to a starship. (Image credit: J. Stevens; via NASA Earth Observatory)
Tag: flow visualization

Precipitation


Chemistry and fluid dynamics often go hand-in-hand. Here chemical reactions produce visible precipitates as one chemical drops into the other. The shapes that form are distinctly fluid dynamical, with vortex rings, plumes, and instabilities all appearing.
In many applications, chemical reactions and fluid dynamics are tied inextricably to one another because the rate of chemical reaction depends on local concentrations driven by fluid dynamics, and the fluid motion is itself influenced by those concentration gradients. This is why reacting flows, like those found in combustion, are among the hardest topics in fluids. (Image and video credit: Beauty of Science)
Slow Motion Speech


Sneezing, coughing, and speaking all produce a spray of droplets capable of spreading COVID-19 and other respiratory illnesses. This Slow Mo Guys video is the latest demonstration in a long line of evidence for why wearing masks in public is such an important part of ending our current public health crisis. Also, I think we can all agree: that sneeze footage is gross. (Image and video credit: The Slow Mo Guys)

Hudson Bay Watercolors
Rivers sweep fresh water and sediment into the Hudson Bay in this satellite image. Dark brown plumes mark the mouths of several coastal rivers as they add to the cyclonic sediment flow around the bay and out the Hudson Strait. Paler swirls, like strokes of watercolors, mark turbulent mixing between the sediment-filled shallows and the deep blue waters of the bay. (Image credit: J. Stevens/USGS; via NASA Earth Observatory)
Storm Eyes and Mushrooms in a Drop


In industry, drying droplets often have many components: a liquid solvent, solid nanoparticles, and dissolved polymers. The concentration of that last component — the polymers — can have a big effect on the way the droplet dries, as seen in the video above.
Without polymers, the droplet dries similarly to a coffee ring stain. But at moderate concentration, we see something very different. The droplet forms an eye in the middle, similar to a hurricane’s, and the edges of the droplet sprout mushroom-shaped plumes that grow and merge with one another along the edge. With even larger polymer concentrations, the mushrooms sweep their way inward, leaving a feathery stain behind. (Video, image, and research credit: J. Zhao et al.)

Recreating Infinity


In the ocean, tiny organisms can migrate hundreds of meters through the water column. Recreating and tracking those journeys in a lab is quite a challenge, but it’s one the researchers behind the Gravity Machine have conquered. This apparatus uses a wheel to essentially give micro-organisms an infinite water column to traverse while keeping them fixed in the lab microscope’s field of view.
With the device, researchers can watch organisms switch naturally between rising, sinking, and feeding behaviors as they would in the wild. The group is working to make it so that anyone with a microscope can recreate their set-up for observations. (Image, video, and research credit: D. Krishnamurthy et al.; see also Gravity Machine; submitted by Kam-Yung Soh)

Green Swirls and Dark Streaks
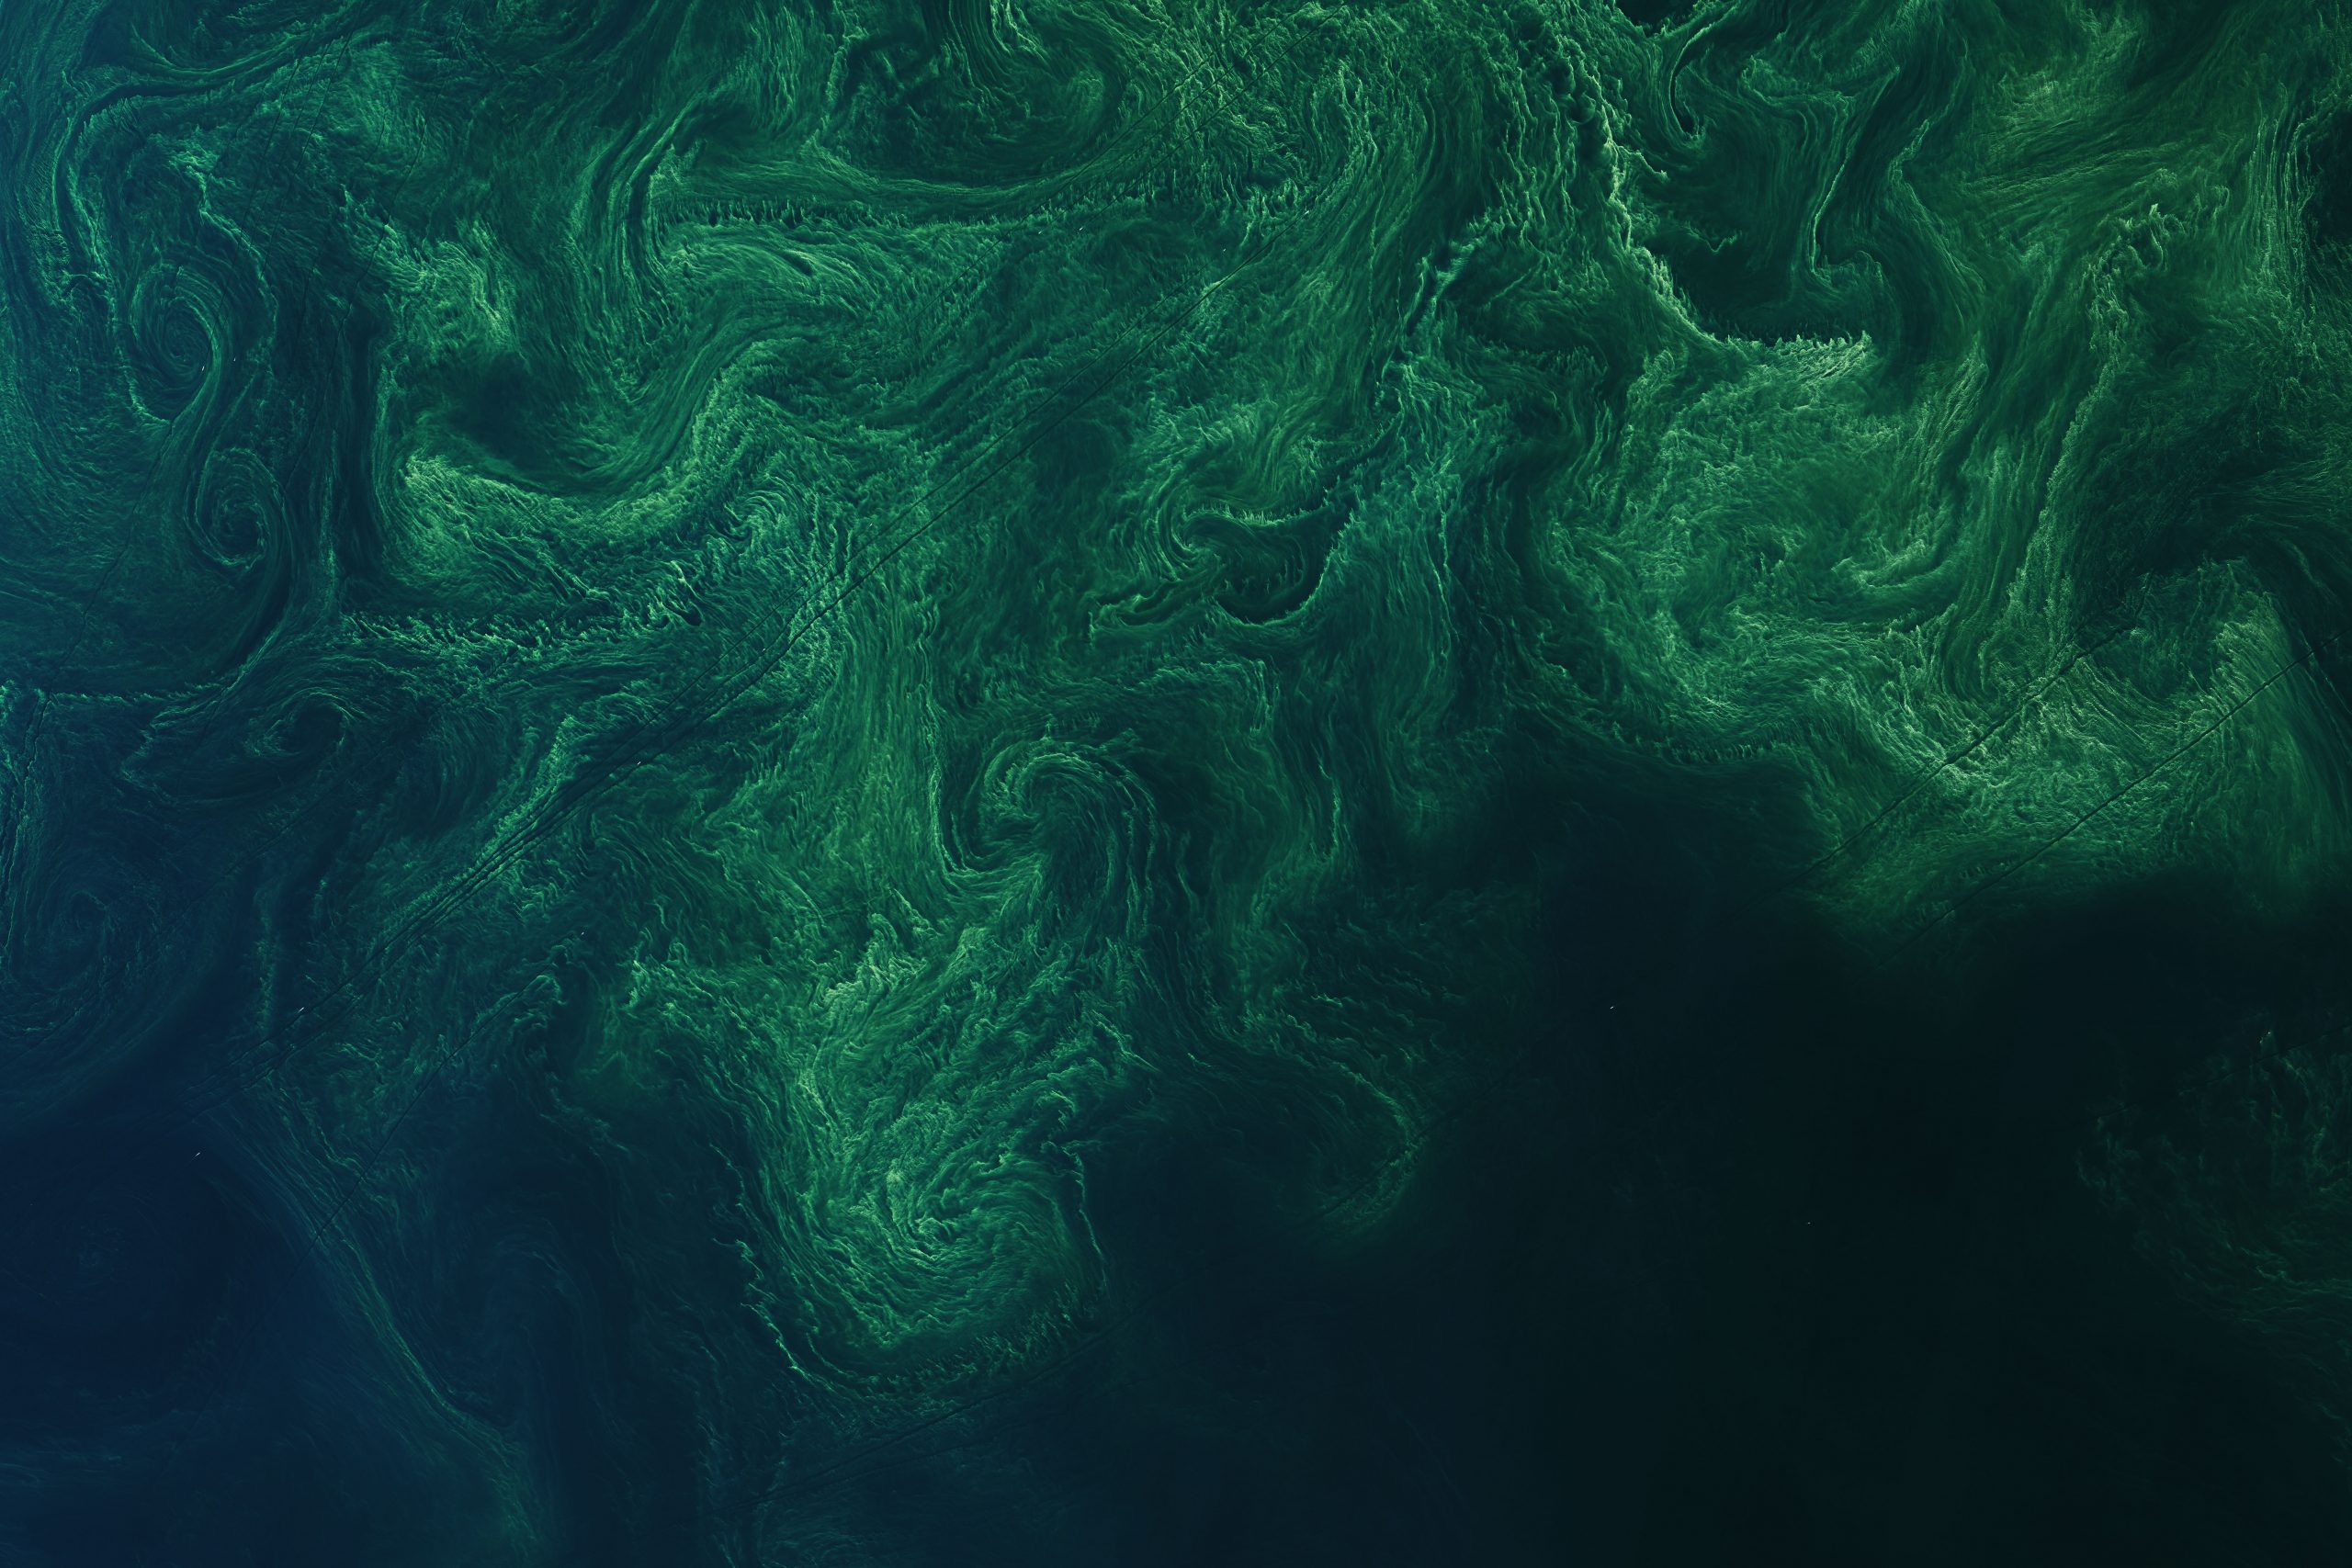

Green phytoplankton blooms swirl through the currents of the Baltic Sea in this satellite image. Individual phytoplankton are microscopic, which makes them excellent tracer particles in the flow; together, they make the ocean’s motion visible. Look closely and you’ll see dark streaks across the images showing where ships’ wakes are disrupting the bloom. (Image credit: J. Stevens/USGS; via NASA Earth Observatory)
“Colors”
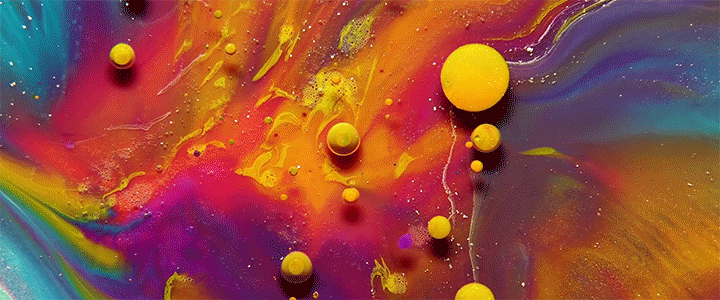


Paint, soap, bleach, oil, and oat milk combine to create the gorgeous colorscapes of Thomas Blanchard’s short film “Colors”. Watch as droplets burst and waves of color flow past. It’s a lovely break from whatever you’re dealing with at the moment, and at less than 3 minutes long, you can spare the time! (Image and video credit: T. Blanchard)

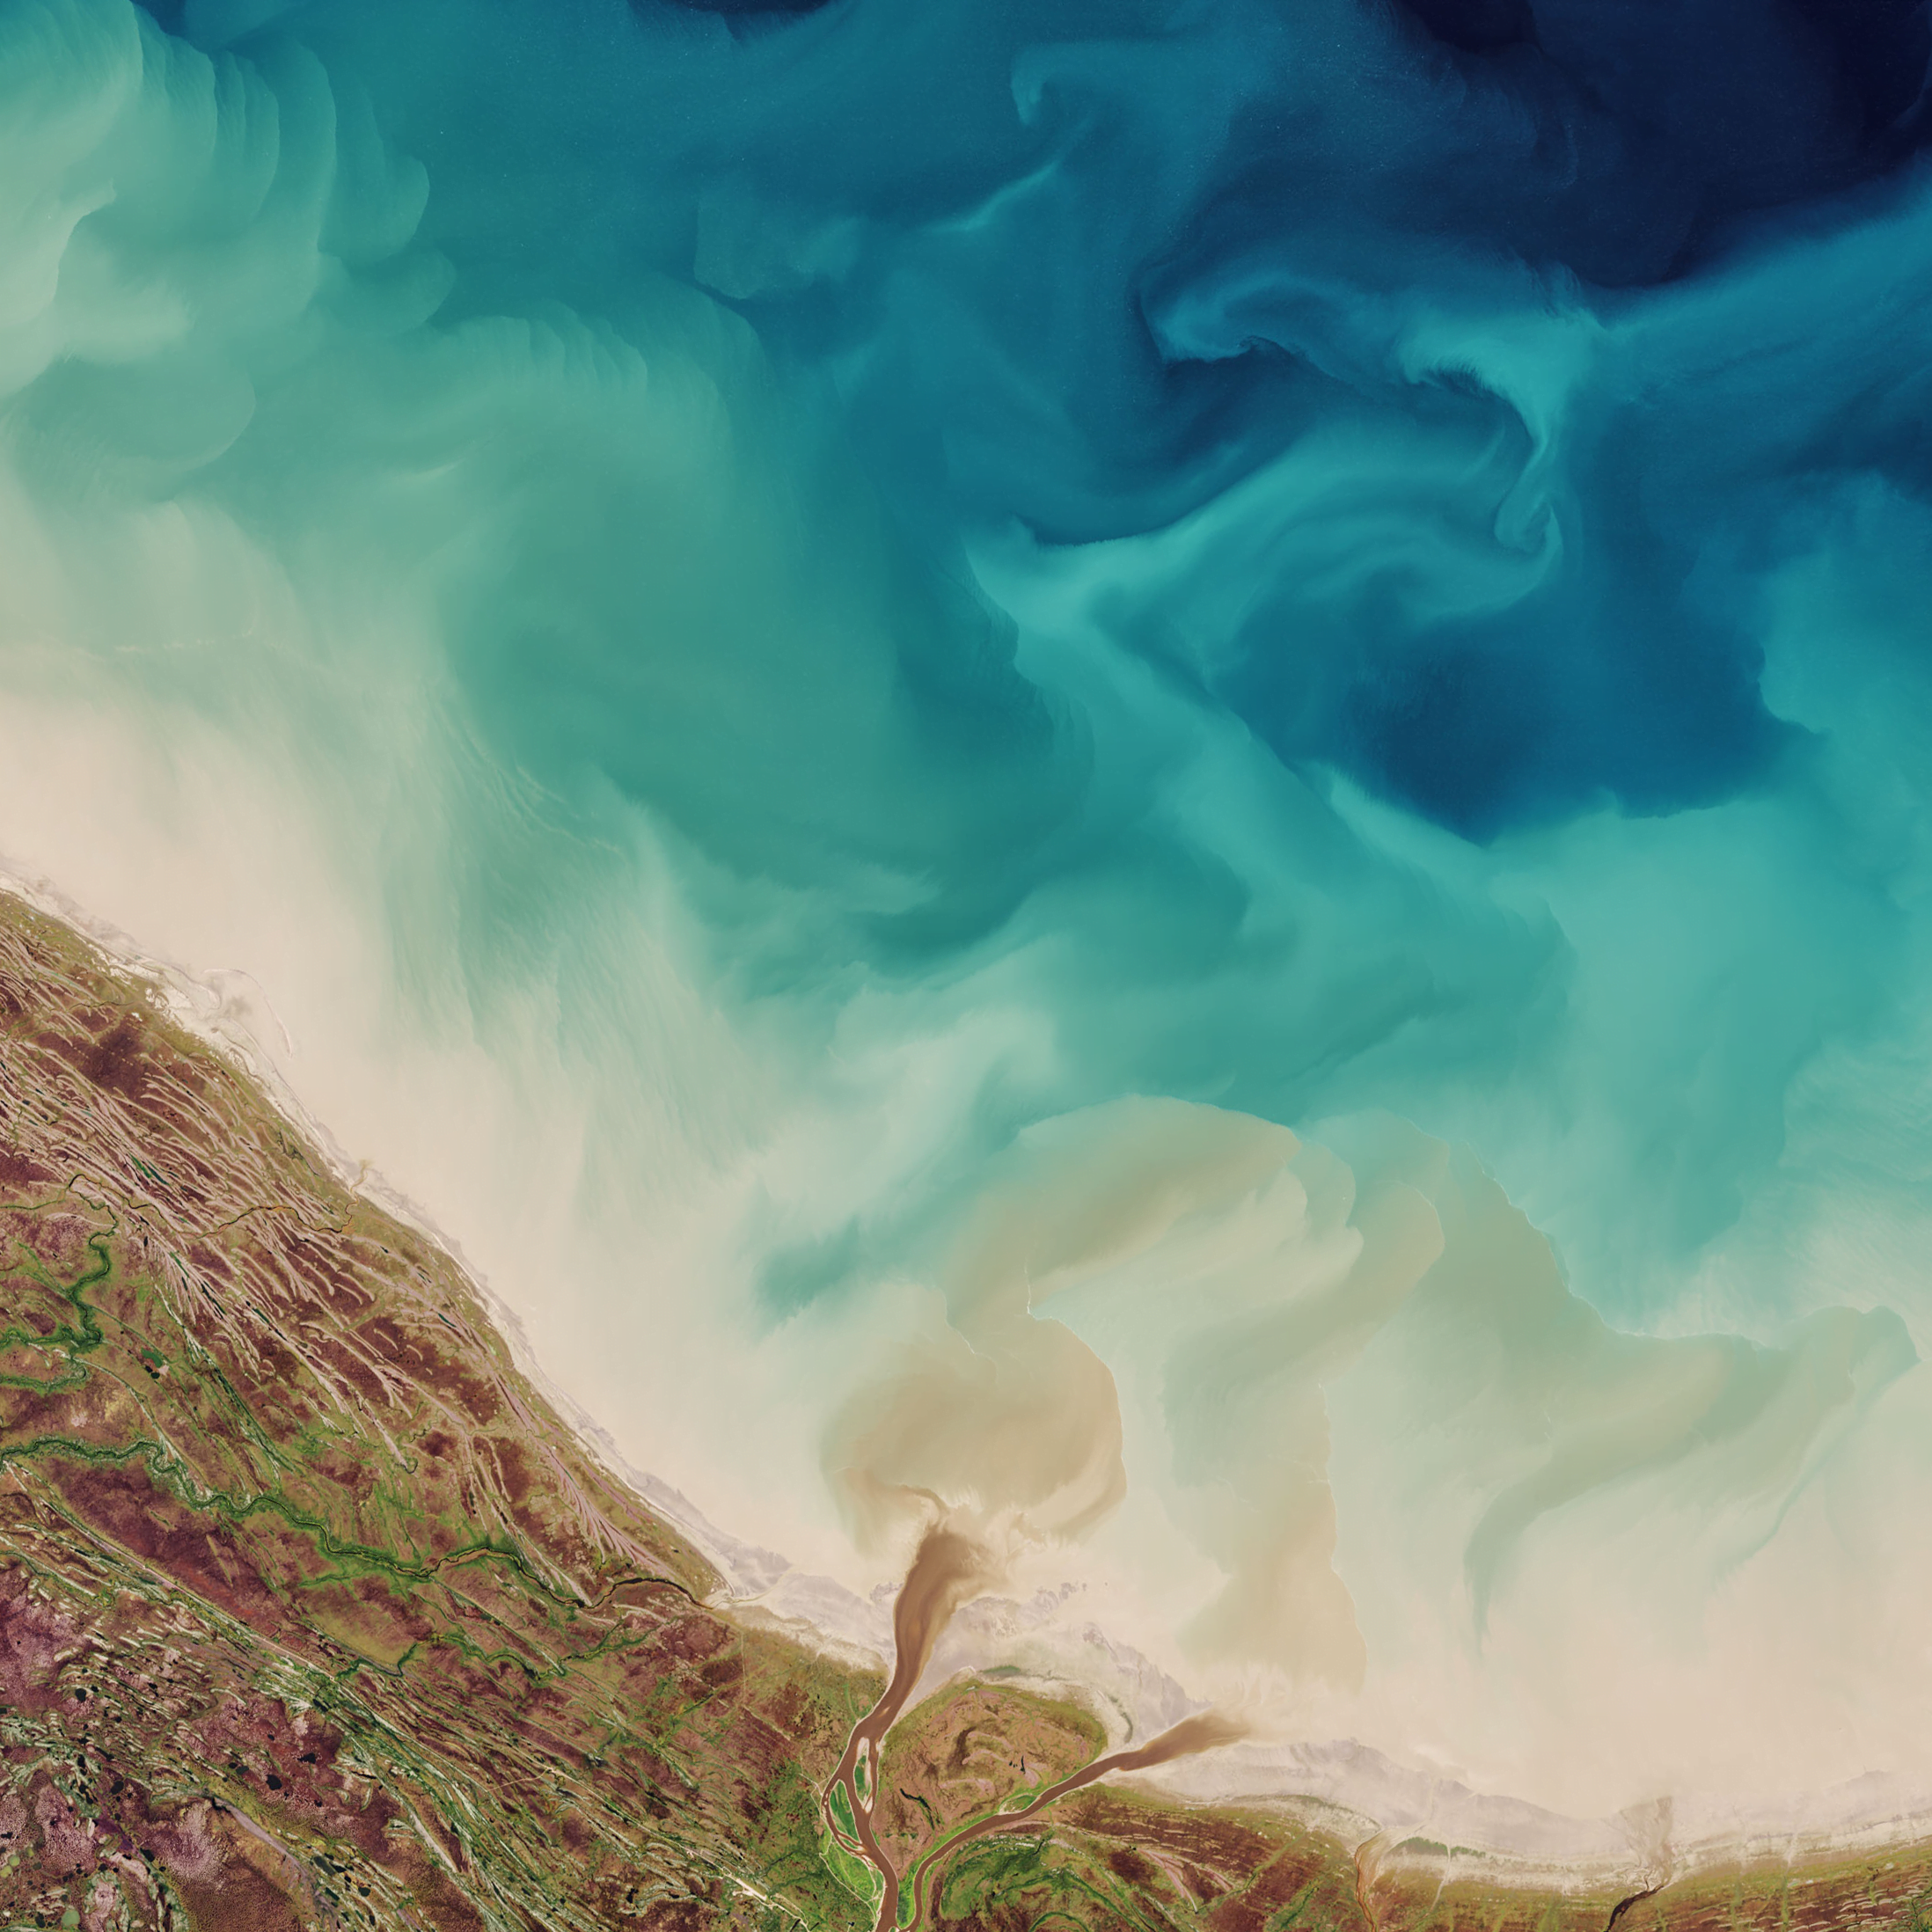
A Colorful Portrait of Flow
This gorgeous, natural-color image shows Lake Balkhash in southeastern Kazakhstan. In early March, the ice on the lake was beginning to break up, revealing glimpses of swirling sediment below the water’s surface. In contrast, the smaller lakes and ponds of the surrounding area remained frozen amidst the wintery browns of the nearby desert and wetlands. (Image credit: J. Stevens/USGS; via NASA Earth Observatory)

Vortex Rings on V-Shaped Walls
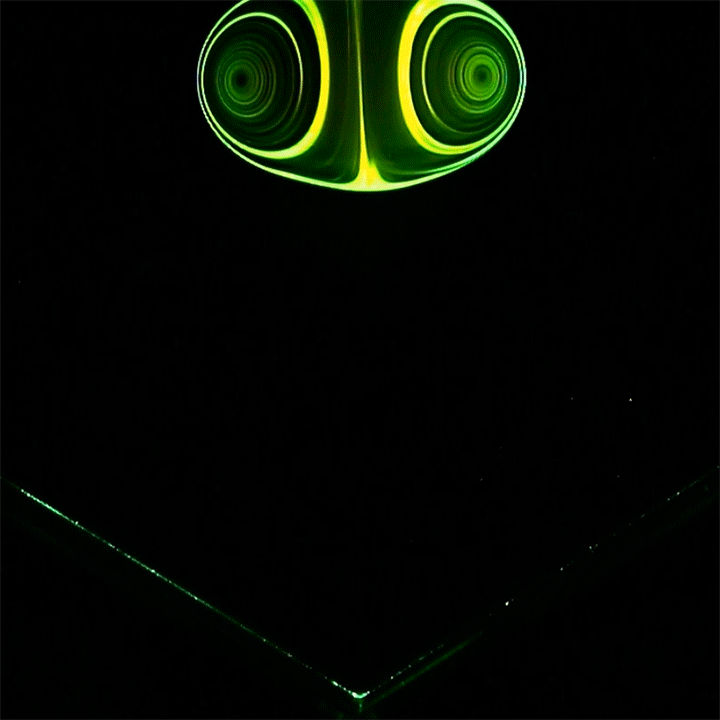

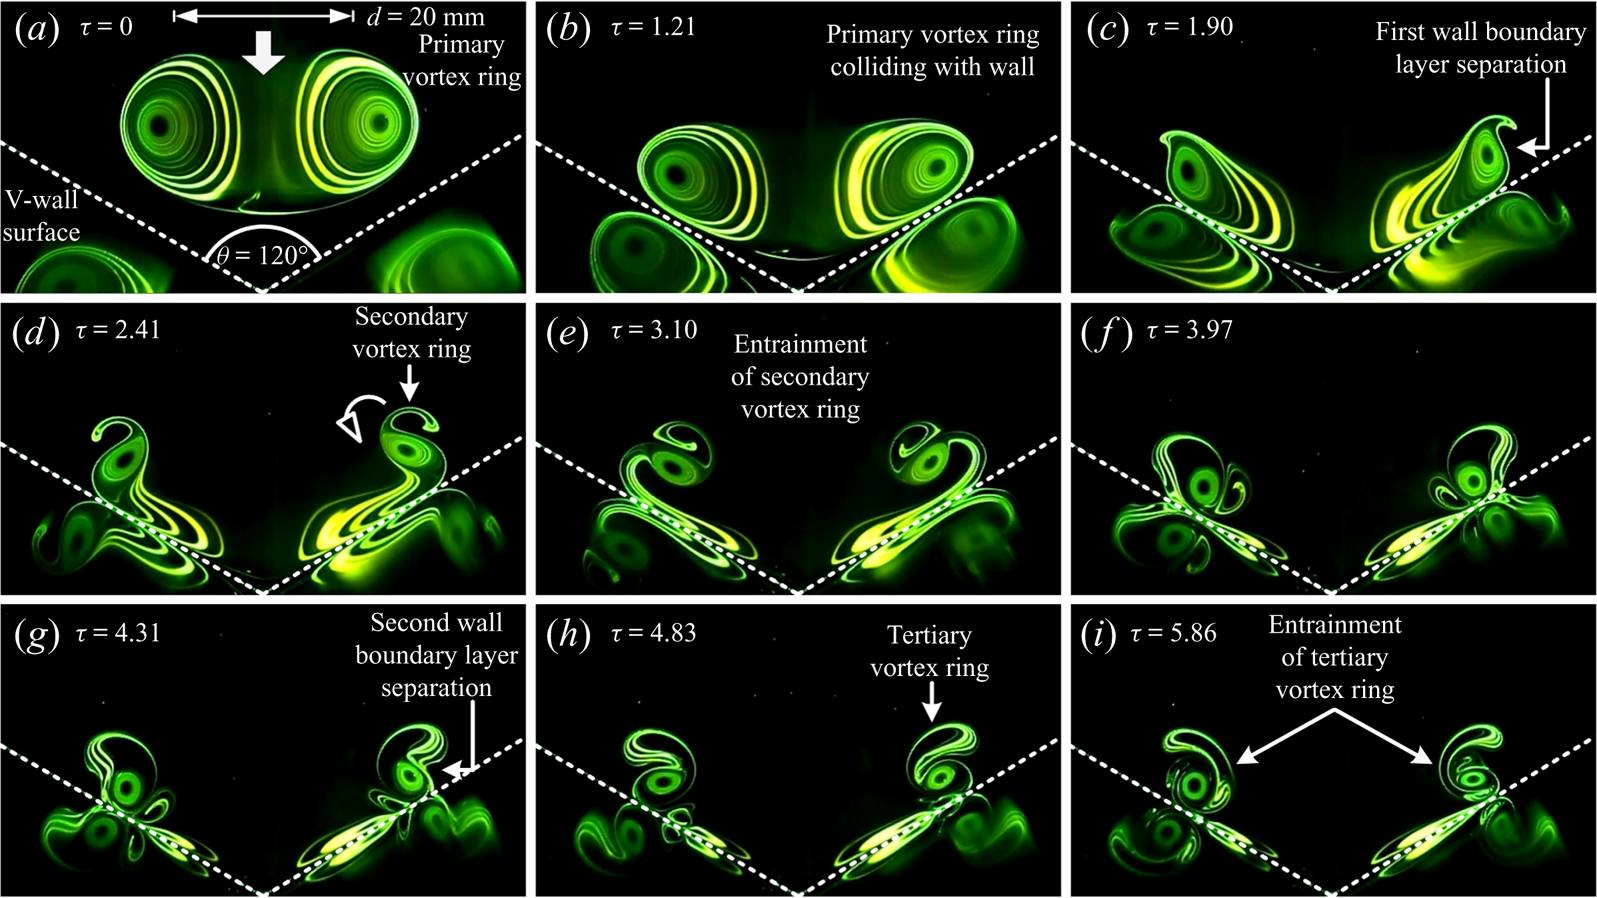
Vortex ring impacts are eternally fascinating. Here, researchers explore what happens when a vortex ring encounters a V-shaped wall. Because the outer portions of the vortex ring hit the wall sooner than the inner ones, distortions begin there first.
The vortex’s approach creates a pressure gradient that causes flow near the wall to separate, generating that first little hook in each arm of the vortex. Next, secondary vortices develop on either side and quickly get pulled into the original vortex. The whole process repeats a second time to generate tertiary vortices that continue the inward spiral. The impact appears even more complicated when viewed from the side of the valley (Image 2). Check out Image 3 for a point-by-point breakdown of the impact process. (Image and research credit: T. New et al.)