The Black Sea gains its name from its dark waters, but those waters don’t stay dark year-round. In this natural color satellite image, streaks of milky blue bloom through the summer waters, thanks to the presence of a species of phytoplankton armored with white calcium carbonate. Despite their microscopic size, the phytoplankton’s presence is visible from space. During other parts of the year, like the spring, another species of phytoplankton dominates the Black Sea, turning its waters darker. (Image credit: J. Stevens; via NASA Earth Observatory)
Tag: flow visualization

Peering Into the Gap
This video offers a glimpse into turbulence developing in a classic flow set-up, a Taylor-Couette cylinder. The apparatus consists of two upright, concentric cylinders; the outer cylinder is fixed, and the inner one rotates. This video shows the gap between the cylinders, and it’s rotated so that the inner cylinder is at the bottom of the frame. Gravity points from left to right in the video. The fluid in the 8-cm gap between the cylinders is water, seeded with rheoscopic particles to visualize the flow.
The video begins as the inner cylinder has just begun to rotate, dragging nearby fluid with it. A thin, laminar boundary layer forms at the bottom of the frame, growing as time goes on. A few seconds in, the boundary layer transitions to turbulence; look closely and you’ll see hairpin-shaped vortices appear. Just after that, the boundary layer becomes entirely turbulent and continues to slowly move upward to take over the full gap. The video is available in a full 4K resolution if you really want to get lost in the flow. (Video credit: D. van Gils)
Aerated Faucets


So much goes on in our daily lives that we never see. But with the power of the smartphones in our pockets, we can catch more than ever before, as illustrated in this video. Here a researcher uses the standard “slo-mo” (240 fps) video mode on a smartphone to look at the flow from a typical kitchen faucet. Household faucets often have an aerator that adds air bubbles to the flow, something that’s particularly visible in slow motion at high flow rates. What you can see depends on more than just the frame rate, though. Without strong illumination — provided in this case by sunlight — you could easily miss the cloud of droplets ejected by the faucet. (Image and video credit: M. Mungal)

Fish-Scale Tides
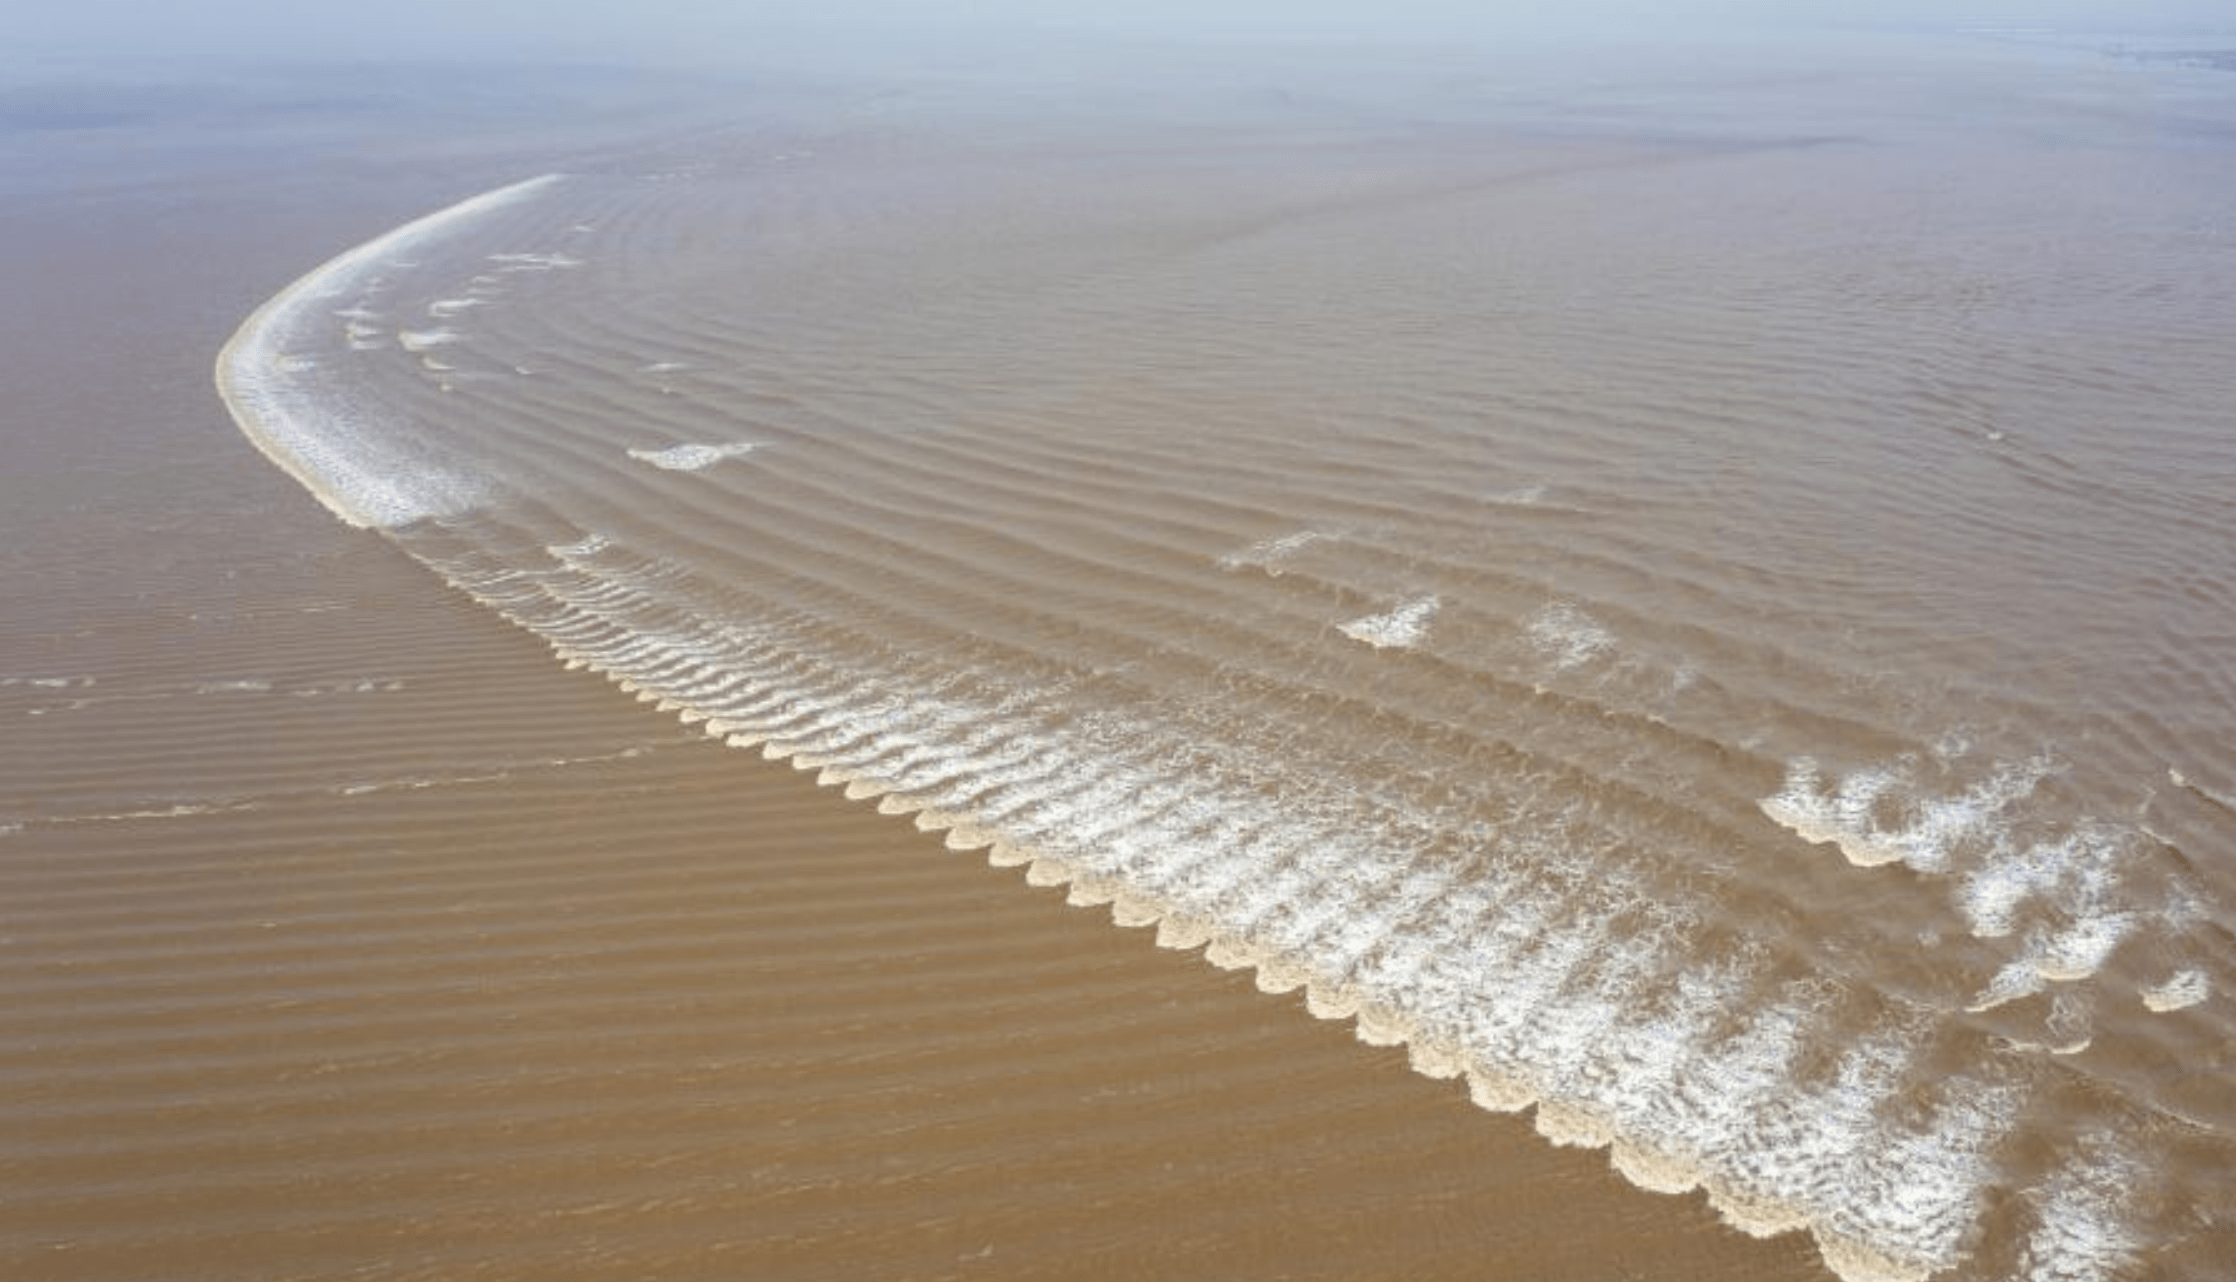
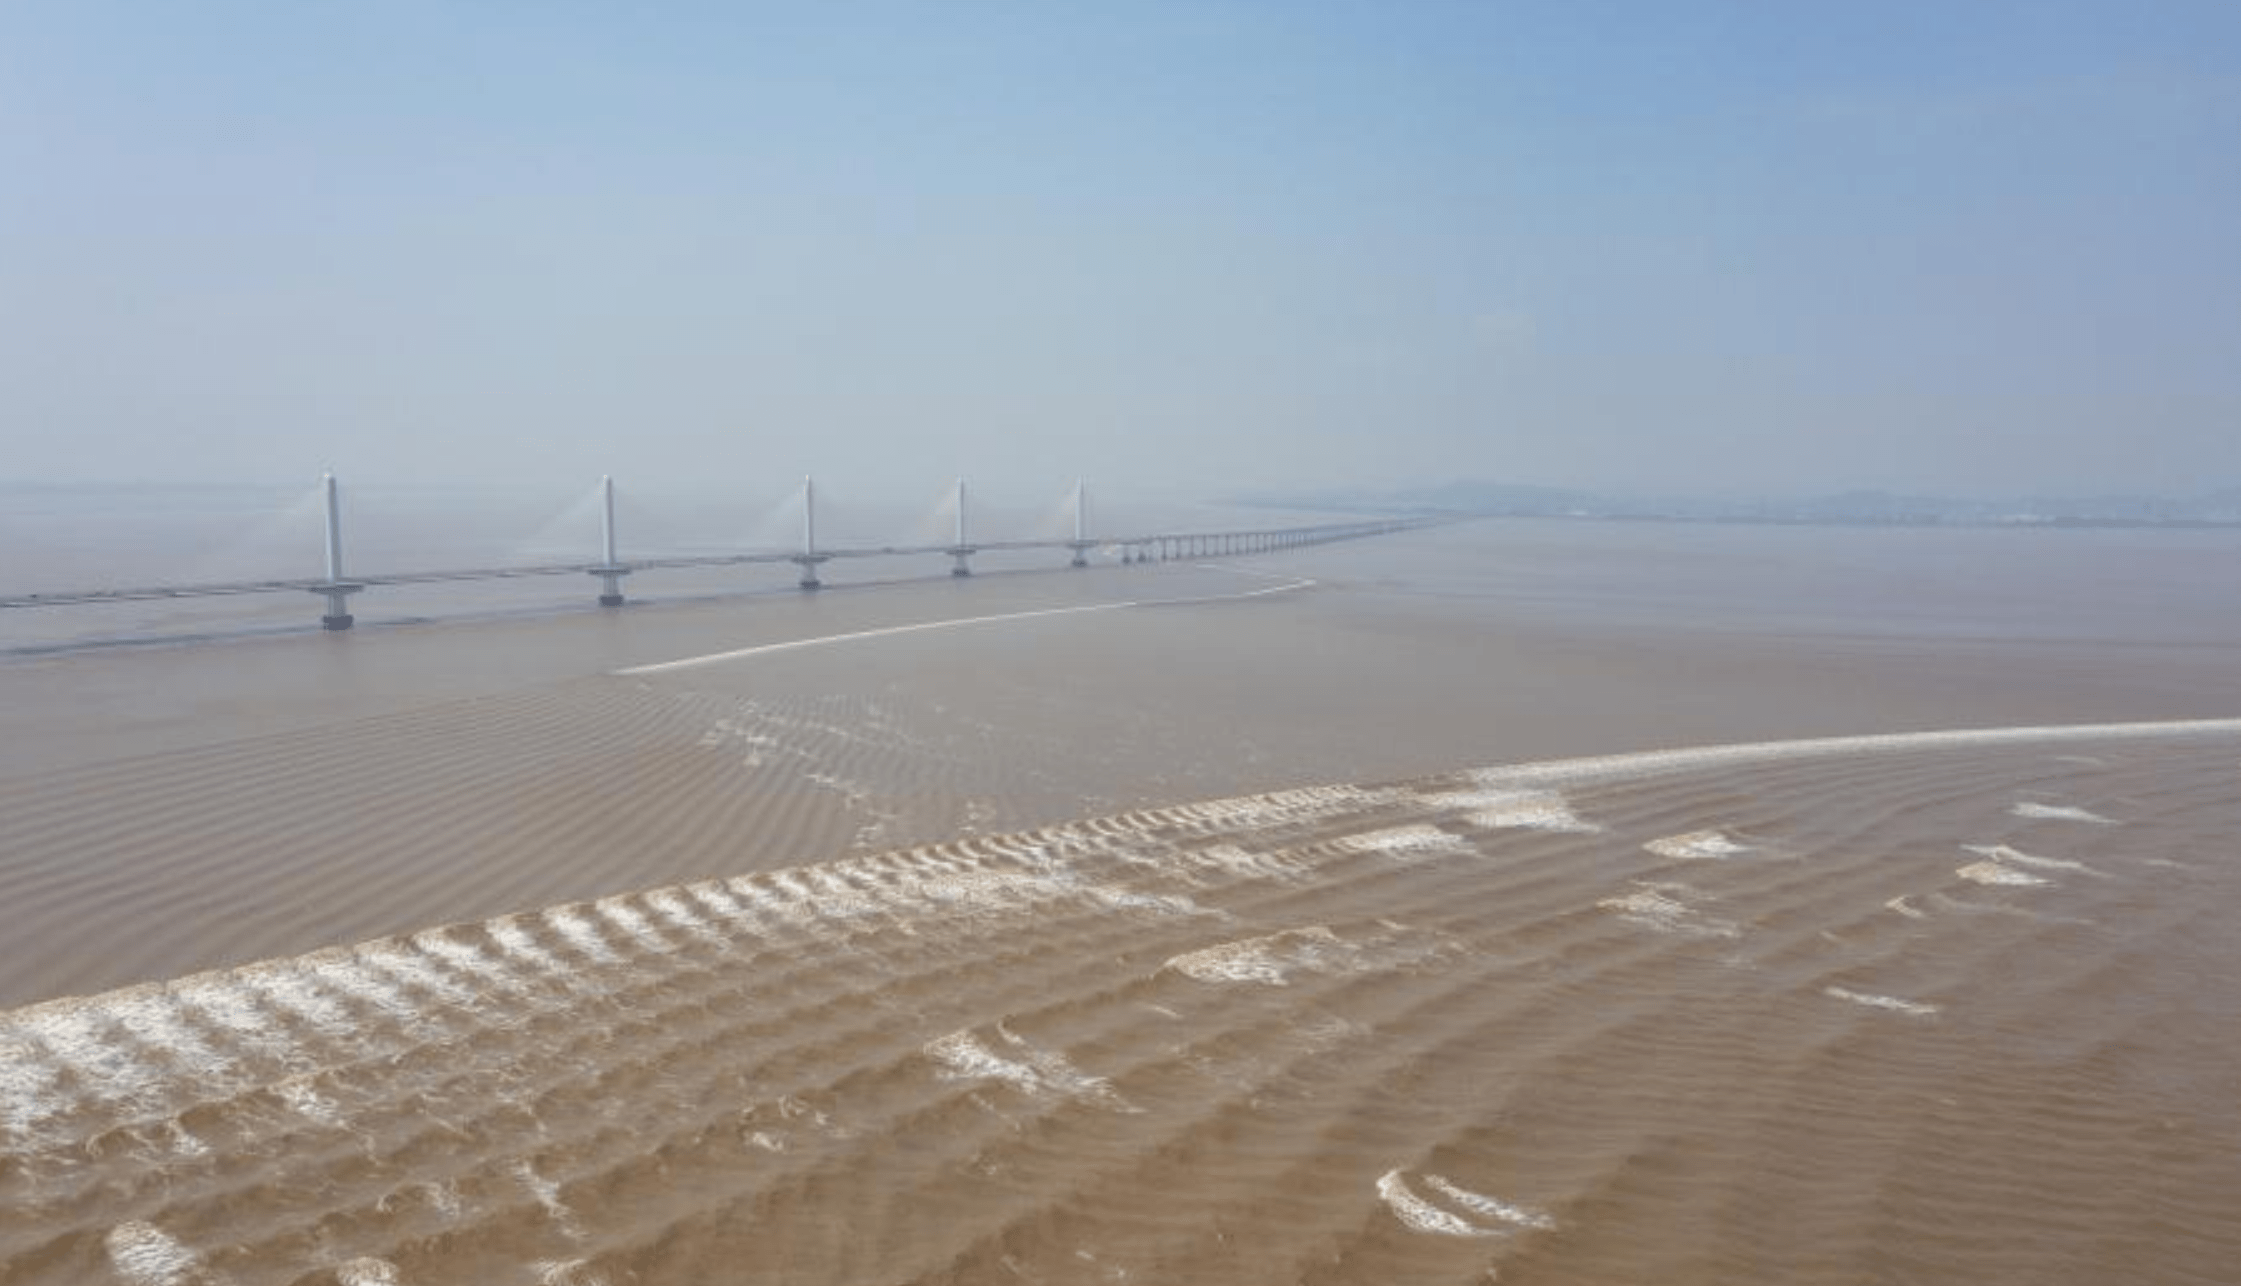
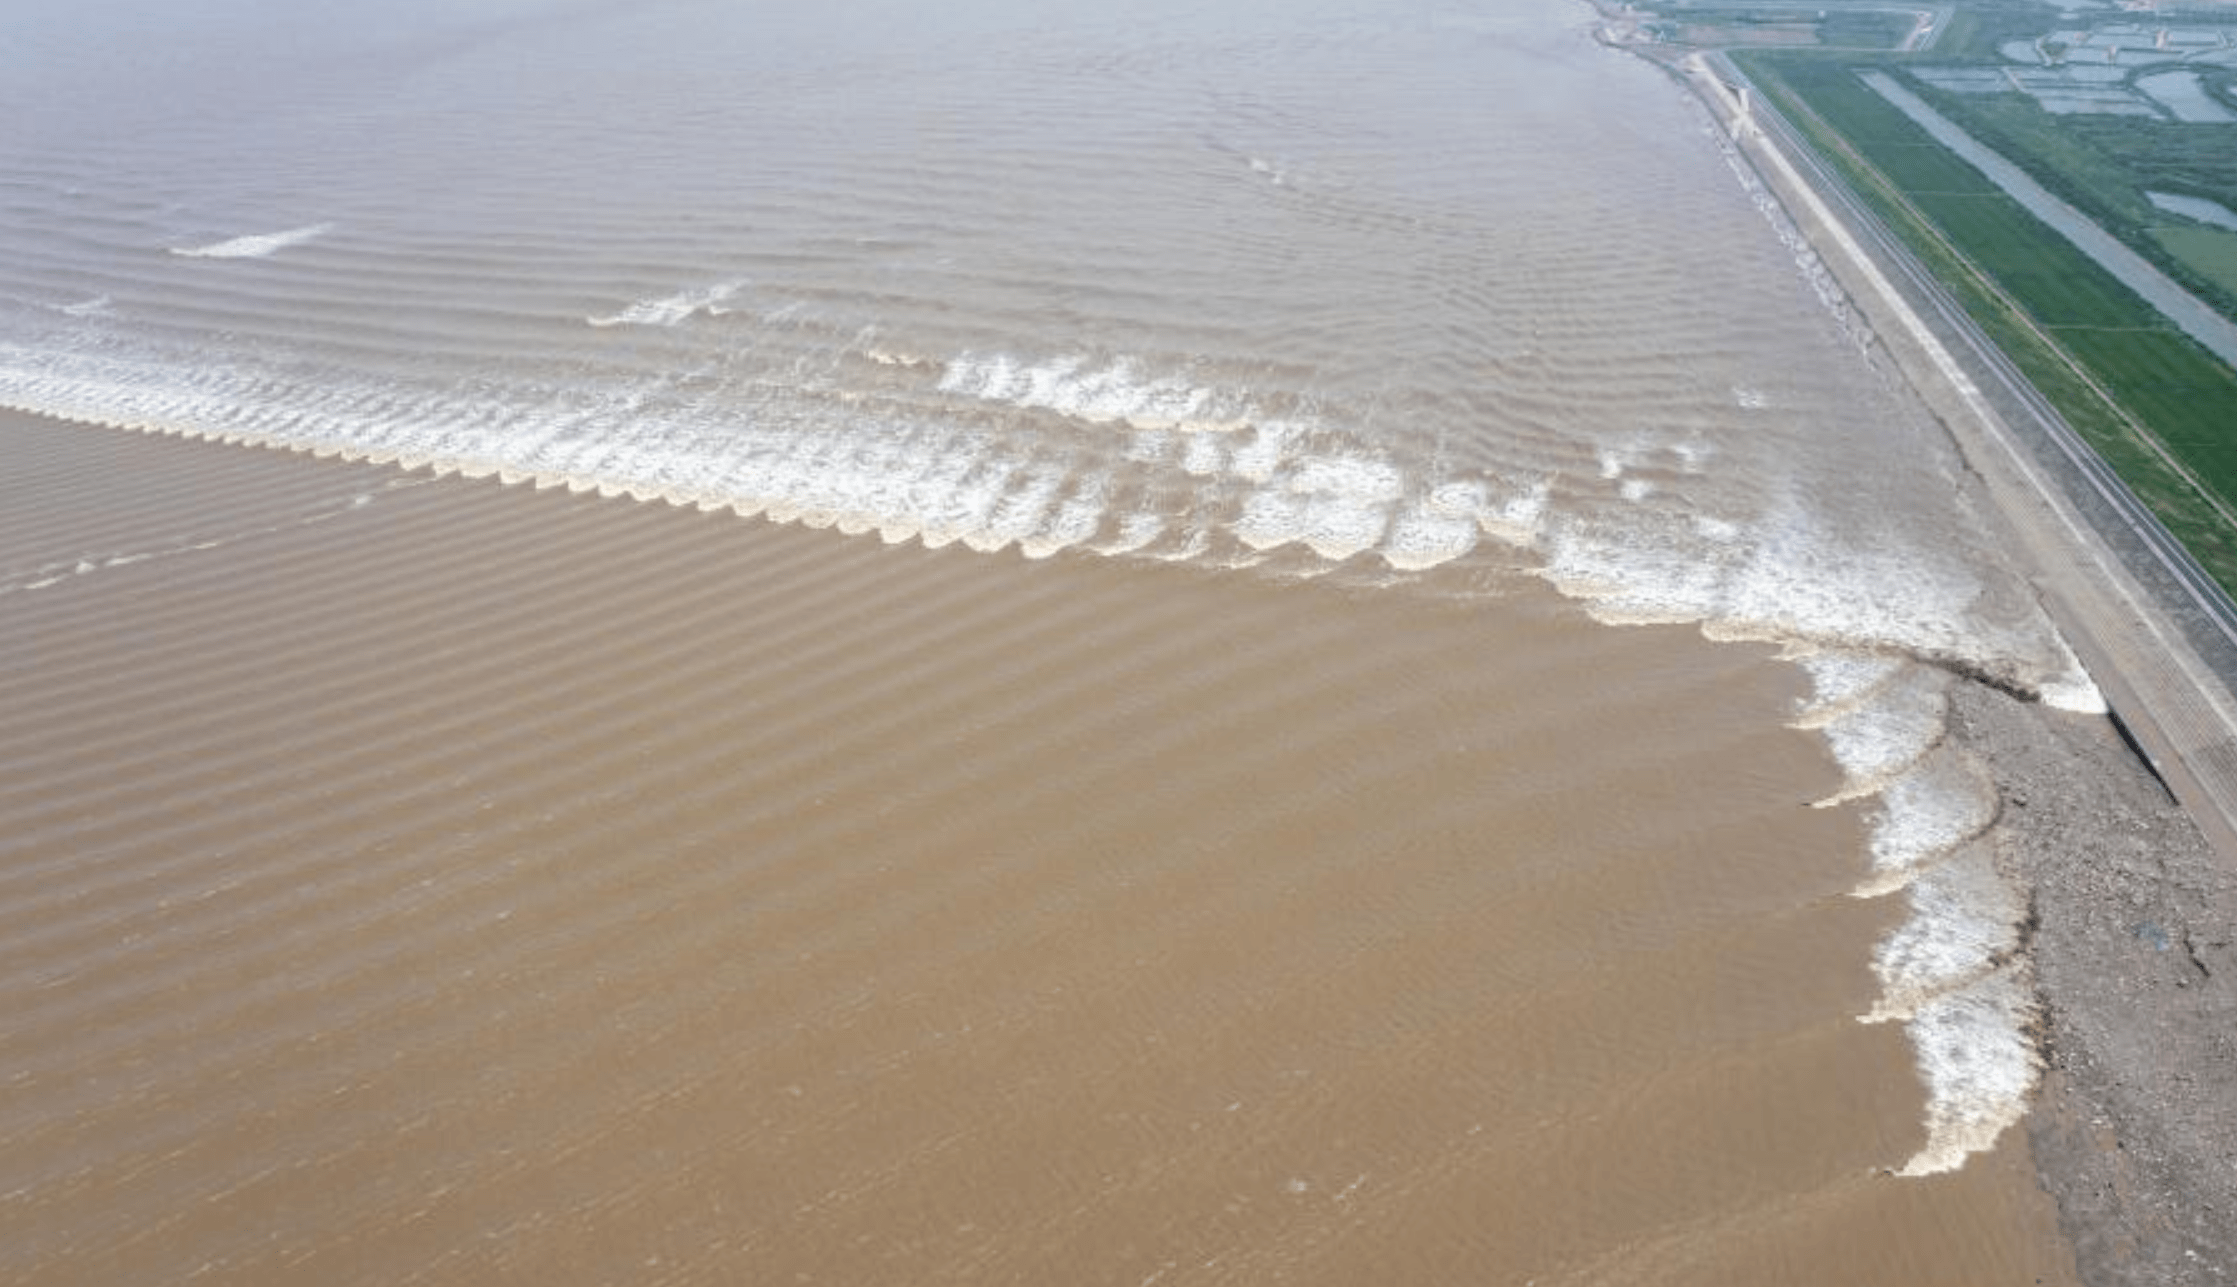
On 31 July 2022, an unusual tidal phenomenon, a fish-scale tide, took place on the Qiantang River’s estuary in Zhejiang Province, China. Here are a couple videos. I’ve not found any explanations for it thus far, so I’m assembling my own. The Qiantang River and its estuary, Hangzhou Bay, are home to the world’s largest tidal bores, reaching 9 meters in places. That means the area regularly sees trains of large waves moving upstream against the normal current.
The area is also known to have rotating currents, meaning that the tide does not simply move inland and then smoothly reverse direction. Instead, a rotating current can change its direction of flow over the course of a tidal cycle without changing its speed. Taken together, this makes the Qiantang River region perfect for winding up with groups of waves colliding at oblique angles, similar to a cross sea. I believe that’s what’s going on here with the fish-scale tide. Two sets of tidal-bore-induced waves are colliding at an angle, creating some gnarly conditions and a very cool pattern. (Image credit: VCG; submitted by Antony B.)
Groundwater-Structure Interactions


Groundwater can sometimes wind up in unexpected places, given the way it interacts with subsurface structures. In this Practical Engineering video, Grady discusses the paths that groundwater takes around structures and how civil engineers account for groundwater-related forces on dams and other buildings. As always, he illustrates with excellent model demos, allowing viewers to see groundwater interactions for themselves. (Image and video credit: Practical Engineering)

Saffman-Taylor Instability
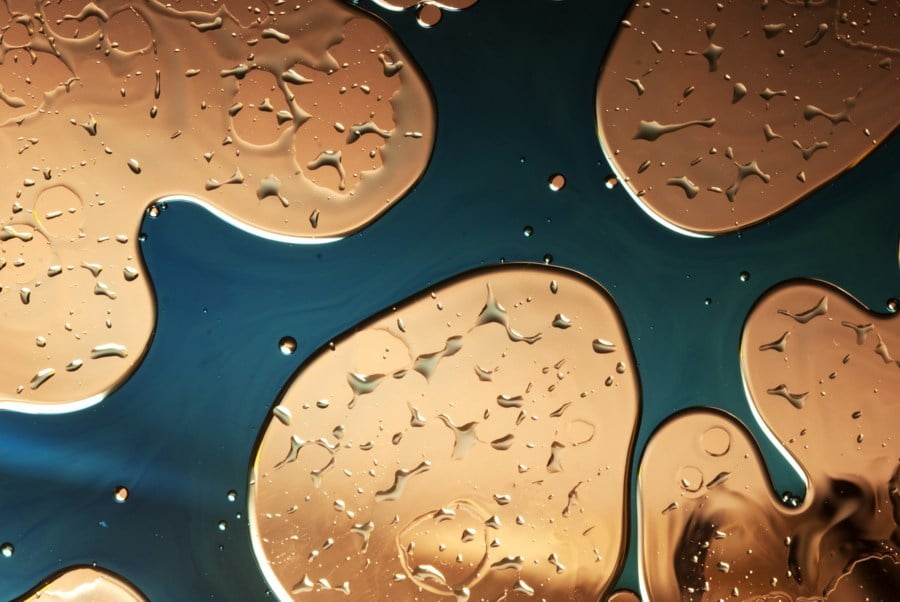
Air and blue-dyed glycerin squeezed between two glass plates form curvy, finger-like protrusions. This is a close-up of the Saffman-Taylor instability, a pattern created when a less viscous fluid — here, air — is injected into a more viscous one. If you reverse the situation and inject glycerin into air, you’ll get no viscous fingers, just a stable, expanding circle. Although you sometimes come across this instability in daily life — like in a cracked smartphone screen — the major motivation for studying this phenomenon historically has been oil and gas extraction. (Image credit: T. Pohlman et al.)
Seeing the Flow


Experimentalists often need a sense for the overall flow before they can decide where to measure in greater detail. For such situations, flow visualization techniques are a powerful tool since they provide quick ways to see and compare flows.
Here, researchers paint a viscous oil atop their flying wing model and observe how the oil moves once the air flow starts up. This oil flow visualization shows the large-scale shifts in how air flows over the craft as the angle of attack increases. The disadvantage is that these techniques often give only a qualitative sense of the flow. But they can allow experimentalists to test many different conditions to decide which specific cases they should examine quantitatively. (Image and video credit: V. Kumar et al.)

Liquid Sculptures


Snapshots of splashes are nothing new, but few have mastered the art of freezing incredible shapes in water the way Markus Reugels has. His splash photography is mind-boggling, especially knowing that he uses Photoshop only for minor corrections like contrast and removing sensor noise. Fortunately, he’s generous in sharing his expertise. Check out lots more incredible photos and plenty of how-to guides (mostly in German) over at his site. (Image credits: M. Reugels)

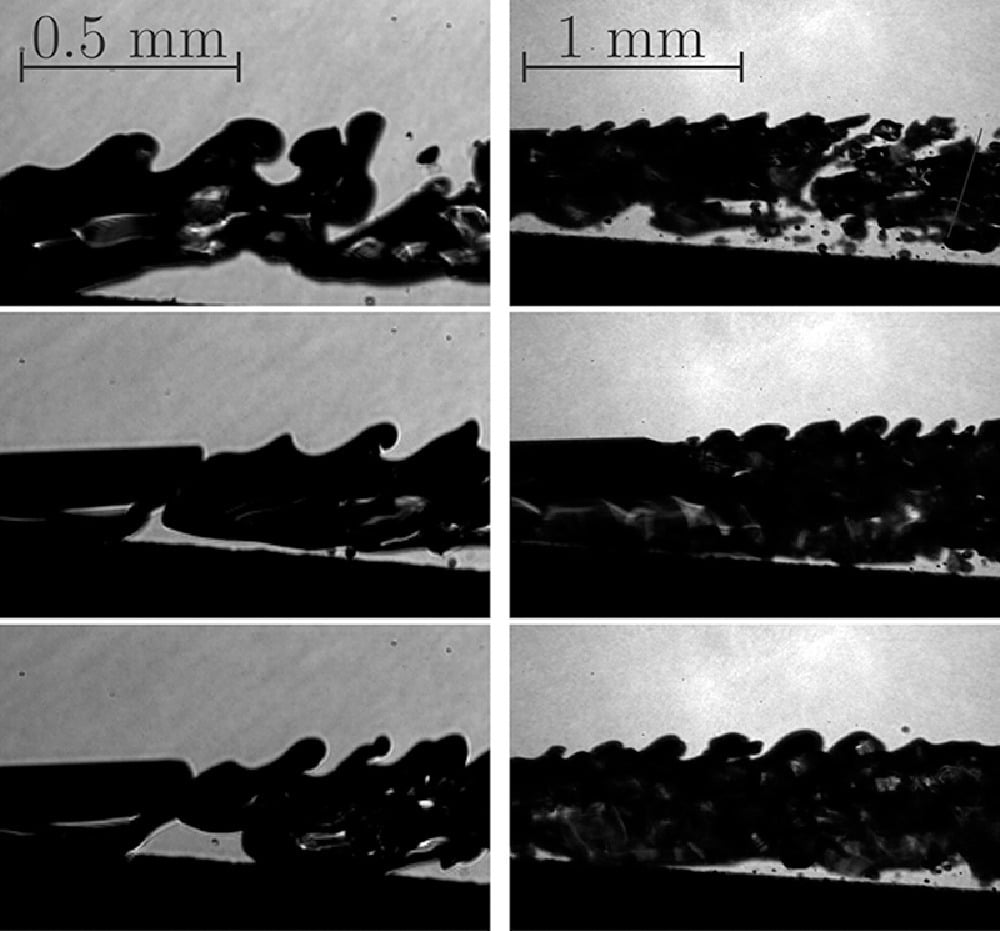
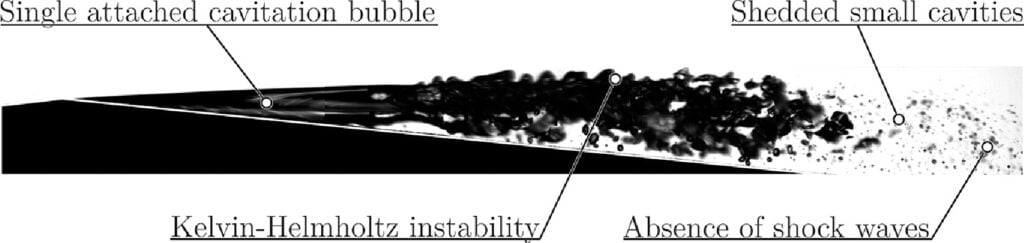
Microscale Kelvin-Helmholtz
When we think of cavitation in a flow, we often think of it occurring at a relatively large scale — on the propeller of a boat, for example. But cavitation takes place on microscales, too, including around fuel-injection nozzles. In this study, researchers investigated submillimeter-scale cavitation using a flow through a tiny Venturi tube. What they found was something we usually associate with larger scale flows: the Kelvin-Helmholtz instability.

The wavy shape of a Kelvin-Helmholtz instability forms when two layers of fluid move past one another at different speeds and the interface where they meet becomes unstable. Here, that happens along a cavitation bubble, where the bubble and the flow meet. Interestingly, at these scales, the Kelvin-Helmholtz instability seems to be the primary method of break-up, instead of shock wave interactions.
For those keeping track, we’ve now seen the Kelvin-Helmholtz instability from the quantum scale up to 160 thousand light-years. It’s hard to achieve a much wider range than that! (Image and research credit: D. Podbevšek et al.; submitted by M. Dular)
“Art of Paint”

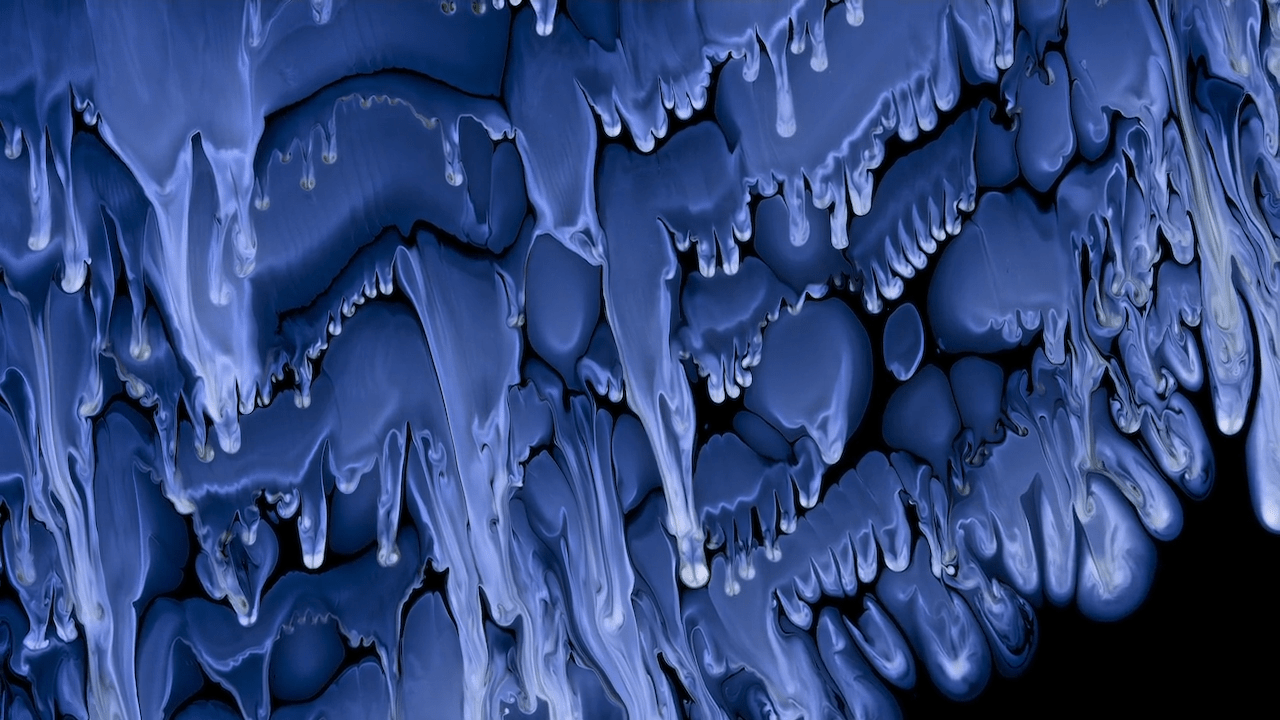
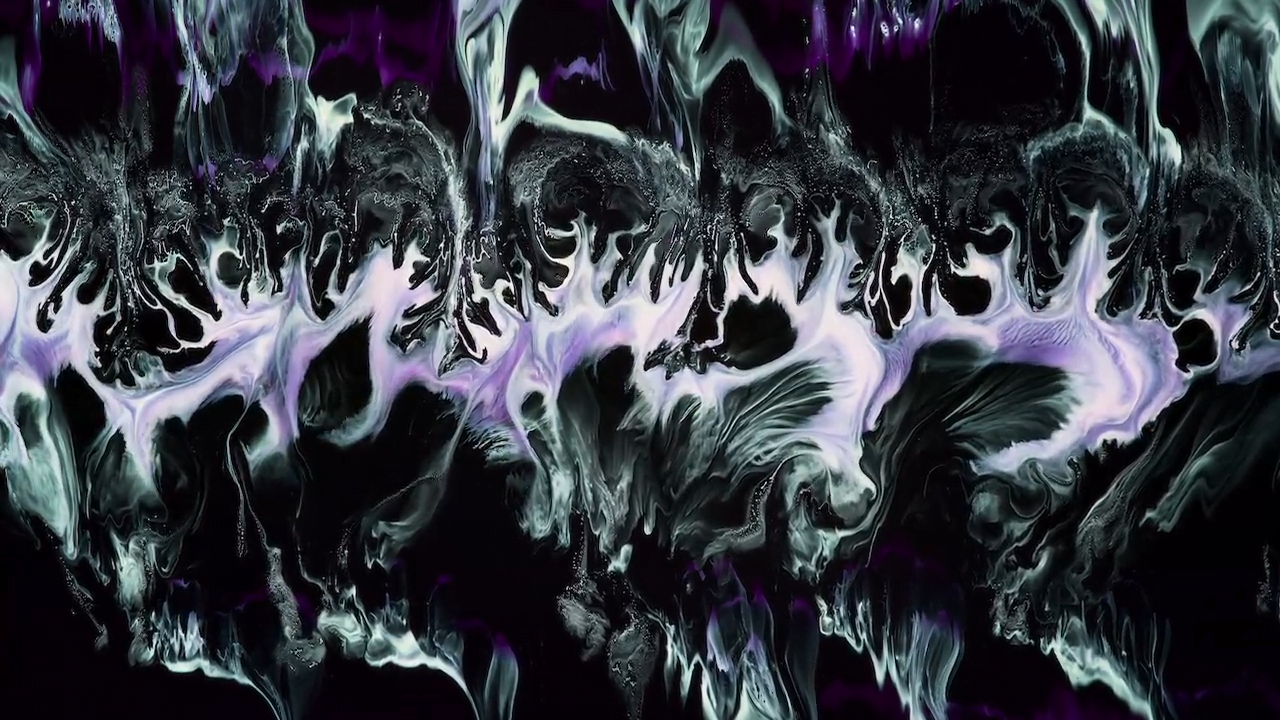
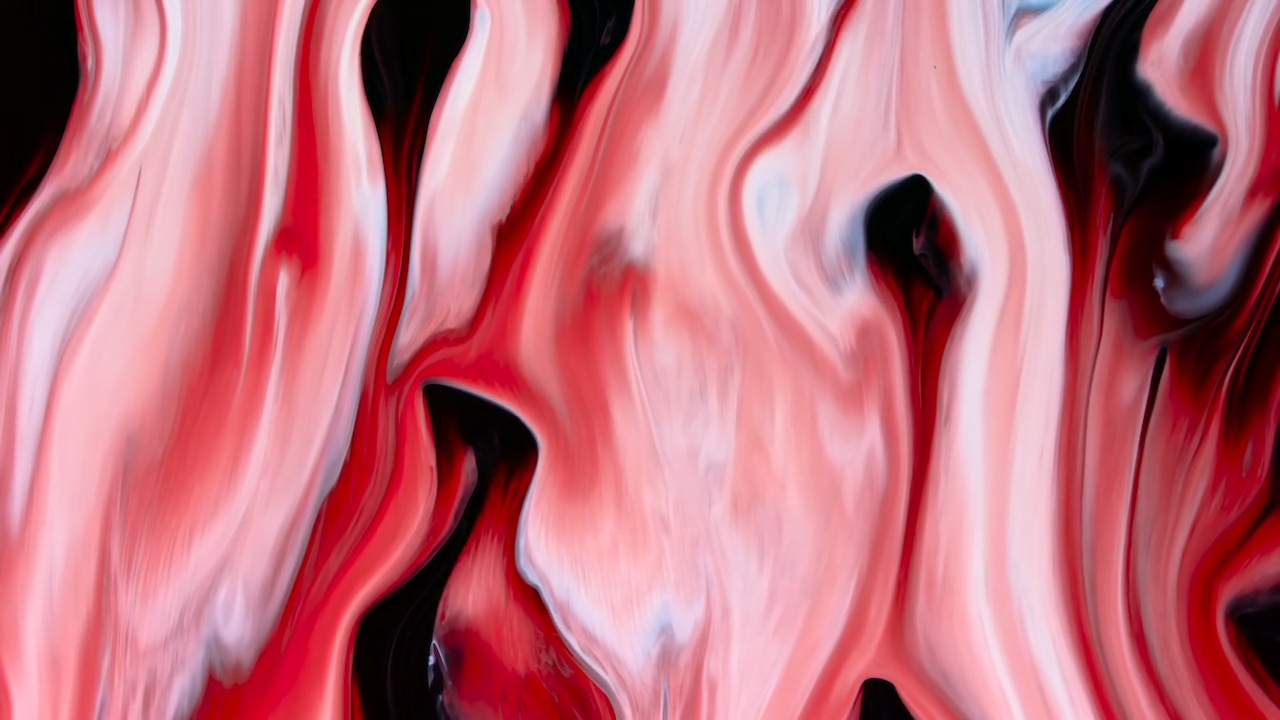
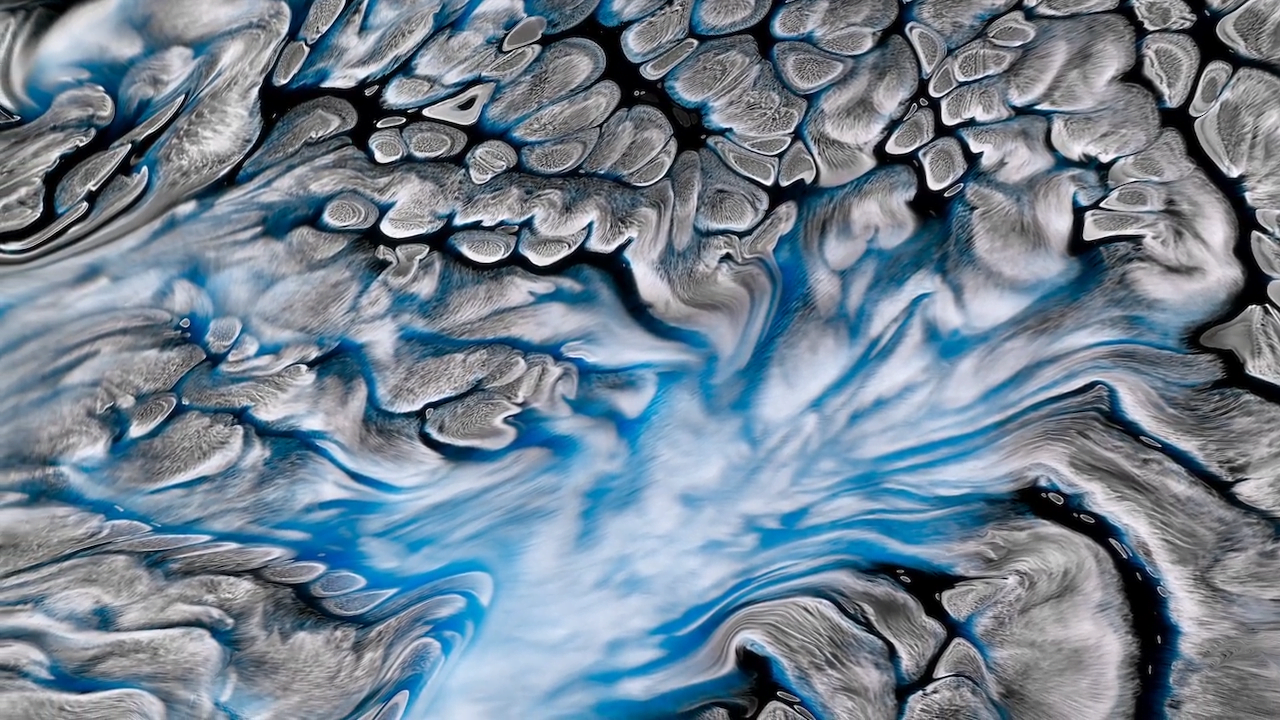
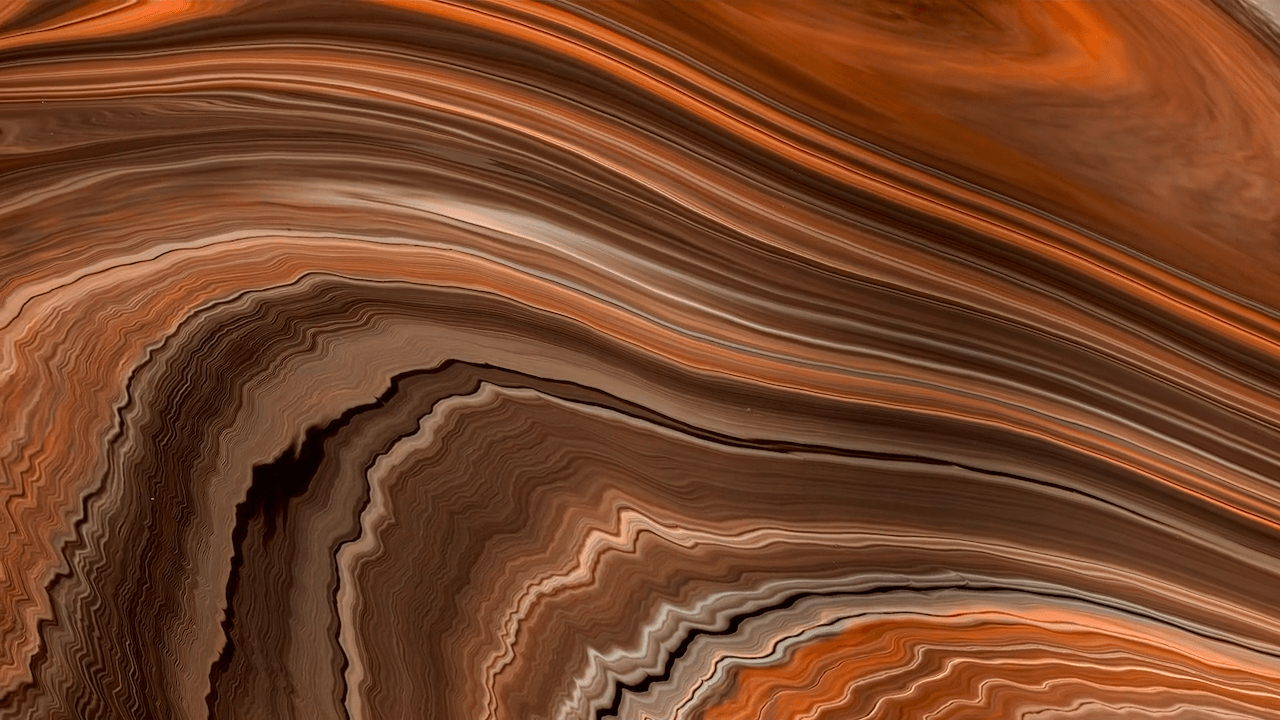
Filmmaker Roman De Giuli is always coming up with spectacular and visually fascinating new ways to manipulate ink and other liquids. In “Art of Paint,” he applies thin layers atop a custom plate that can be tilted in any direction. The results sometimes resemble acrylic paint pours, sometimes Marangoni flows, and sometimes look more like salt fingers or Rayleigh-Taylor instabilities. The extreme variety of forms is quite unique among these sorts of films and is well worth taking the time to view in fullscreen. (Image and video credit: R. De Giuli)