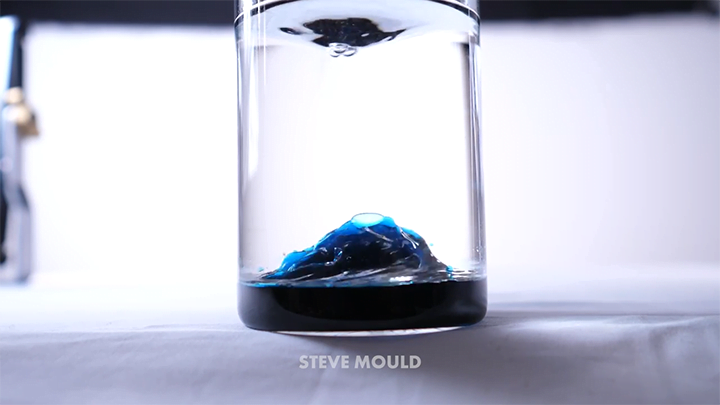
Tag: flow visualization

  • Featured Video Play Icon

    Double Diffusive Flow

    Diffusion is the tendency for differences in a fluid — in density, temperature, or concentration — to even out over time. Think about a drop of food coloring in a glass of water. Even without stirring, that dye will eventually disperse throughout the glass through diffusion. But when there is more than one factor controlling diffusion — like temperature and salinity — things get more complicated. In the ocean, for example, this double-diffusion causes salt fingers like those shown in the first image.

    But what happens when the two diffusing fluid layers are flowing? That’s the question at the heart of this video, which explores the intricate mixing that takes place between doubly-diffusing liquids in a channel. (Video and image credit: A. Mizev et al.)

  • Re-Entry For X-Wings

    Re-Entry For X-Wings

    Fans of sci-fi and fantasy have a long-standing tradition of exploring the physics and/or practicality of creations in their fandom, and Star Wars fans are no exception. Here engineers ask whether Luke Skywalker’s X-wing fighter could survive the descent through Dagobah’s atmosphere as he searched for Master Yoda. Their results are based on a numerical simulation, with some assumptions about the spacecraft’s descent path and design as well as the planet’s atmosphere. Fans of the Jedi will be glad to hear that the X-wing can survive its supersonic descent intact, delivering the last Jedi safely to his mentor. (Image credit: Y. Ling et al.)

  • Watery Salt Flats

    Watery Salt Flats

    Unusually high rainfall in Bolivia’s Salar de Uyuni turned the world’s largest salt flat into a shallow salt lake. These natural-color satellite images show the area in late January 2022. If you zoom in on the full resolution image, there are incredible detailed swirls in the water. It’s like peering at an abstract or Impressionist painting. The many colors are attributable to several sources, including volcanic sediments, runoff, and a variety of microbes and algae thriving in the mineral-filled waters. (Image credit: L. Dauphin; via NASA Earth Observatory)

  • Spinning Tops

    Spinning Tops

    What does the flow look like around a spinning top? Here, researchers used dye to visualize what happens in a Newtonian fluid (like air or water) as well as a viscoelastic fluid. The Newtonian fluid (upper images) divides into two circulating zones, one below the top and one above. They both take the shape of a toroidal, or donut-shaped, vortex, visible here in cross-section.

    The long molecules of the viscoelastic fluid lend it elasticity to resist stretching. The result is a very different flow field. Beneath the top, there’s still a toroidal vortex, though it appears tighter. But around the upper part of the top, there’s a butterfly-like region of recirculation! (Image credit: B. Keshavarz and M. Geri)

  • Featured Video Play Icon

    Eruption in a Box

    In layers of viscous fluids, lighter and less viscous fluids can displace heavier, more viscous liquids. Here, researchers demonstrate this using four fluids sandwiched between layers of glass and mounted in a rotating frame. (Think of those liquid-air-sand art frames found in museums but bigger!)

    In their first example, each layer of fluid is denser than the one beneath it, so buoyancy forces the lowest layer — air — to rise. The air pushes its way through the more viscous layer of olive oil, then slowly makes its way through the even more viscous glycerin before bursting through the last layer in an eruption. As the team varies the viscosity and miscibility of the layers, the movement of the buoyant fluids through the viscous layers changes dramatically. (Image and video credit: A. Albrahim et. al.)

  • Featured Video Play Icon

    Columbia Glacier’s Retreat

    In southeastern Alaska, the Columbia Glacier once stretched as far as Heather Island in Prince William Sound. After a long period of stability, the glacier began retreating in 1980 and currently sits more than 15 miles from its previous extent. This video explores the glacier’s evolution through false-color satellite imagery, which allows researchers to distinguish the glacier from sea ice, open water, exposed rocks, and nearby vegetation. Though rapid overall, the glacier’s retreat takes place in fits and starts, due to a combination of influences including climate change, sea and ice interactions, and the effects of local topography. (Video and image credit: NASA Earth Observatory)

    False-color animation showing the retreat of Alaska's Columbia Glacier since 1980.
    False-color animation showing the retreat of Alaska’s Columbia Glacier since 1980.
  • Wild Patterns in Ionic Liquids

    Wild Patterns in Ionic Liquids

    Ionic liquids are essentially salts in a liquid form. In these images, a mixture of water and ionic liquid separates when heated. This phase separation causes the initial mixture to break into two regions: one low in ionic liquid and one rich in ionic liquid. Because the surface tensions of these two phases are different from one another, complex flow patterns form. (Image and research credit: M. Pascual et al.)

  • Ship Tracks in the Sky

    Ship Tracks in the Sky

    Line-like clouds criss-cross the Pacific Ocean in this satellite image. Each one is a ship track, a remnant left behind a passing ship. As they travel, ships leave a trail of exhaust that seeds the atmosphere with aerosols that serve as additional nucleation sites for clouds. The tiny particles interact with existing low-level clouds, making them brighter. Of course, the aerosols are present in the wake of ships regardless of whether they seed clouds that we can observe. (Image credit: J. Stevens; via NASA Earth Observatory)

  • Elastic Turbulence

    Elastic Turbulence

    Decades ago, engineers pumping polymer-filled drilling liquids into porous rock noticed sudden and dramatic increases in the viscosity of the liquid. Within the tiny pores of the rock, conventional (i.e., inertial) turbulent flow should be impossible — the Reynolds number is simply too low. Now a new experiment points to the source of the high viscosity: elastic turbulence.

    To observe the phenomenon, researchers watched flow in the spaces between glass beads packed into a narrow channel. Videos of flow through one of these pores — roughly 250 microns across — are shown below. When flow rates are low (left), the fluid moves smoothly through the pore, but at higher flow rates (right), chaotic fluctuations emerge, creating the dramatic increase in apparent viscosity. In their analysis, the researchers found that the polymers’ motions generated the flow fluctuations, but most of the viscosity increase was inherent to the fluid’s movement, not to the polymers’ resistance to stretching. (Image credit: top – M. van den Bos, pore flow – Datta Lab; research credit: C. Browne and S. Datta; via Quanta Magazine; submitted by Kam-Yung Soh)

    Video of smooth flow through a pore (left) and flow with elastic turbulence (right).
    At low flow rates (left), the fluid moves smoothly through the tiny pores, but at higher flow rates (right), the polymers in the flow generate elastic turbulence that greater increases the fluid’s apparent viscosity.
  • Volcanic Shocks

    Volcanic Shocks

    A violent underwater eruption at the Hunga Tonga-Hunga Ha’apai caldera on January 15th sent literal shock waves around the world. This animation, based on satellite images from Japan’s Himawari 8, shows the fast-moving shock waves and the growing ash plume coming from the uninhabited island. Although most recent eruptions from this volcano have been small, experts suspect that this latest eruption is part of a major event, similar to the volcano’s last big eruption about 1,000 years ago.

    The explosiveness of the eruption comes from the interaction of seawater and fresh magma. When the magma erupts quickly underwater, the hot liquid contacts seawater directly rather than forming a protective layer of vapor (as in the Leidenfrost effect). The resulting explosion tears the magma apart, exposing more hot surfaces to the cold water and further driving the chain reaction. (Image credit: S. Doran/Himawari 8; submitted by jpshoer; see also S. Cronin)