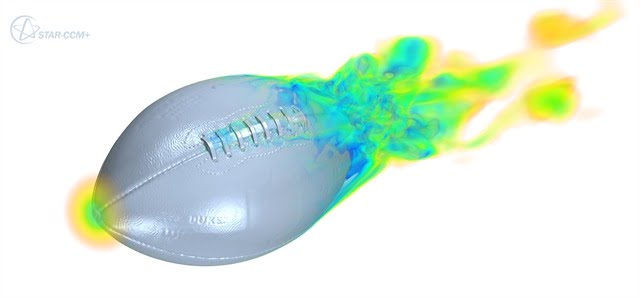
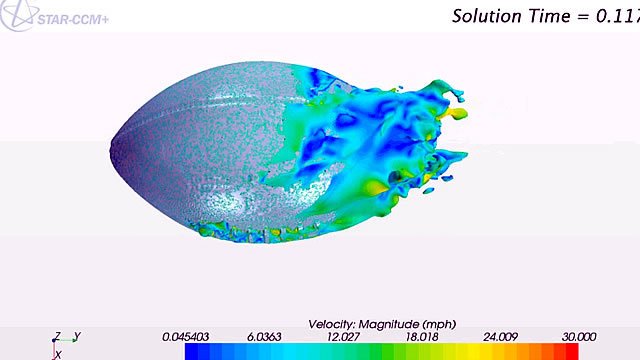
Type 1a supernovae occur in binary star systems where a dense white dwarf star accretes matter from its companion star. As the dwarf star gains mass, it approaches the limit where electron degeneracy pressure can no longer oppose the gravitational force of its mass. Carbon fusion in the white dwarf ignites a flame front, creating isolated bubbles of burning fluid inside the star. As these bubbles burn, they rise due to buoyancy and are sheared and deformed by the neighboring matter. The animation above is a visualization of temperature from a simulation of one of these burning buoyant bubbles. After the initial ignition, instabilities form rapidly on the expanding flame front and it quickly becomes turbulent. (Image credit: A. Aspden and J. Bell; GIF credit: fruitsoftheweb, source video; via freshphotons)
Tag: computational fluid dynamics

Hummingbird Hovering
The hummingbird has long been admired for its ability to hover in flight. The key to this behavior is the bird’s capability to produce lift on both its downstroke and its upstroke. The animation above shows a simulation of hovering hummingbird. The kinematics of the bird’s flapping–the figure-8 motion and the twist of the wings through each cycle–are based on high-speed video of actual hummingbirds. These data were then used to construct a digital model of a hummingbird, about which scientists simulated airflow. About 70% of the lift each cycle is generated by the downstroke, much of it coming from the leading-edge vortex that develops on the wing. The remainder of the lift is creating during the upstroke as the bird pulls its wings back. During this part of the cycle, the flexible hummingbird twists its wings to a very high angle of attack, which is necessary to generate and maintain a leading-edge vortex on the upstroke. The full-scale animation is here. (Image credit: J. Song et al.; via Wired; submitted by averagegrdy)

Blood Flow Simulations
Though we may not often consider it, our bodies are full of fluid dynamics. Blood flow is a prime example, and, in this video, researchers describe their simulations of flow through the left side of the heart. Beginning with 3D medical imaging of a patient’s heart, they construct a computational domain – a meshed virtual heart that imitates the shape and movements of the real heart. Then, after solving the governing equations with an additional model for turbulence, the researchers can observe flow inside a beating heart. Each cycle consists of two phases. In the first, oxygenated blood fills the ventricle from the atrium. This injection of fresh blood generates a vortex ring. Near the end of this phase, the blood mixes strongly and appears to be mildly turbulent. In the second phase, the ventricle contracts, ejecting the blood out into the body and drawing freshly oxygenated blood into the atrium. (Video credit: C. Chnafa et al.)

Supersonic Bubble Shock Waves
Supercomputing has been an enormous boon to fluid dynamics over the past few decades. Many problems, like the interaction between a supersonic shock wave and a bubble, are too complicated for analytical solutions and difficult to measure experimentally. Numerical simulation of the problem, combined with visualization of key variables, adds invaluable understanding. Here a shock wave strikes a helium bubble at Mach 3, and the subsequent interactions in terms of density and vorticity are shown. This situation is relevant to a number of applications, such as supersonic combustion and shockwave lithotripsy–a medical technique in which kidney stones are broken up inside the body using shock waves. After impact, an air jet forms and penetrates the center of the structure while the outer regions mix and form a persistent vortex ring. (Video credit: B. Hejazialhosseini et al.; via Physics Buzz)

Reader Question: How Useful is Flow Viz?
Reader Andrew asks:
I’ve noticed you’ve posted a bunch of flow visualization/wind tunnel content. I’m just curious where how useful information is obtained from these. Is it just observation? Or are there instruments that are usually used in conjunction with these techniques to provide data?
Great question, Andrew! The answer can vary based on the technique and application. In some cases, flow visualization is used for purely qualitative observation, but in others it can provide more quantifiable data. For example, the water tunnel flow visualization of Google’s heliostat array gave very qualitative data about flow around a given configuration but allowed quick evaluation of many configurations. Flow visualization can also help identify key features for additional study like vortices in a wake. This identification of structure can be so useful that even in computational fluid dynamics, where researchers have all possible information about pressure, temperature, and velocity in a flow field, flow visualization is regularly used to identify underlying structures.
Some flow visualization methods can also give very specific information. Oil-flow visualization gives a snapshot of shear stress at the surface of an object, letting an engineer identify at a glance areas of laminar and turbulent flow as well as regions with vortices and streaks. Naphthalene flow visualization and infrared thermography are both great for identifying the location of laminar-turbulent transition and can do so across the span of an object, which is much easier than trying to traverse a probe across the entire object. And some forms of flow visualization allow for extraction of velocity field information, as in particle image velocimetry. In this technique, tiny particles seed the flow and carefully timed image pairs are taken and correlated to determine the flow field velocity based on the changes in particle positions between images.
Like every measurement, flow visualization methods have their strengths and limitations. But for many applications, flow visualization provides much more than just pretty pictures and thus remains an important tool in any fluid dynamicist’s arsenal!

Supercomputed Fluids
Computational fluid dynamics and supercomputers can produce some stunning flow visualizations. Above are examples of turbulence, the Rayleigh-Taylor instability, and the Kelvin-Helmholtz instability. Be sure to check out LCSE’s website for more; they’ve included wallpapers of some of the most spectacular ones. (Photo credits: Laboratory for Computational Science and Engineering, University of Minnesota, #)
Formula 1 Aerodynamics
[original media no longer available]
Computational fluid dynamics (CFD) and the advent of supercomputing have forever changed the way engineers design. Here the use of CFD in the design of Formula 1 racing cars is discussed. Although CFD is used by many companies in place of wind tunnel testing, each method has its advantages. CFD provides information about all flow quantities at all points in the flow but can only do so with an accuracy dependent on the grid and models used. It remains impossible to solve the equations of motion exactly for any problem of practical application because the computational cost is simply too high; instead software packages like FLUENT utilize turbulence models that approximate the physics. Wind tunnel testing, on the other hand, is physically accurate but typically yields only limited data and flow quantities due to the difficulty of instrumentation. (Video credit: BBC News; submitted by carhogg)
(Source: /)
The Sinking of the Lusitania
In 1915, the early days of submarine warfare, the RMS Lusitania was sunk off the coast of Ireland by a torpedo. Eyewitnesses reported a second, more powerful explosion just after the torpedo strike–possibly a boiler or powder explosion–that contributed to the ship sinking in only 18 minutes, resulting in nearly 1200 lives lost. Researchers at Lawrence Livermore National Laboratory have tackled the historic mystery, combining computational efforts with experimentation and historical research to reconstruct the physics of what happened. The full documentary airs tonight on the National Geographic Channel as “Dark Secrets of the Lusitania”. (submitted by Stephanie N)

New CPU Fan
This video discusses a new quieter and more efficient CPU fan developed by engineers at Sandia National Labs. As the impeller spins, it draws ambient air down the center of the impeller while the shape of the fins forces air past the fins and out radially. As the air flows over the fins, it draws heat from the CPU away. In a sense, the design combines a heat sink with a fan. (Video credit: Sandia National Labs; submitted by Adam L)

Simulated Turbulence
This image, taken from a direct numerical simulation, shows turbulence in a stably stratified flow in which lighter fluid sits atop a denser fluid. In the image lighter colors represent denser fluid. Turbulence is created by the shear forces caused when the lighter fluid on top moves faster than the denser fluid on the bottom; however the stable stratification will tend to counteract or stabilize the turbulence. Note the vast variety and detail of the scales involved in turbulence; this is what makes it such a difficult process to simulate and model. (Image credit: G. Matheou and D. Chung, NASA/JPL-Caltech)


