Temperatures in the Arctic are rising faster than elsewhere, triggering more and more melting. Photographer Scott Portelli captured a melting ice shelf protruding into the ocean in this aerial image. Across the top of the frozen landscape, streams and rivers cut through the ice, leading to waterfalls that flood the nearby ocean with freshwater. This meltwater will do more than raise ocean levels; it changes temperature and salinity in these regions, disrupting the convection that keeps our planet healthy. (Image credit: S. Portelli/OPOTY; via Colossal)
Tag: climate change

How CO2 Gets Into the Ocean


Our oceans absorb large amounts of atmospheric carbon dioxide. Liquid water is quite good at dissolving carbon dioxide gas, which is why we have seltzer, beer, sodas, and other carbonated drinks. The larger the surface area between the atmosphere and the ocean, the more quickly carbon dioxide gets dissolved. So breaking waves — which trap lots of bubbles — are a major factor in this carbon exchange.
This video shows off numerical simulations exploring how breaking waves and bubbly turbulence affect carbon getting into the ocean. The visualizations are gorgeous, and you can follow the problem from the large-scale (breaking waves) all the way down to the smallest scales (bubbles coalescing). (Video and image credit: S. Pirozzoli et al.)
Fediverse Reactions
-

Tracking Meltwater Through Flex
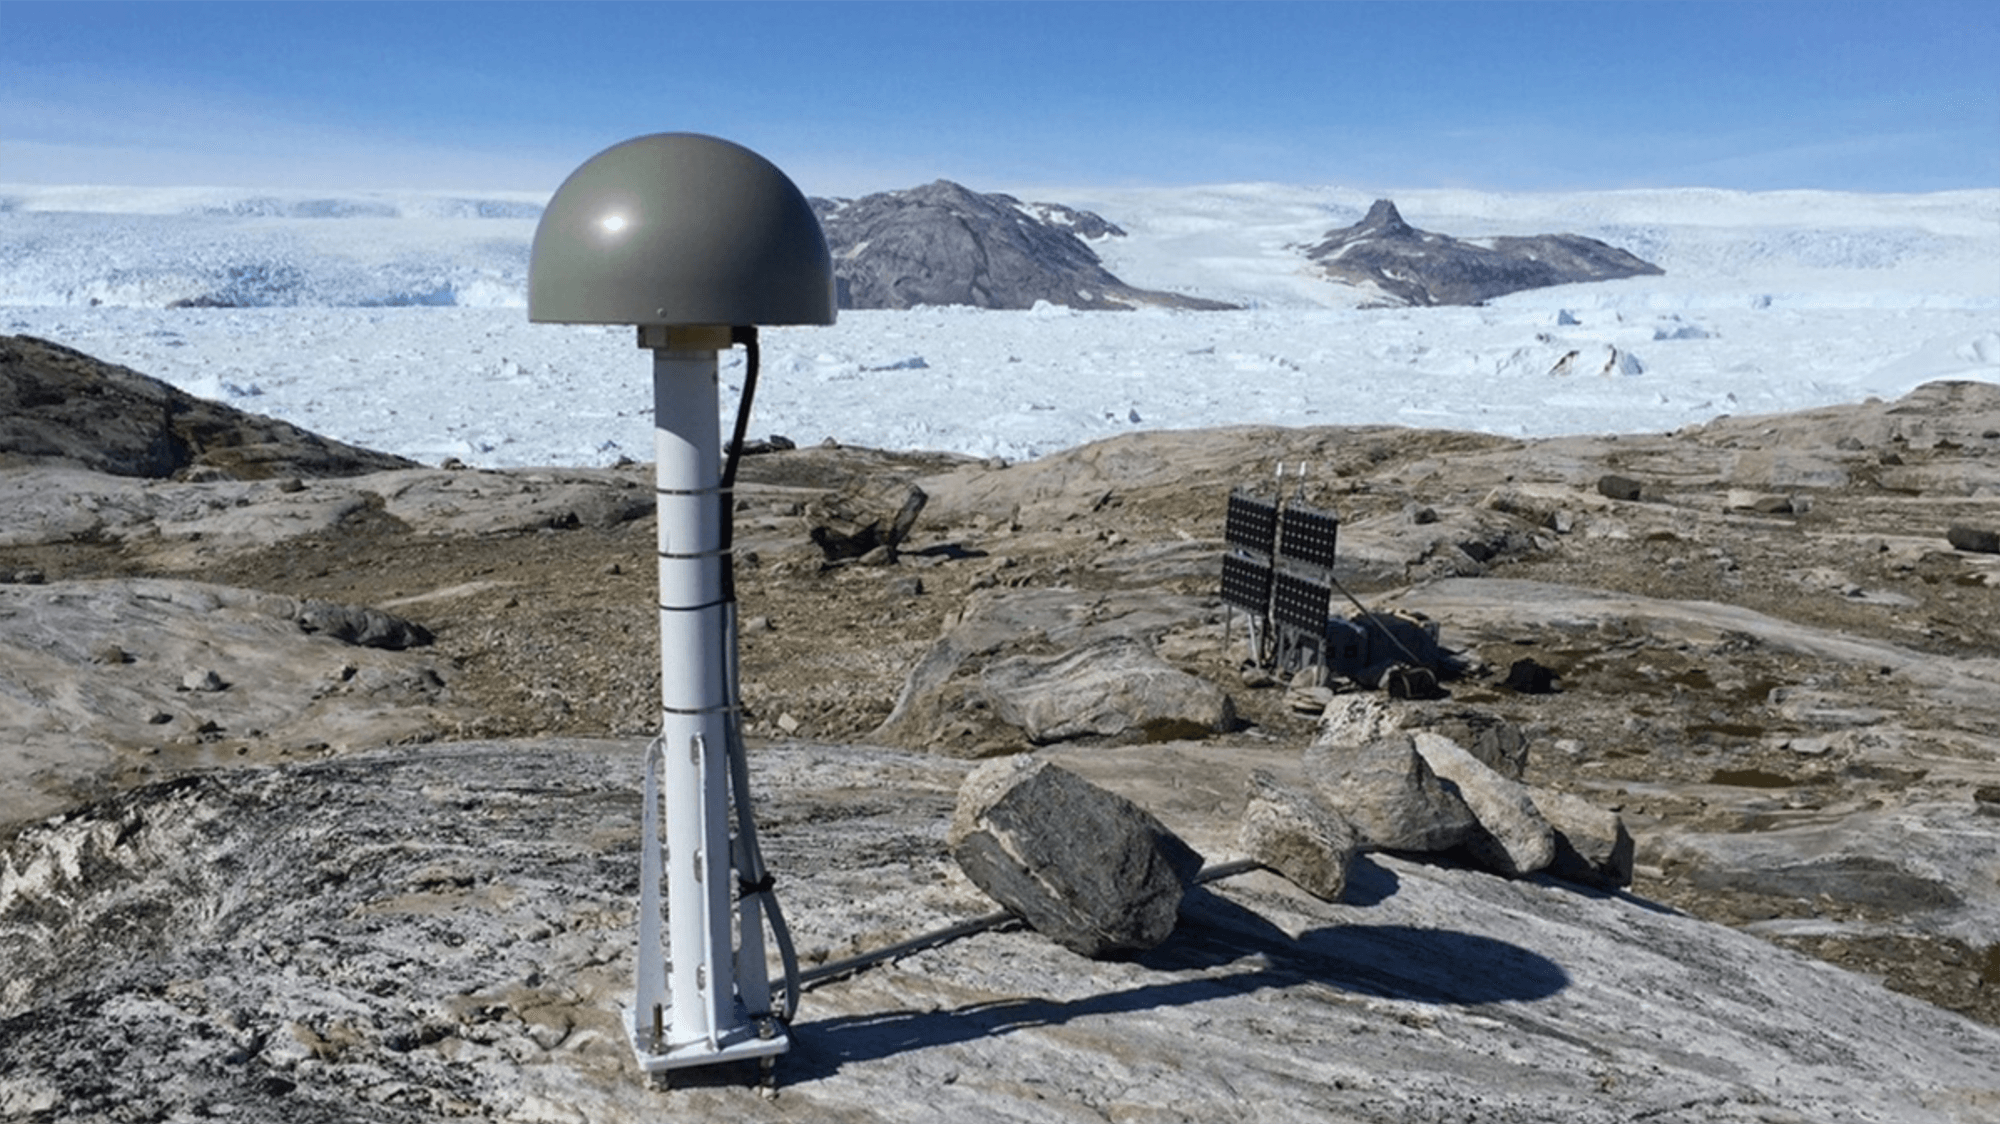
Greenland’s ice sheet holds enough water to raise global sea levels by several meters. Each year meltwater from the sheet percolates through the ice, filling hidden pools and crevasses on its way to draining into the sea. Monitoring this journey directly is virtually impossible; too much goes on deep below the surface and the ice sheet is a precarious place for scientists to operate. So, instead, they’re monitoring the bedrock nearby.
Researchers used a network of Global Navigation Satellite System (GNSS) stations like the one above to track how the ground shifted and flexed as meltwater collected and moved. They found that the bedrock moved as much as 5 millimeters during the height of the summer melt. How quickly the ground relaxed back to its normal state depended on where the water went and how quickly it moved. Their results indicate that the water’s journey is not a short one: meltwater spends months collecting in subterranean pools on its way to the ocean — something that current climate models don’t account for. Overall, the team’s results indicate that there’s much more hidden meltwater than models predict and it spends a few months under the ice on its way to the sea. (Image credit: T. Nylen; research credit: J. Ran et al.; via Eos)
Fediverse Reactions
-

Tracking Ice Floes
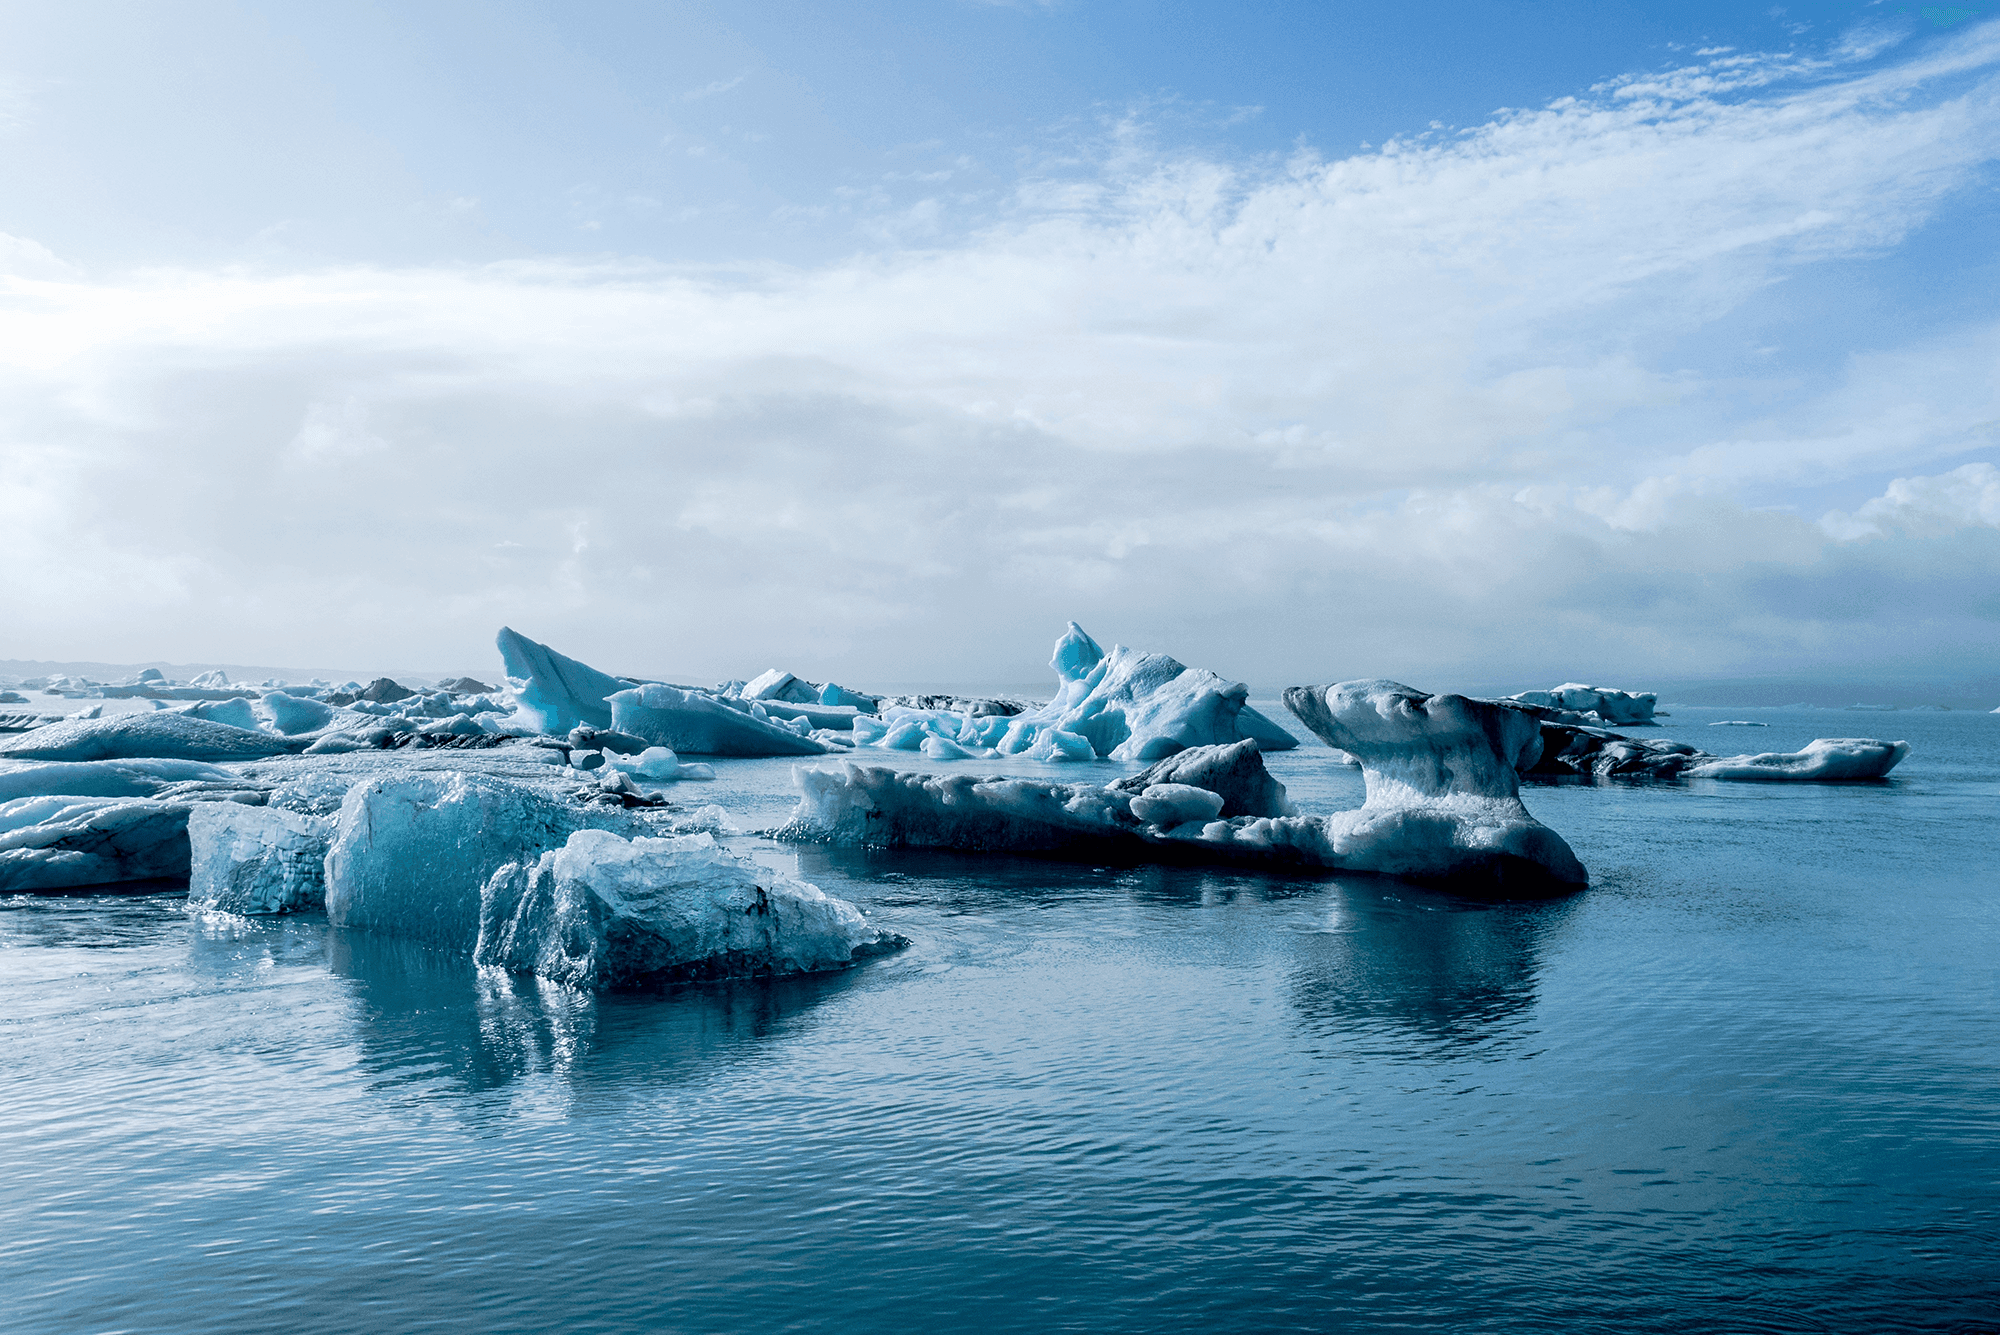
To understand why some sea ice melts and other sea ice survives, researchers tracked millions of floes over decades. This herculean undertaking combined satellite data, weather reports, and buoy data into a database covering nearly 20 years of data. With all of that information, the team could track the changes to specific pieces of ice rather than lumping data into overall averages.
They found that an ice floe’s fate depended strongly on the route it took: ice that slipped from its starting region into warmer, more southern regions was likely to melt. They also saw region-specific effects, like that thick sea ice was more likely to melt in the East Siberian Sea’s summer, possibly due to warmer currents. The comprehensive, fine-grained analyses possible with this ice-tracking technique offer a chance to understand why some Arctic regions are more vulnerable to warming than others. (Image credit: D. Cantelli; research credit: P. Taylor et al.; via Eos)

Slushy Snow Affects Antarctic Ice Melt
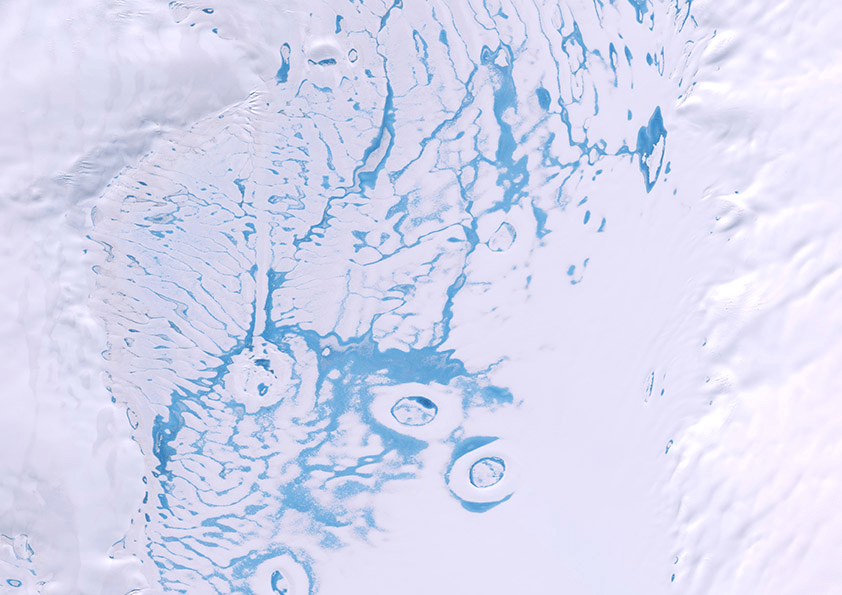
More than a tenth of Antarctica’s ice projects out over the sea; this ice shelf preserves glacial ice that would otherwise fall into the Southern Ocean and raise global sea levels. But austral summers eat away at the ice, leaving meltwater collected in ponds (visible above in bright blue) and in harder-to-spot slush. Researchers taught a machine-learning algorithm to identify slush and ponds in satellite images, then used the algorithm to analyze nine years’ worth of imagery.
The group found that slush makes up about 57% of the overall meltwater. It is also darker than pure snow, absorbing more sunlight and leading to more melting. Many climate models currently neglect slush, and the authors warn that, without it, models will underestimate how much the ice is melting and predict that the ice is more stable than it truly is. (Image credit: Copernicus Sentinel/R. Dell; research credit: R. Dell et al.; via Physics Today)

Measuring Ocean Upwelling
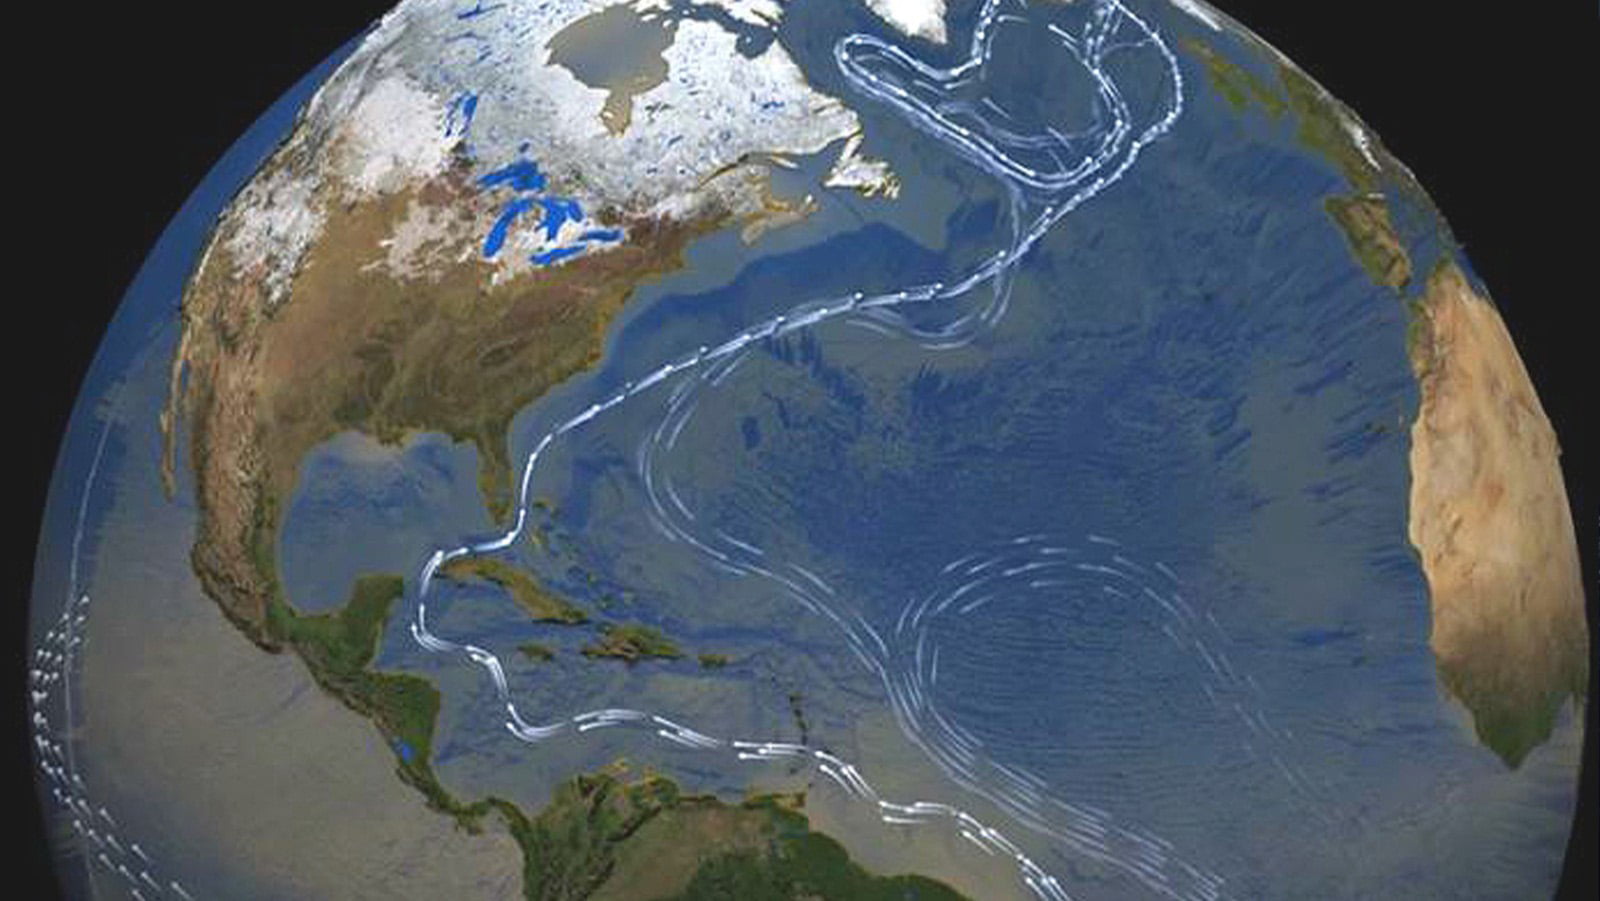
Large-scale ocean circulation is critical to our planet’s health and climate. In this process, seawater near the poles cools and sinks into the deep ocean, carrying dissolved carbon and nutrients with it. Later, that cold water gets pushed back up to the surface elsewhere, where it warms, and the cycle repeats. Although the theory behind this circulation has been around for decades, it’s been difficult to observe the rise, or upwelling, of water from the depths. But a recent study used a fluorescent, non-toxic dye to measure upwelling directly.
Researchers deployed 200 liters of dye just above the floor of a marine canyon near Ireland, then monitored the dye’s movement for several days at a depth of 2200. They found that turbulence along the slope of the canyon drove upwelling at speeds of about 100 meters per day, much faster than global rates. The authors suggest that this kind of topographically-enhanced upwelling could be a major factor in setting overall ocean circulation. (Image credit: visualization – NASA, ship – S. Nguyen; research credit: B. Wynne-Cattanach et al.; via Physics World)

Resolution Effects on Ocean Circulation
The Gulf Stream current carries warm, salty water from the Gulf of Mexico northeastward. In the North Atlantic, this water cools and sinks and drifts southwestward, emerging centuries later in the Southern Ocean. Known as the Atlantic Meridional Overturning Circulation (AMOC), this circulation is critical, among other things, to Europe’s temperate climate. Since 1995, scientists have been warning that human-driven climate change is weakening the AMOC and may cause it to shut down entirely — which would have catastrophic consequences for our society.

Comparison of ocean current speeds in the low-resolution (left) and high-resolution (right) simulations. A recent study re-examined the AMOC using both low- and high-resolution numerical simulations, combined with direct observations. Both simulations covered 1950 – 2100 and found the AMOC’s strength has declined since 1950. But the high-resolution simulation found significant regional variations in the AMOC’s behavior. Some regions saw localized strengthening, while other areas showed abrupt collapse. These sensitive shifts underscore the importance of driving toward higher resolutions in our next-generation climate models, if we want to better understand — and perhaps predict — what lies ahead as our climate changes. (Image credit: illustration – Atlantic Oceanographic and Meteorological Laboratory, simulations – R. Gou et al.; research credit: R. Gou et al.; via APS Physics)

Warming Temperatures Increase Turbulence
After multiple high-profile injuries caused by atmospheric turbulence, you might be wondering whether airplane rides are getting rougher. Unfortunately, the answer is yes, at least for clear-air (i.e., non-storm-related) turbulence in the North Atlantic region. It seems that climate change, as predicted, is increasing the bumpiness of our atmosphere. There are a couple of mechanisms at play here.
The first is that warming temperatures fuel thunderstorms. When ground-level temperatures and water temperatures are warmer, that provides more warm, moist air rising up and feeding atmospheric convection. Especially in the summertime, that translates into stronger, more frequent thunderstorms; even with flights avoiding the storms themselves, there’s greater turbulence surrounding them.
The second mechanism relates to wind, specifically in the mid-latitudes. In general, a temperature difference between two regions causes stronger winds. (Think about the windy conditions that accompany an incoming cold front.) At the mid-latitudes, the difference between cold polar regions and warmer equatorial ones creates a strong wind, known as the jet stream. Now, as temperature gradients increase at cruising altitudes, the jet stream gets stronger, which means bigger changes in wind speed with altitude. And its those wind speed differences at different heights that drive turbulence.
So, yes, we’re likely to see more turbulent flights now and in the future. But, fortunately, there’s a simple way to avoid injuries from that bumpiness: buckle up! If you keep your seat belt fastened while you’re seated, you can avoid getting tossed around by unexpected G-forces. (Image credit: G. Ruballo; see also Gizmodo)

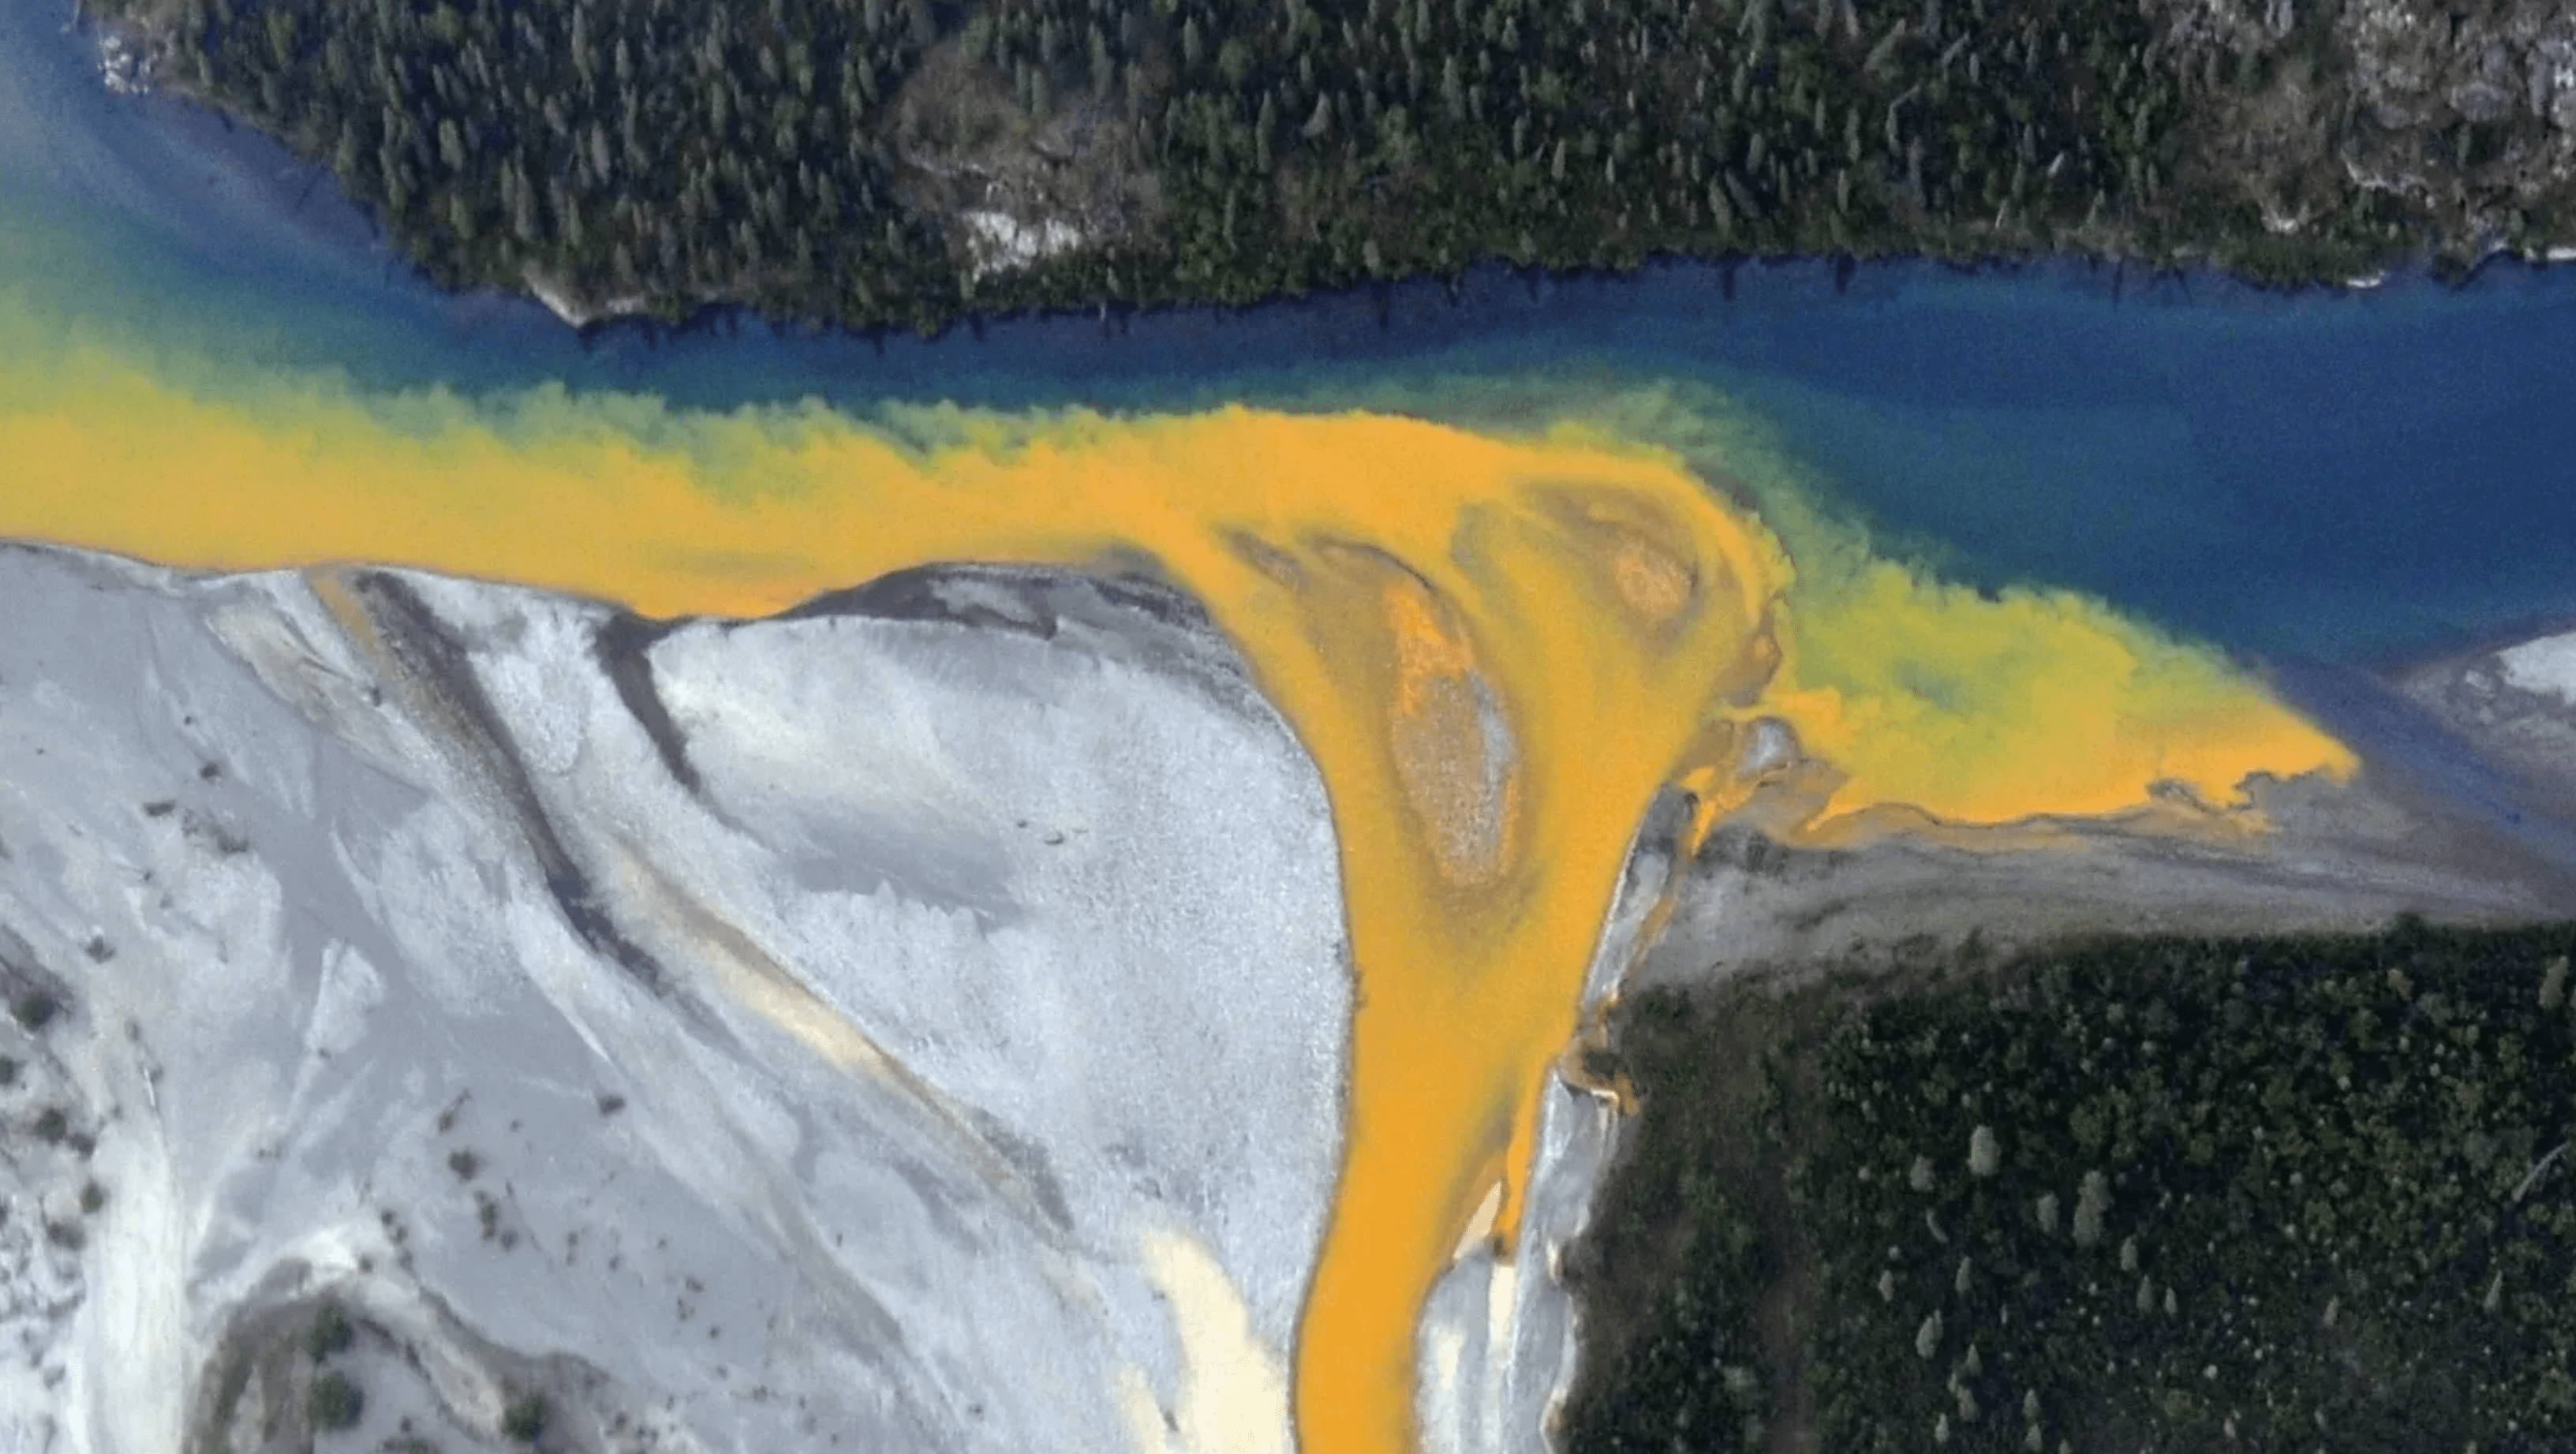
Melting Permafrost Stains Alaskan Rivers Orange
The swiftly melting permafrost of the Arctic is releasing toxic metals like zinc, cadmium, and iron into Alaskan waterways. The contaminant levels are so high that it’s staining many rivers orange — a feature that can be seen from space. A new study identified at least 75 affected rivers in the Brooks mountain range.
In addition to staining the rivers, these metals make the water acidic, with some waterways reaching a pH as low as 2.3, similar to the acidity of vinegar. The combination is deadly to aquatic life in the rivers, and the acidity, unfortunately, will accelerate the dissolution of rocks that can release even more metals into the water. (Image credit: K. Hill/National Park Service; research credit: J. O’Donnell et al.; via LiveScience; submitted by Emily R.)

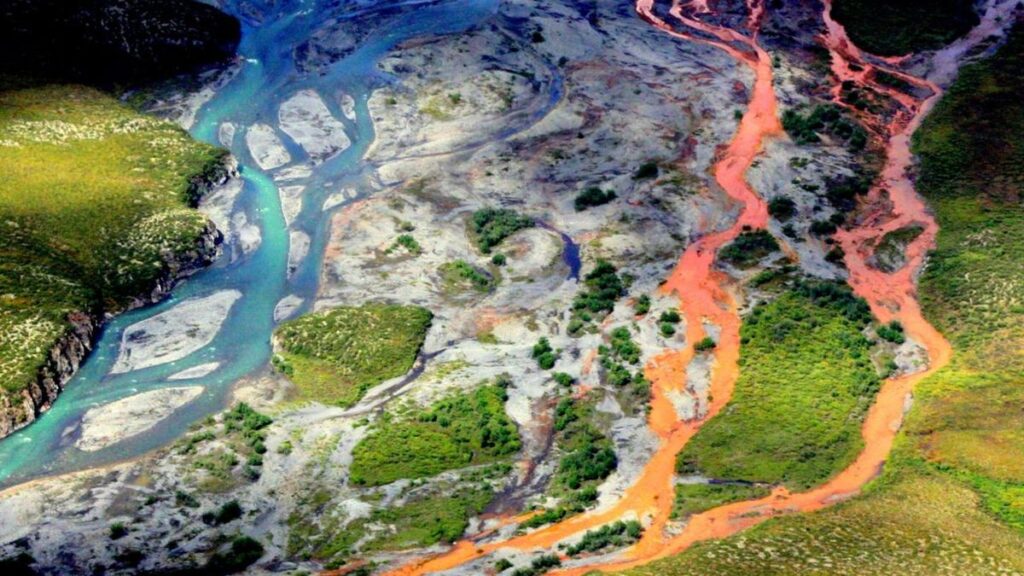
A contaminated portion of the Kutuk River runs orange alongside an uncontaminated portion of the same waterway. 
Extreme Weather and Climate Change
Extreme weather events like floods, hurricanes, atmospheric rivers, heat waves, and droughts are increasingly discussed in terms of the effects of climate change. Because complex systems have complex causes, it’s difficult to draw exact lines of causality between human-made climate change and a given weather event. But scientists have built an array of tools that help address two key questions: 1) how much more extreme was this weather due to climate change, and 2) how much more likely was this extreme event due to climate change?

Comparing (a) the actual flooding from Hurricane Harvey with (b) the estimated flood that would have occurred without climate change. The depth of actual flood waters was about 1m greater due to climate change. To answer the first question, scientists often use hindcasts. In these studies, scientists first build a simulation that mirrors the actual event, like Hurricane Harvey’s stall over Houston, Texas. Once their simulated storm reflects the actual one, they tweak the initial conditions to reflect a world without climate change and see how the storm differs. By comparing the actual and simulated floods (image above), scientists can estimate just how much worse climate change made things. In Harvey’s case, they found that human activity increased the overall precipitation by 19% and that 32% of the flooded homes in Harris county would not have flooded in a world without climate change. Detailed results from that particular study can be explored in the web portal here. (Image credits: Flooded street – J. Gade, Harvey flooding – M. Wehner; research credit: M. Wehner in Physics Today)