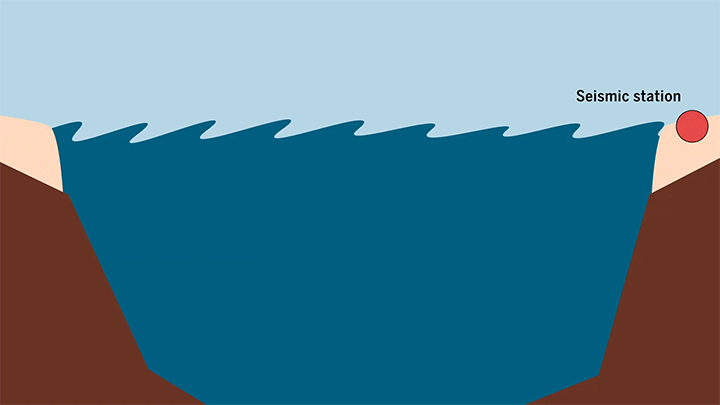
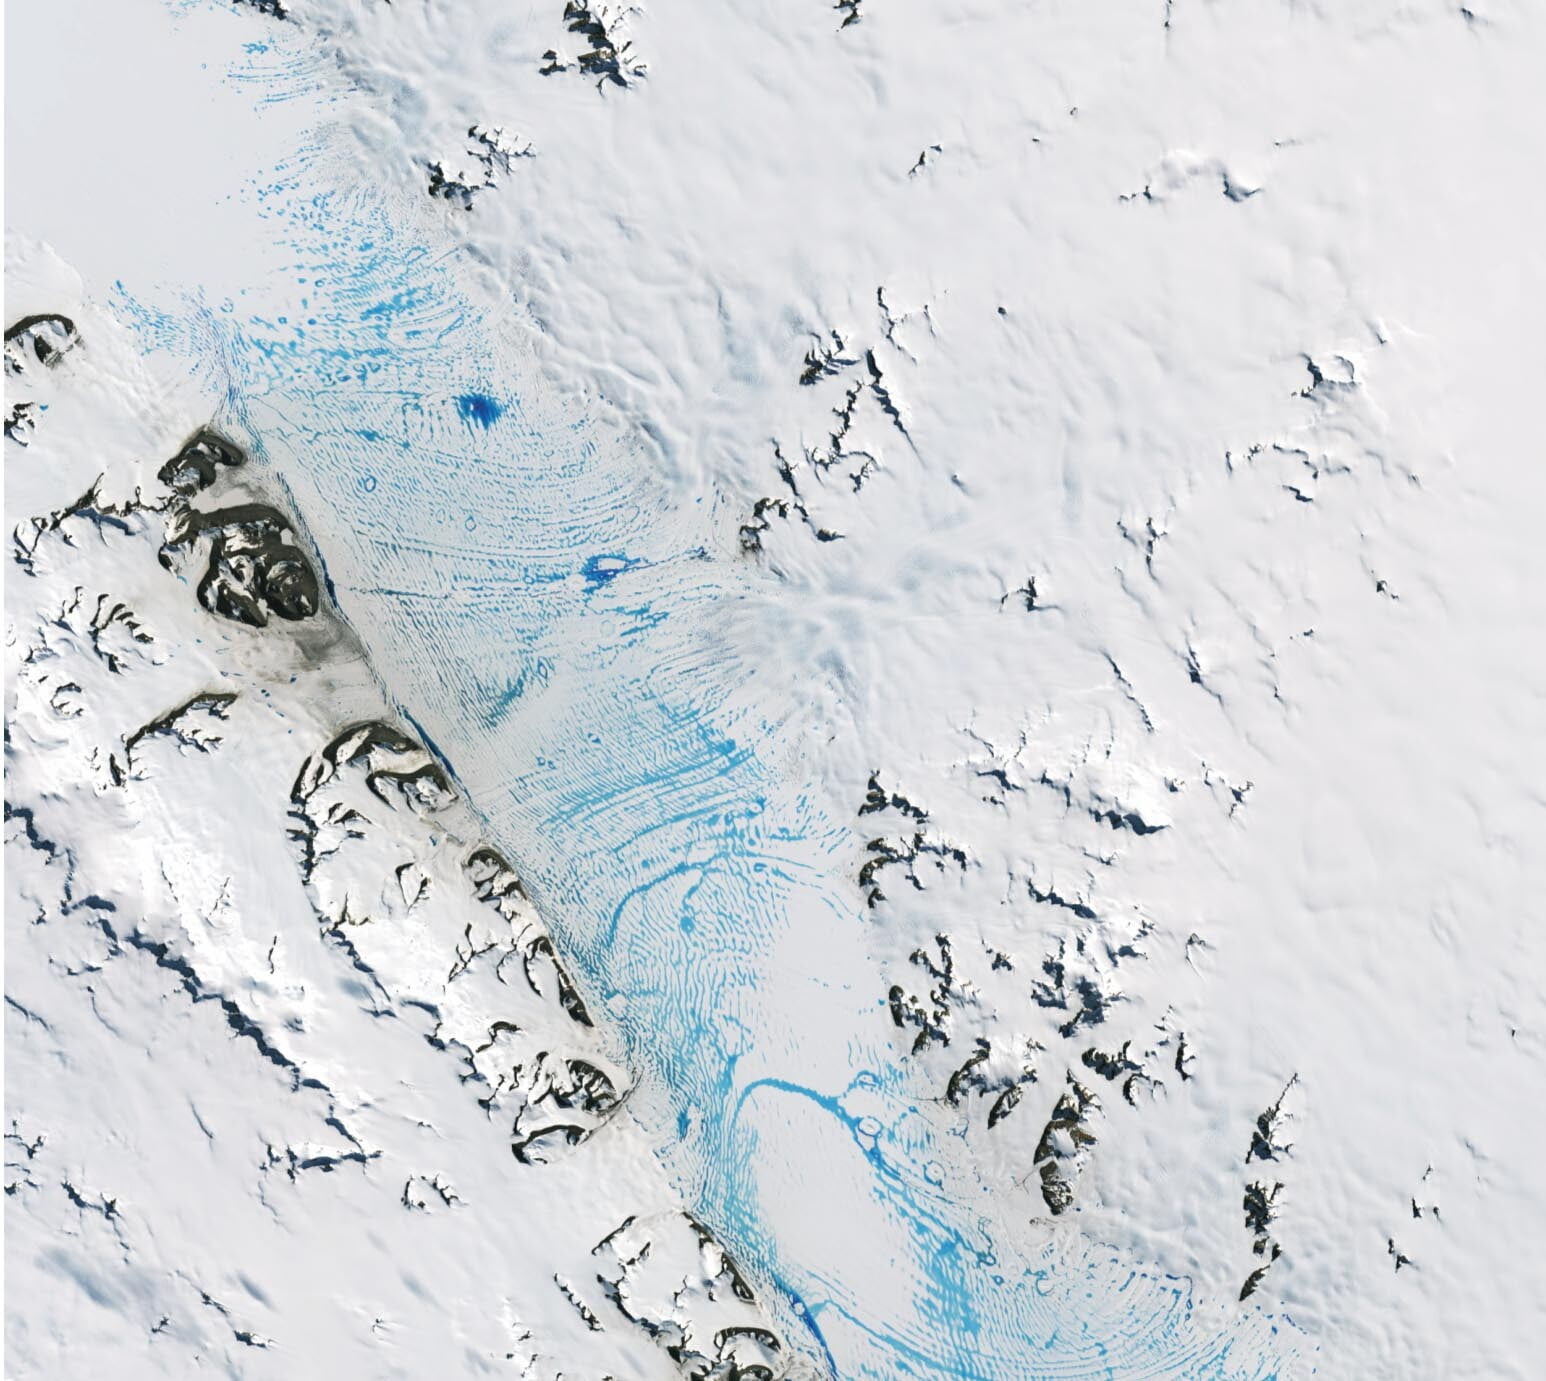
As sea ice disappears in the Arctic Ocean, it leaves behind higher waves on the open water. These large waves help inject sea salt and organic matter into the atmosphere, where they can serve as nucleation sites for ice crystals. A recent field expedition in the Chukchi Sea observed high concentrations of organic particulates in the air and more ice-producing clouds during periods of high wave action. So, oddly enough, the loss of sea ice may lead to more cloud cover and precipitation in the Arctic (though the effect is likely not strong enough to entirely mitigate the effects of ice loss). It’s another example of the intricate and complex connections between ice, ocean, and atmosphere in the Arctic climate. (Image credit: A. Antas-Bergkvist; research credit: J. Inoue et al.; via Gizmodo)
Tag: climate change

Zuiderzee Works
Few countries have to contend with water the way the Netherlands does. With 26% of its area and 21% of its population living below sea level, water control is critical. This satellite image shows some of the natural and manmade features that help protect the landscape. The West Frisian Islands, the long spine-like archipelago seen here, form the first barrier. Behind them lies the mudflats of the Wadden Sea, home to countless wetland species. The Wadden Sea is separated from the freshwater Lake Ijssel by the Afsluitdijk, constructed in 1932 to protect the country from rising seas. With the dam in place, the Dutch used wind power to drain the shallow lands behind the dam, reclaiming the polders labeled here. With the islands, mudflats, and lake between urban settlements and the sea, engineers have more options for diverting water and protecting people from disastrous flooding. (Image credit: A. Holmes/NASA’s Ocean Color Web; via NASA Earth Observatory)

Iceberg Melting Depends on Shape
Not all icebergs melt equally. Through a combination of experiment and numerical simulation, researchers have shown that an iceberg’s shape underwater strongly affects how it melts. Specifically, icebergs in a flow melt more quickly on the front and side surfaces and slower on the underside. This means that narrow icebergs that project deep into the water will melt faster than wider, shallow ones. Currently, climate models don’t account for this variation, but the researchers hope their work will help build more accurate models for future studies. (Image credit: iceberg – C. Matias, experiment – E. Hester et al.; research credit: E. Hester et al.; see also APS Physics)


Meltwater Tracking Via Seal
Monitoring meltwater from Antarctic glaciers is critical for understanding our changing climate, but such remote and inaccessible regions are tough to collect data in. So researchers are turning to local workers to help them gather data. By collecting and analyzing data from seal tags, researchers have mapped new seasonal variations in meltwater flows around Pine Island Glacier. Although the seals are somewhat tough collaborators — they rarely swim exactly where the researchers would like them to — their winter activities are revealing data researchers could never have collected on their own. (Image credit: Y. Rzhemovskiy; research credit: Y. Zheng et al.; via Gizmodo)

Wind Turbine Physics
Over the years, wind turbines have gotten tall with long, thin blades. This MinutePhysics video delves into the reasons for those changes. They’re all aimed at generating more wind power and doing so with greater efficiency.
I’ll add one caveat to the video, though, because you may wonder how modern wind turbines can be fast when they appear to rotate so slowly. That’s a trick of the reference frame. The power a turbine blade generates depends on the flow speed over it, and the relative air speed is greatest near the tip of the turbine blades.
Think of the circle the blade tip traces. For a given rotation rate – say once revolution a minute – the blade tip has a much larger distance to travel than the blade’s base does. Divide that large distance by the rotation time and you get a large velocity. So even though the wind turbine appears to be rotating slowly, the flow the blade sees is quite fast. And the longer the wind turbine’s blades, the larger this effect. (Image and video credit: H. Reich/MinutePhysics)

Acidic Sea Spray
As waves crash and break, they generate a spray of droplets — known as aerosols — that make their way into the atmosphere. Researchers investigated the chemistry of these aerosol droplets by generating spray in a wave tank filled with ocean water. They found that aerosol droplets are far more acidic than the ocean they come from, and the smaller the droplet, the more acidic it is. This acidification happens in a matter of minutes, as acidic gases interact with the spray. Their findings will be critical for accurately modeling the climate connections between our oceans and atmosphere. (Image credit: Elle; research credit: K. Angle et al.; via OceanBites; submitted by Kam-Yung Soh)

Seismic Events Reveal Ocean Temperatures
Decades ago, researchers proposed sending sound waves through the ocean to measure its temperature. Although the technique worked, it ran into noise pollution issues, but now it’s back, using naturally-occurring seismic events as the sound source.
When fault lines shift, they generate seismic waves that travel through the ocean as sound. When they reach a land mass, the waves get converted back into seismic energy that’s then picked up by a receiver. Knowing the distance from the source to the receiver and the time necessary for the wave to travel, scientists can then determine the average temperature of the water based on the speed of sound.
The technique can track temperature changes down to thousandths of a degree. Based on more than a decade of seismic data from the Indian Ocean, researchers found almost double the temperature increase measured by a different sensor network. (Image and video credit: Science; research credit: W. Wu et al.; submitted by Kam-Yung Soh)

Recession at Taku Glacier
A glacier’s snowline marks the location where the amount of summer melting and accumulated snowmass are equal. If, over the course of a season, a glacier experiences more snowfall than melting, its snowline will advance. If melting outweighs accumulation, then the snowline will retreat to higher altitudes. Tracking the snowline gives scientists important data about how the glacier is changing.
And that change is typically slow. When glaciers stop advancing, their snowlines can remain unmoving for decades. Or, at least, they used to. In recent years, Alaska’s Taku Glacier was one of the only alpine glaciers holding out against the warming Arctic. Its slow advance stopped in 2013–the left image shows Taku in 2014–and researchers hoped the massive glacier would maintain its mass for a few decades at least. Instead, the glacier was retreating by 2018 and doing so with the highest mass loss ever recorded at the glacier. The 2019 image on the right shows the glacier’s visible losses.
For such a massive glacier–the largest in Juneau Icefield at nearly 1.5 km thick–to reverse fortunes so quickly is disturbing and serves as yet more evidence of climate change overriding natural cycles of advance and retreat. (Image credit: L. Dauphin/USGS; via NASA Earth Observatory)

Preventing Flooding
The Dutch have been exceptional water engineers for centuries, a necessity in a country where more than a quarter of its territory lies below sea level. After a devastating flood in the early 1950s, the country embarked on a decades’ long endeavor to build the massive Delta Works that now protect a large portion of the population from oceanic storm surges that would otherwise flood the countryside.
As part of their efforts to instill resiliency both along the coast and upstream, the Netherlands has shifted dykes, created floodplain habitats, and built water storage into new buildings. With communities around the world at greater flood risk than ever as our climate changes, the Netherlands serves as a shining example of what’s possible with proper planning and investment. (Video and image credit: TED-Ed)

Siberia’s Rivers
Each winter the Kolyma River in Siberia freezes to a depth of several meters. But by June the river thaws and discharges its annual 136 cubic kilometers of water into the Arctic. The dark color of the river comes from the sediment and organic material it carries. The Kolyma is the world’s largest river underlain with continuous permafrost. Parts of the river system’s permafrost date back to the Pleistocene more than 12,000 years ago. Since much of its organic matter comes from its permafrost, researchers expect the amount of organic material in the Kolyma’s discharge to increase as the permafrost degrades in our warming climate. (Image credit: NASA Earth Observatory)


