
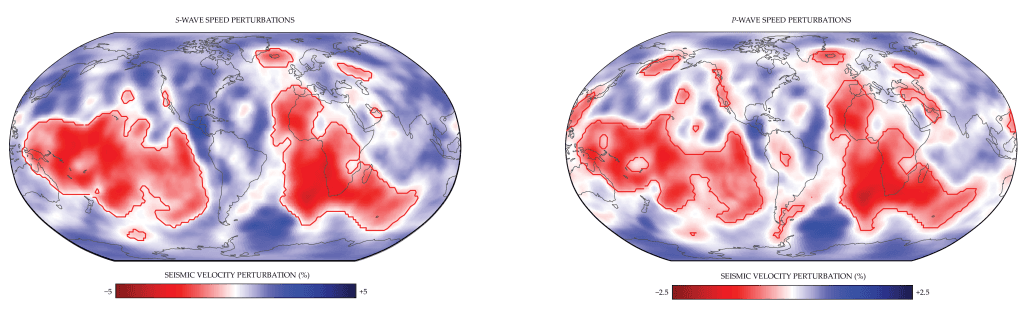
Most of what we know about Earth’s interior comes from observing how seismic waves–mostly from earthquakes–bounce around. As our observations have gotten better–more seisometers, better imaging techniques–scientists have identified two large anomalies sitting near the bottom of the mantle. Known as large low-velocity provinces, or LLVPs, these zones take up continent-sized areas beneath parts of Africa and the Pacific.
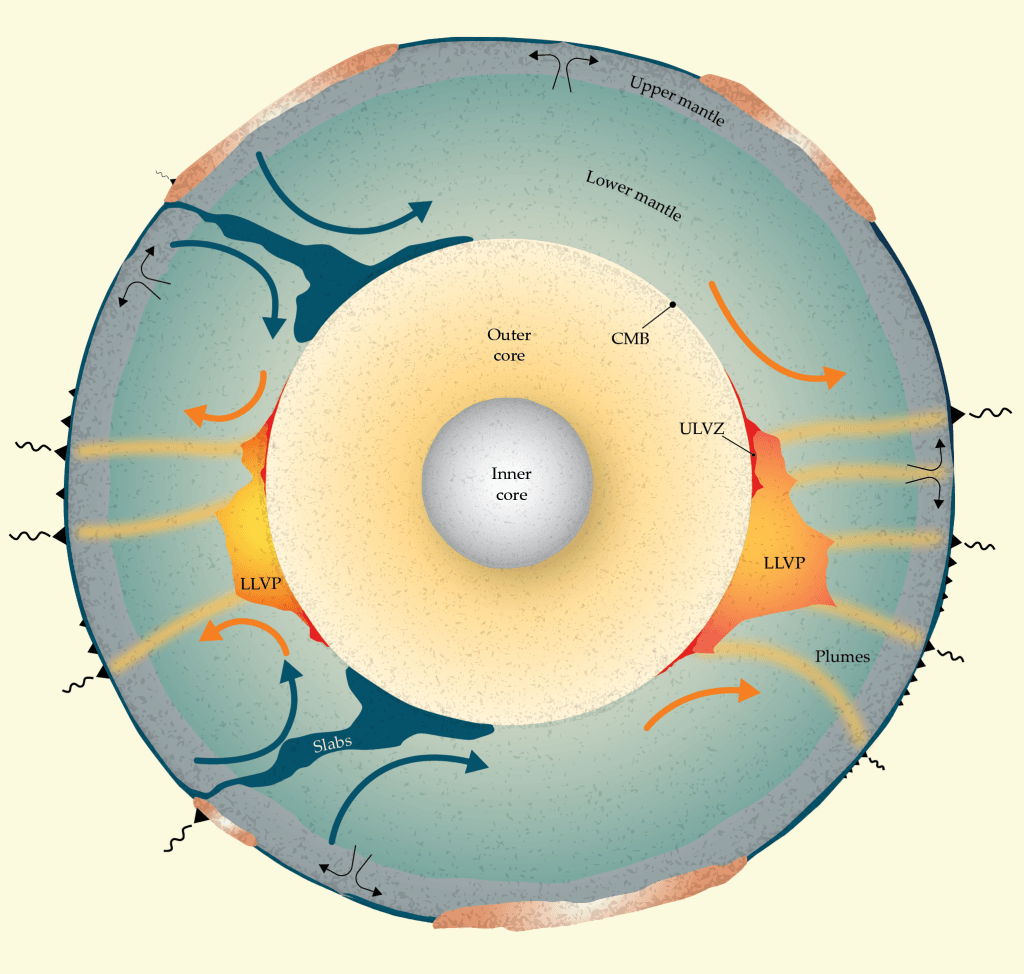
The LLVPs are hot, which would normally make them buoyant, but their stationary nature suggests they are made up of extremely dense material. Narrow plumes of hot material make their way up from the LLVPs to form volcanic hotspots like those that made the Hawaiian and Galapagos Islands. Balancing that upward convection is the downward convection of former tectonic material carried into the mantle at subduction zones.
What the LLVPs are made of remains an active research question. One suggestion is that they contain remnants of Theia, the planet thought to have impacted the proto-Earth to form our Moon. (Image credits: E. Garnero and C. Richardson; see also Physics Today)

 along the oxygen gradient.\"")
 emerge\"")


")

