Search results for: “aerodynamics”

  • Featured Video Play Icon

    The Tacoma Narrows Bridge

    One of the most dramatic and famous engineering failures of the twentieth century is also one of the most complicated: the collapse of the Tacoma Narrows Bridge. This early suspension bridge earned the name “Galloping Gurtie” from construction workers while it was still being built because its flexibility made it prone to moving up and down under even relatively light winds. That vertical motion was due to vortex-induced vibration. As the wind blew, it shed vortices off the downstream side of the bridge. These vortices alternated, coming off the top and then bottom of the bridge deck. The resulting forces made the bridge shift up and down.

    That wasn’t the bridge’s ultimate downfall, though. Shortly before it collapsed, the bridge stopped flexing up and down and instead twisted back and forth. This was a clear sign that the bridge had moved into aeroelastic flutter. In this situation, you get a feedback loop between the bridge’s aerodynamics and its structural dynamics. When the wind twists the bridge deck to a positive angle of attack, it will try to continue forcing the bridge to twist that direction. The internal forces of the bridge will try to twist it back, but when that happens, it can overshoot and end up at a negative angle of attack. At that point, the wind tries to push it further that direction and internal forces twist it back, overshooting the other way. This back-and-forth can create a dangerous feedback loop where the twisting of the bridge keeps getting worse and worse. In fact, that’s exactly what happened – right up until the bridge collapsed rather than twisting any more. (Video and image credit: Practical Engineering)

  • The Telstar 18

    The Telstar 18

    Every four years, Adidas creates a newly designed ball for the World Cup. This year’s version is the Telstar 18, which features six glued panels (no stitching!) with a slightly raised texture. That subtle roughness is an important feature for the ball’s aerodynamics. It helps ensure that flow around the ball will become turbulent at relatively low speeds. Some previous designs, notably the 2010 Jabulani, were so smooth that flow near the ball would not become turbulent until much higher speeds. In fact, one side of the ball might have laminar flow while the other was turbulent, causing the ball to wobble and misbehave. To learn more about World Cup aerodynamics and the importance of a little surface roughness to the ball’s behavior, check out the Physics Girl video below.    (Image credit: Adidas; via APS News; video credit: Physics Girl)

  • PyeongChang 2018: Bobsleigh

    PyeongChang 2018: Bobsleigh

    In bobsleigh, two- and four-person teams compete across four runs down an ice track. The shortest cumulative time wins, and since typical runs are separated by hundredths of a second, teams look for any advantage that helps them shave time. The size, weight, and components of a sled are restricted by federation rules; for example, teams cannot use vortex generators to improve their aerodynamics. Instead bobsledders work with companies like BMW, McLaren, and Ferrari to engineer their sleds. Both computational fluid dynamics and wind tunnel tests with the actual team in the sled are used to make each sled as aerodynamic as possible. (Image credit: IOC, Gillette World Sports, source)

  • Gliding Lizards

    Gliding Lizards

    Flying lizards are truly gliders, but that doesn’t mean they’re unsophisticated. Newly reported observations of the species in the wild show that flying lizards don’t simply hold their forelimbs out a la Superman. Instead, they reach back with their forelimbs, pressing their arms into the underside of the thin patagium that serves as their flight surface while rotating their hands to grasp the upper side of the patagium. This forms a composite wing with a thicker leading edge and seems to be how the lizards control their glide. Close observation of their flight shows that, while holding their patagium, the lizards actively arch their backs to camber their composite wing. This can increase their maximum lift coefficient, allowing them to glide longer distances. (Image and research credit: J. Dehling, source)

  • Galapagos Week: Sea Turtles

    Galapagos Week: Sea Turtles

    It’s easy to imagine sea turtles as slow and awkward given our familiarity with their terrestrial cousins, tortoises, but this could hardly be further from the truth. There are currently seven living species of sea turtles and all use a mode of locomotion known as aquatic flight. As the name suggests, swimming sea turtles share a lot in common with birds and other fliers. They generate most of their propulsion by flapping their forelimbs. Like birds, they change the angle of attack of their flippers over the course of both their upstroke and downstroke. 

    Of course, a cruising sea turtle is more interested in thrust than lift, but the efficiency of flapping is far higher than that of a rowing motion. That holds true across a range of speeds and is probably why marine turtles, known for their vast migrations, predominantly use flapping. It’s also remarkable how fast they can move when they want to. The animations above show two species of sea turtles cruising casually at a speed where a snorkeler in fins could follow along. But when the turtles wanted to, they could take off at a clip no human could hope to match! (Image credit: N. Sharp; research credit: J. Davenport et al., J. Walker and M. Westneat, H. Prange, E. Dougherty et al.)

    Today’s post wraps up Galapagos Week here at FYFD, but there’s plenty more Galapagos-relevant fluid dynamics to go around. Here are some previous, related posts: how frigatebirds cruise the seas without getting wet;  aerodynamics of flying fish; hydrodynamics of humpback whales; incredible bioluminescent plankton; and leaping mobula rays

  • Reader Question: Drafting in Time Trials

    Reader Question: Drafting in Time Trials

    In a comment on this recent post regarding drafting advantages to a leader, reader fey-ruz asks:

    in cycling, team follow cars are required to maintain a minimum distance from their riders during time trials for this very reason (although i imagine the effects in that context are much smaller and dependent on the conditions, esp the wind speed, direction, and strength). FYFD, is there a simple way to understand where this upstream influence comes from? or a specific term in the navier-stokes equations that it results from?

    Cars following riders during a time trial can actually make a huge difference! One study from a couple of years ago estimated that a car following a rider in a short (13.8 km) time trial could take 6 seconds off the rider’s time. The images up top show a simulation from that study with a car following at 5 meters versus 10 meters. The colors indicate the pressure field around the car and rider. Red is high pressure, blue is low pressure. Both the car and the rider have high pressure in front of them; you can think of this as a result of them pushing the air in front of them.

    A large part of the rider’s drag comes from the difference in pressure ahead and behind them. (For a look at flow around a cyclist that focuses on velocity instead, check out my video on cycling aerodynamics.) When a car drives close behind a cyclist, it’s essentially pushing air ahead of it and into the cyclist’s wake. This actually reduces the difference in pressure between the cyclist’s front and back sides, thereby reducing his drag. Because cars are large, they have an oversized effect in this regard, but having a motorbike or another rider nearby also helps the lead cyclist aerodynamically.

    As for the Navier-Stokes equation – this effect isn’t one that you can really pin down to a single term since it’s a consequence of the flow overall. (Image credits: TU Eindhoven; K. Ramon)

  • Cycling Skinsuits and Vortex Generators

    Cycling Skinsuits and Vortex Generators

    It didn’t take long for an aerodynamic controversy to crop up in this year’s Tour de France. At the 14km individual time trial, riders from Team Sky wore custom Castelli skinsuits with integrated dot-like patterns on their upper arms (shown above). By the next day, a sports scientist with a competing team cried foul play, claiming that these fabrics could have given Team Sky as much as 25 seconds’ advantage over other riders. The Sky team finished with 4 out of the top 10 places on the time trial, and their leader, three-time Tour winner Chris Froome, finished some 35 seconds ahead of his expected competitors for the yellow jersey.

    Vortex generators explained

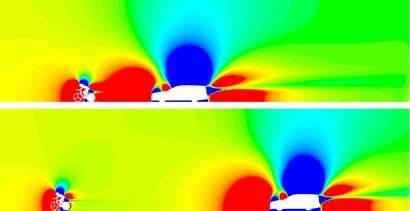
    So how could a few dots make a measurable difference? These protrusions are vortex generators meant to modify flow around a cyclist. Humans are not aerodynamic and what typically happens when air flows over a cyclist’s arms is shown in the flow visualization above: the air follows the curve of the arm part way, then it separates from the body, leaving a region of recirculation that increases drag. Vortex generators can help prevent or delay that drag-inducing flow separation by adding extra energy and turbulence to the air near the arm’s surface. Because turbulent boundary layers can follow a curve longer before separating, this helps reduce the drag by reducing the recirculation zone.

    About that time savings

    Aerodynamically speaking, those vortex generators can make a difference, but the question is, how much? In his complaint, Grappe cites a 2016 paper by L. Brownlie et al. that wind-tunnel tested different vortex generator patterns for use in running apparel. The speeds tested included those relevant to cycling. The specific numbers Grappe quotes aren’t directly relevant, however:

    As noted above, race garments that contain VG provide reductions in Fd of between 3.7 and 6.8% compared to equivalent
    advanced race apparel developed for the 2012 London Olympics which in turn provided substantially lower drag than
    conventional race apparel.

    the effectiveness of 5, 10 and 15 cm wide strips of VG applied to each flank of a sleeveless singlet revealed that the 5 cm wide
    strips provided between 3.1 and 7.1% less Fd than the 10 cm wide strips and between 1.9 and 4.3% less Fd than the 15 cm wide
    strips.  

    Here Brownlie et al. are specifically describing the savings for running apparel, which uses vortex generators in very different places than you would on a cyclist. Note the second quote even refers to a sleeveless singlet, so the vortex generators measured are definitely not in the same place as these skinsuits!

    The bottom line

    I fully expect that vortex generators give a marginal aerodynamic edge, which is why Sky and other teams have already been using them in competition. But I hesitate to declare that the savings is as high as 5-7%, and I have no way to verify Grappe’s subsequent claims that this translates to 18-25 seconds in the time trial. Those are numbers he gives without citing what model is being used to translate drag gains into time.

    In the end, what is needed is clarification of the rules. As they stand, one rule seems to allow the skinsuits because the vortex generators are integrated into the fabric, whereas another states clothing is forbidden “to influence the performances of a rider such as reducing air resistance”. Those two stances seems contradictory, and, for now, the race officials’ verdict to allow the suits stands.

    If you want to learn more about aerodynamics and cycling, be sure to check out my latest FYFD video. (Image credits: B. Tessier/Reuters; Getty Images; L. Brownlie et al. 2009; h/t to W. Küper)

  • Mosquito Flight

    Mosquito Flight

    Mosquitoes are unusual fliers. Their wings are long and skinny, and they beat at around 700 strokes a second – incredibly quickly for their size. Examining how they move has uncovered some interesting mechanics. Despite their short stroke length, the mosquito generates a lot of lift on both its upstroke (when the wing is moving backward) and its downstroke (when the wing moves forward). Some features of the mosquito’s flight are highlighted in the images above. In the animation, blue indicates areas of low pressure and red indicates high pressure.

    Like most flapping fliers, the mosquito generates a leading-edge vortex during its downstroke (and its upstroke). This vortex helps concentrate low pressure on the upward-facing wing surface, thereby creating lift. One of the things that makes the mosquito unique, however, is that it also creates trailing-edge vortices on both half-strokes. To do this, the mosquito rotates its wings precisely to catch the wake of its previous half-stroke. The flow gets trapped near the trailing edge of the wing and forms a vortex and low-pressure region. Like the leading-edge vortex, this low-pressure area on the upward-facing wing surface creates lift. For more secrets of mosquito flight, check out this video from Science or the original paper. (Image credit: R. Bomphrey et al., source)

  • Inside Singing

    Inside Singing

    These are the vocal folds of a woman singing. Human speech (and song) results from interactions between elastic muscles and aerodynamics. As we exhale, the vocal folds are initially pushed apart, then the flow of air moving past creates low pressure (via the Bernoulli effect) that helps pull the folds together. As the folds close, high pressure again forms to force them open. This sets a cycle of oscillation or vibration that produces sound. To change the pitch of the sounds we create, we can lengthen or shorten the vocal folds or change their tension. In this respect, they behave somewhat similarly to the strings of a musical instrument. If you’d like to admire more vocal folds in action, check out this endoscopic video for four singers performing together. (Image credit: LinguaHealth, source)

  • Rio 2016: Long Jump

    Rio 2016: Long Jump

    Long jump, like many track and field events, is affected by fluid dynamics in subtle ways. Both wind speed and altitude can modify a jumper’s performance – first, by changing the maximum speed they reach in their sprint, and second, through aerodynamic drag while in flight. Air resistance accounts for roughly 10% of a sprinter’s energy expenditure. A slight tailwind gives an athlete a minor boost in speed that can translate into a more significant increase in jump distance. On the other hand, though, a headwind of the same magnitude has an even stronger negative effect on performance.

    The other factor, altitude, comes into play through air density. The official Olympic record for the long jump was set by Bob Beamon in the 1968 Mexico City Games. The high altitude of Mexico City results in an air density that’s only 75% of that at sea level. That’s tougher on athletes in terms of oxygen levels, but it’s a big reduction in the overall drag they face, resulting in both a higher sprinting speed and less aerial drag. This is part of why Beamon’s jump stood as a world record for well over 20 years! (Image credits: AP Photo; AFP/GettyImages; Reuters)

    Previously: Can dimpled shoes help runners?; the unusual aerodynamics of the javelinthe physics of the discus

    Join us throughout the Rio Olympics for more fluid dynamics in sports. If you love FYFD, please help support the site!