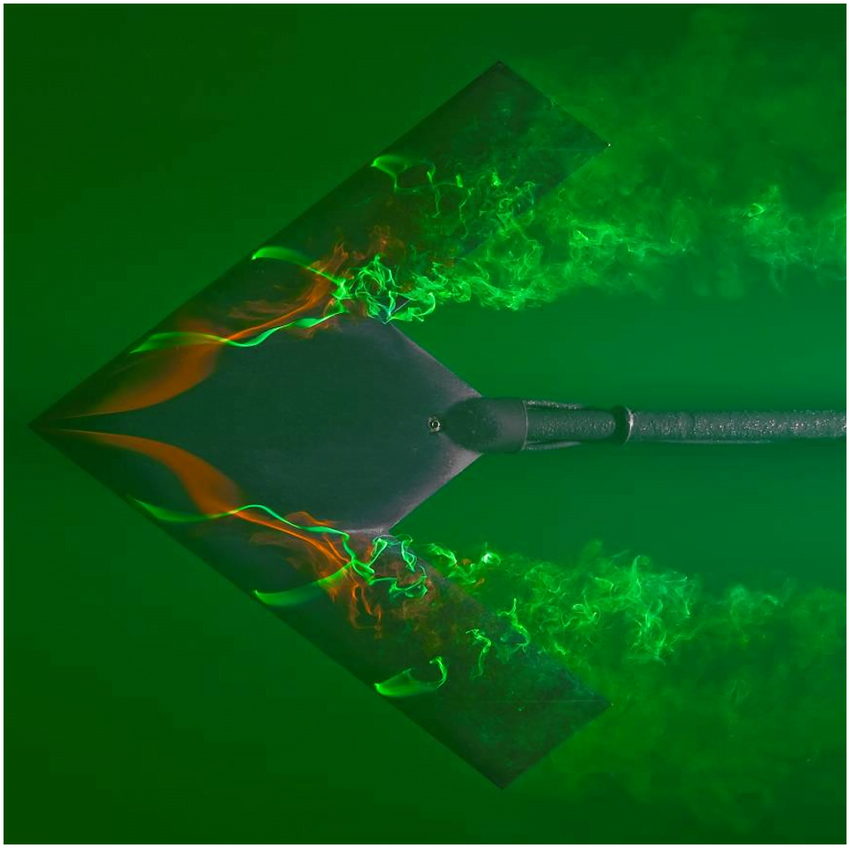
Designing new aerodynamic vehicles typically requires a combination of multiple experimental and numerical techniques. The photo above shows a model for an unmanned flying wing-type vehicle. Here it’s tested in a water tunnel with dye introduced to the flow to highlight different areas. The model is at a high angle of attack (18 degrees) relative to the oncoming flow. This puts it in danger of flow separation and stall, the point where a wing experiences a drastic loss in lift. The smooth flow over the front of the model indicates it hasn’t reached this point yet, but notice how both the green and red dyes are separating from the model and becoming very turbulent over the back of the wing. If the model were pushed to an even higher angle of attack, that separation point would move further forward, bringing stall that much closer. (Image credit: L. Erm and J. Drobik; research credit: R. Cummings and A. Schütte)
Category: Research

Growing Fingers
Branching, tree-like structures are found throughout nature. Take a thin layer of a viscous fluid pressed between two glass plates and inject a less viscous fluid like air and you’ll get branch-like structures. These are the result of the Saffman-Taylor instability and usually result in a fairly random outcome because of the instability’s sensitivity to small variations. In a new study, researchers use multiple air injection ports to finely control the formation and growth of air fingers, allowing them to build well-ordered branching structures like the one above. By placing the air ports in an array, the same technique can be used to create fluid meshes. The authors suggest this new technique could have wide-ranging applications including the design of heat exchangers and the growth of artificial tissues. (Image and research credit: T. ul Islam and P. Gandhi, source)

Rolling Along
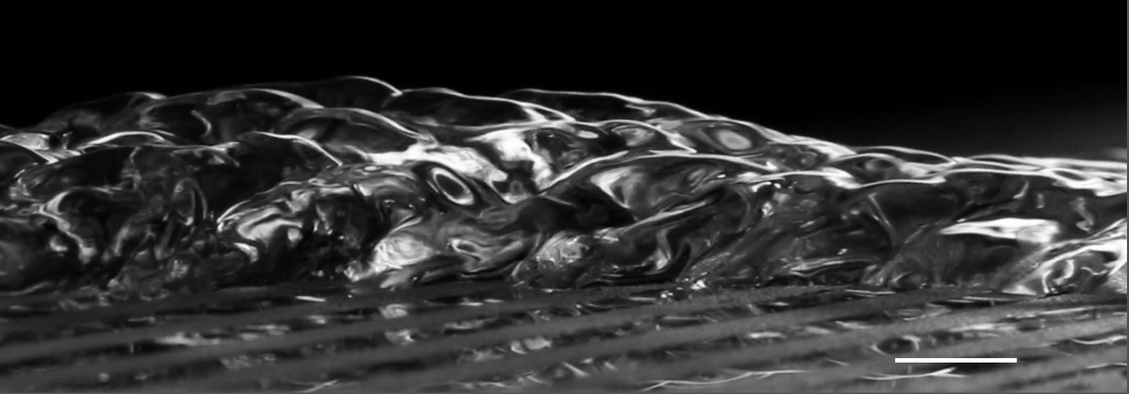
Leidenfrost drops – droplets deposited onto a surface much hotter than their boiling point – are known for their mobility. With the right surface, they can be propelled, trapped, and even guided through a maze, typically by directing the vapor layer that cushions them. But new work shows that these drops have internal dynamics that also contribute to their propulsion.
By adding tracer particles to each droplet, researchers can visualize flows inside the droplet. Large drops tend to have a flatter shape and contain two or more rotating vortices. Such drops won’t propel themselves without another force in play. But smaller droplets are more spherical and contain only a single rotating flow. Once these drops detach, they roll away! Despite the similarity to wheels, these liquid drops aren’t moving the same way. Remember that the drop is not actually in contact with the surface. To see what sets the drop’s direction, researchers examined the shape of the bottom of the drop. They found that it sits at a slant on its vapor cushion. That pushes evaporating gases out one side, propelling the drop the other way. (Image and video credit: A. Bouillant et al., source)

Twisting to Pack
One conventional method for packing granular materials is to tap them repeatedly, but a new study suggests that twisting is a faster method. Researchers poured thousands of dice into a cylinder, then twisted the container back and forth. When the acceleration caused by the change in direction exceeded a threshold value, the dice worked their way into ordered layers of concentric rings over ~10,000 cycles. Reaching this maximum packing density through tapping requires a specially designed method where the tapping characteristics change over time. With twisting, shear forces transmitted from the walls of the container tend to align the flat surfaces of the dice, providing an efficient method of ordering if the acceleration is large enough. The researchers hope methods like this may be useful where tapping works poorly, such as in microgravity. (Image and research credit: K. Asencio et al.; via APS Physics; submitted by Kam-Yung Soh)

Layered Latte Physics


Latte lovers may be familiar with the layered latte, a beverage with distinctive horizontal layers mixing espresso and milk, but you may not have taken the time to wonder how these layers form. Like many layering phenomena in our oceans, the layered latte is the result of double-diffusive convection. This means that there are two variables that both affect density in the fluid mixture and that they act at different rates.
In the latte, those factors are 1) the different densities of the milk and espresso and 2) density changes caused as the latte cools to room temperature. A layered latte forms when the lighter espresso is poured into denser milk. If it’s poured quickly enough, the momentum of the pour forces some of the espresso down into the milk, despite the buoyant force that tries to keep the espresso on top. So that initial pour sets up a density gradient that runs from pure espresso at the top to pure milk on the bottom, with varying mixtures of the two in between.
The distinct layers won’t form until the latte begins cooling off. Along the walls of the container, heat is lost more quickly, causing fluid to cool and start sinking. But a specific bit of fluid can only sink until the fluid surrounding it is the same density. That can carry a cooler bit of latte to the bottom of a layer, but not into the denser layer below. At this point, our bit of latte moves inward, starts to warm up, and circulates up through the center of its layer. As when it sank, the fluid can only move up until it encounters a layer with equal or lesser density, at which point it must move horizontally instead. This thermal convection, combined with the density gradient formed by the initial pour, sets up the distinctive layers of the latte. The layers are quite stable – neither gentle stirring nor taking a sip will disrupt them for long – provided the drink remains warmer than the surrounding air. (Image credits: kopeattugu/Instagram, N. Xue et al.; research credit: N. Xue et al.; via NYTimes; submitted by Kam-Yung Soh)

Corrugating Water
The characteristics of a surface can have a major impact on the form a flow takes. The photo above shows a corrugated, almost pinecone-like water surface. It’s the result of a sheet of water flowing over a surface with alternating bands of hydrophobic (water-repelling) and hydrophilic (water-loving) properties. The water sheet narrows over hydrophobic sections and expands over hydrophilic ones. Gravity, inertia, and surface tension compete to create the overall braided appearance. You can see a top-down view of the flow in the original poster. (Image credit: M. Grivel et al., source)

Water Music of Vanuatu
In the Pacific Island nation of Vanuatu, women have a tradition of water music, accompanying their singing with a percussive use of water. This video explores the physics behind this music. Performers use three basic motions – a slap, a plunge, and a plow – that each have distinctive acoustics thanks to the interaction of hand, water, and air. High pitches come from the initial impact on the water, whereas lower pitches come mostly from the collapse of the air cavity in the hand’s wake. By altering the rhythms and patterns of these three building blocks, the musicians create a rich harmony to accompany their singing. (Video credit: R. Hurd et al.)

Staying Dry Underwater
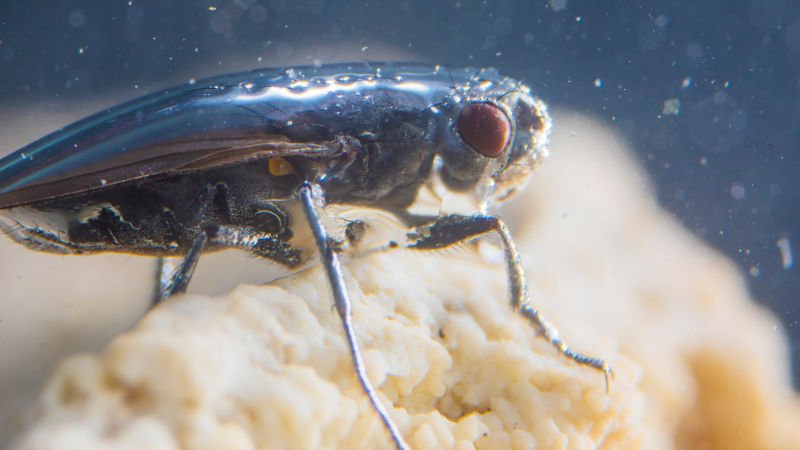
Many insects are known to quest underwater, but few are as adept at it as the alkali fly. This species has taken common attributes among flies – being covered in tiny hairs and a waxy layer – and really upped the ante. Their extra hairiness and extra waxiness make them extremely difficult to get wet, even in the excessively salty and alkaline waters of California’s Mono Lake, which are enough to defeat all but algae, brine shrimp, bacteria, and alkali flies.
Staying dry is a challenge, but only one of many this insect tackles. The combination of hair and wax over the insect makes it superhydrophobic, coating it in a silvery layer of air as it crawls below the surface. All that air is buoyant, so to walk underwater, the fly has to exert forces up to 18 times its body weight just to keep from popping back up to the surface.
The shimmering bubble also helps the fly breathe. Insect respiratory systems use openings all over the exoskeleton to exchange oxygen with the ambient atmosphere via diffusion. While diffusion of oxygen does still happen underwater, it’s a much slower process there. The air sheath around the fly creates a large surface area for oxygen to diffuse, which helps counter the lower diffusion rate. Inside the sheath, the fly breathes as it normally does. (Image and research credit: F. van Breugel and M. Dickinson; via Gizmodo; submitted by @1307phaezr)
Swimming Like a Balloon
For humans, swimming is relatively easy. Kick your legs, wheel your arms, and you’ll move forward. But for microswimmers, swimming can be more complicated. For them, the world is a viscous place, and the rules that we swim by can’t help them get around. In a highly viscous world, flows are reversible. Kick one limb down and you might move forward, but when you pull the limb up, you’ll be sucked right back to where you started. So microswimmers must use asymmetry in their swimming. In other words, their recovery stroke cannot be the mirror-image of their power stroke.
A new study suggests that simple elastic spheres could make good microswimmers through cyclic inflation and deflation. When the sphere deflates, it buckles, making a shape unlike its inflating one. This difference in shape change is enough to propel the sphere a little with each cycle. Right now the test system is a macroscale one, but the researchers hope to continue miniaturizing. (Image and research credit: A. Djellouli et al.; via APS Physics; submitted by Kam-Yung Soh)
Solving Mazes
Earlier this fall, I attempted my first corn maze. It didn’t work out very well. Early on I unknowingly cut through an area meant to be impassable and thus ended up missing the majority of the maze. Soap, as it turns out, is a much better maze-solver, taking nary a false turn as it heads inexorably to the exit. The secret to soap’s maze-solving prowess is the Marangoni effect.
Soap has a lower surface tension than the milk that makes up the maze, which causes an imbalance in the forces at the surface of the liquid. That imbalance causes a flow in the direction of higher surface tension; in other words, it tends to pull the soap molecules in the direction of the highest milk concentration. But that explains why the soap moves, not how it knows the right path to take. It turns out that there’s another factor at work. Balancing gravitational forces and surface tension forces shows that the soap tends to spread toward the path with the largest surface area ahead. That’s the maze exit, so Marangoni forces pull the soap right to the way out! (Video credit: F. Temprano-Coleto et al.; research credit: F. Peaudecerf et al.)
ETA: Based on the latest research results, gravity may play less of a role than originally thought. Instead, it seems as though the soap chooses its path in part through pre-existing background levels of surfactant. As the dye advances, it compresses the background surfactant, decreasing the local surface tension until it is in equilibrium with dyed area. Because longer paths take longer to reach that equilibrium, the dye spreads preferentially toward the largest surface area.


