Category: Phenomena

  • A Lenticular Cloud With a Curl

    A Lenticular Cloud With a Curl

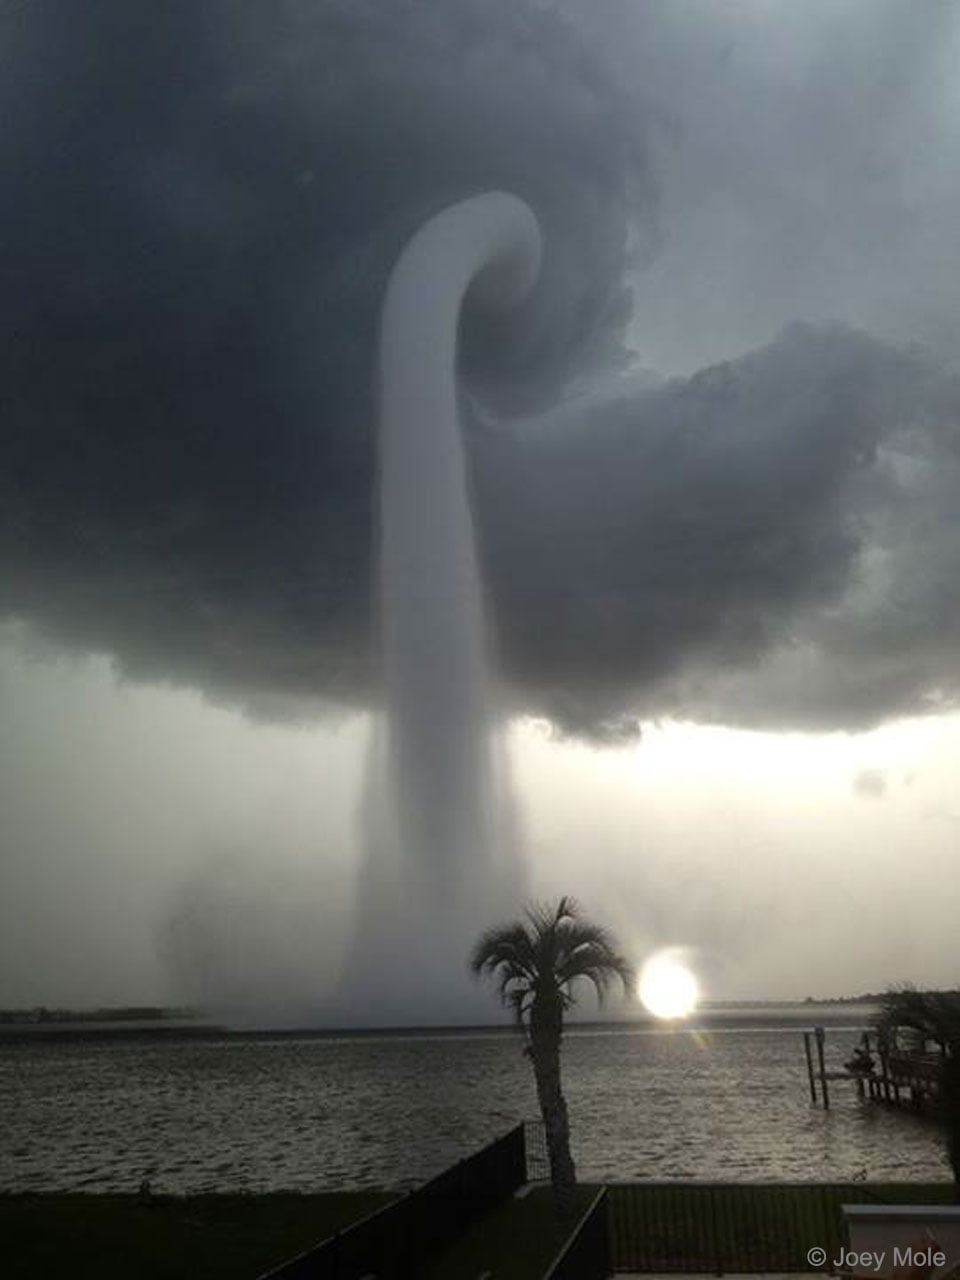
    Lens-shaped lenticular clouds are not terribly rare in mountainous areas, but observers at Mount Washington caught a very unusual cloud near sunrise in late February. This lenticular cloud had an added curl on top thanks to the Kelvin-Helmholtz instability!

    Lenticular clouds form when air is forced to flow up over a mountain in such a way that its temperature and pressure drop and water vapor in the air condenses. The resulting water droplets form a cloud that appears stationary over the mountain, even though the air continues to flow.

    To get that added wave-like curl, there needs to be another, faster-moving layer of air just above the cloud. As that air flows past, it shears the cloud layer, causing the interface to curl. Neither of these cloud types is long-lived — Kelvin-Helmholtz formations often last only a few minutes — so catching such a great dual example is lucky, indeed! (Image credit: Mount Washington Observatory; via Smithsonian Magazine; submitted by Kam-Yung Soh)

  • Featured Video Play Icon

    Renewing the Colorado River

    The Glen Canyon Dam lies on the Colorado River, upstream of the Grand Canyon. Because the dam blocks sediment from upstream, the region’s only sediment sources are two tributary rivers downstream of the dam. Periodically, the Bureau of Reclamation releases high flows from the dam in order to mimic the seasonal floods that existed on the river before the dam was built. These surge flows pick up hundreds of thousands of tonnes of sediment from the tributary rivers and push it downstream, creating and renewing sand bars and beaches along the Colorado. (Video and image credits: Bureau of Reclamation, 1, 2)

  • Featured Video Play Icon

    Michigan Dam Failure

    Last week Michigan’s Edenville Dam failed, triggering catastrophic flooding. While the exact causes of dam’s failure are not yet clear, this video of the collapse provides some interesting hints.

    As the video begins, we see water that’s already trickled down the slope, potentially a sign that the top of the dam has already degraded. Then a noticeable bulge forms near the bottom of the earthwork slope, followed quickly by a landslide. Water doesn’t pour out immediately, though. That delay suggests that only part of the dam’s thickest section failed in the landslide. During the delay, the remaining interior of the dam is failing from the sudden lack of support. Then, the floodwaters come pouring out.

    From the sequence of events, it seems likely that the dam was suffering from soil liquefaction prior to the collapse. With high water levels behind the dam, pressure can drive water into the soil beneath the dam, reducing its strength. You can see this effect in action in this video and this one. For more on the Edenville dam specifically, check out the great analysis over at AGU from Dave Petley (1, 2).

    Sadly, failures like these are quite avoidable, provided dams are properly maintained. Climate change is drastically altering precipitation patterns across the world, and without updating and reworking our infrastructure to account for that, we’ll see more failures like this in the future. (Video and image credit: L. Coleman/MLive; via Earther; see also D. Petley 1, 2)

  • Updating Undergraduate Heat Transfer

    Updating Undergraduate Heat Transfer

    For many engineering students, their first exposure to fluid dynamics comes in a heat transfer class. The typical focus in these classes is not on the underlying physics but on learning to use empirical formulas and correlations that are used in engineering heat exchangers, computer fans, and other applications.

    As part of this, students are presented with an extremely simplified view of classical flows like flow over a flat wall, known as a flat-plate boundary layer. Students are told that there are two main features of this and other flows: a laminar region where flow is smooth and orderly, and a turbulent region where flow is chaotic and better at mixing. The transition between these two, according to the undergraduate picture, takes place at a particular point that can be calculated as part of the correlation.

    The problem with this picture is that it grossly oversimplifies the actual physics, and for students who may not take dedicated, graduate-level fluid dynamics courses, leaves future engineers with a false understanding that may impact their designs. The truth of transition is far more complicated and nuanced. Transition from laminar to turbulent flow rarely takes place at a single, predictable point; instead it takes place over an extended region and where it begins depends on factors like geometry, vibration, and the level of turbulence already present in the flow.

    In an effort to bring undergraduate heat transfer correlations more in line with actual physics — as well as with real, experimental data — a new study revamps the mathematical models. Personally, I applaud any effort to add some nuance to the introduction of this important topic. (Image and research credit: J. Lienhard; via phys.org)

  • The Naruto Whirlpools

    The Naruto Whirlpools

    Enormous whirlpools are not simply the work of overactive imaginations. There are several spots in the world, including Japan’s Naruto Strait, that regularly see these spectacular vortices.

    Naruto’s whirlpools are formed through the interaction of tidal currents with the local topography. Spring tides funneled through the vee-shaped strait can reach speeds of 20 kph as they rush between the Pacific Ocean and the Inland Sea. Below the surface, there’s also a deep depression that helps bring the tides together in such a way that it generates vortices 20 meters in diameter.

    In normal times, the whirlpools are a significant tourist attraction during the springtime. Travelers can view them from tour boats, helicopters, and from the Onaruto Bridge. (Image credits: whirlpools – Mainichi/N. Yamada, Discover Tokushima; artwork: Hiroshige; via Mainichi; submitted by Alan M.)

  • Featured Video Play Icon

    Aerosol Transport

    NASA Goddard has produced another gorgeous visualization of how various aerosols move around our world. This visualization is constructed from data collected between August 2019 and January 2020, which means that it captures numerous typhoons as well as the extreme bushfires that occurred in Australia.

    Different colors represent different aerosol sources: carbon (red), sulfate (green), dust (orange), sea salt (blue), and nitrate (pink). The brighter the color, the higher the concentration of aerosols. With this, we see steady patterns of natural sea salt transport and the billowing flow of dust from Saharan Africa. But we can also see manmade pollution from sources across the Northern Hemisphere, as well as major output from the Australian bushfires. It’s a good reminder that none of us is truly isolated in this interconnected world of ours. (Video and image credit: NASA Goddard; via Flow Vis)

  • Colorful Tides

    Colorful Tides

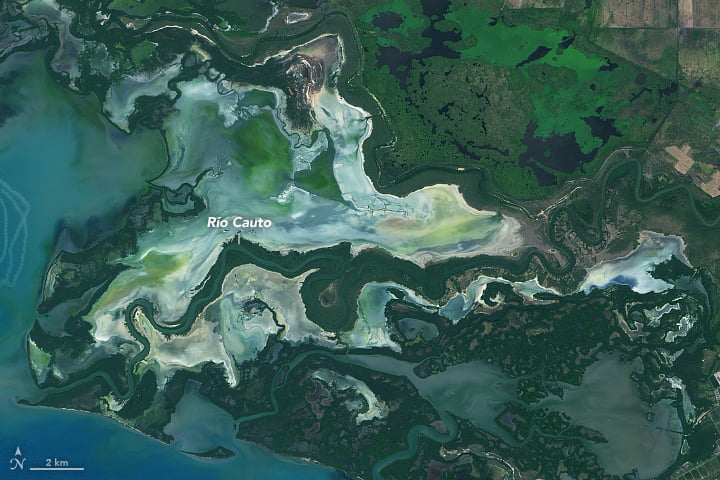
    This false-color satellite image — the recent winner of NASA Earth Observatory’s Tournament Earth 2020 — shows sands and seaweed off the coast of the Bahamas. Ocean currents and tides eroded these elaborate fluted designs in much the same way that winds sculpt desert dunes. The overlap in form is no accident; as seen in recent work, researchers are finding that both air and water move granular materials like sand according to the same rules. (Image credit: S. Andrefouet; via NASA Earth Observatory)

  • Bioluminescence at the Beach

    Bioluminescence at the Beach

    A bioluminescent phytoplankton bloom is causing a stir among California beachgoers. During the daytime, aggregations of Lingulodinium polyedra appear reddish-brown in color (think the classic ‘red tide’). But at night the phytoplankton bioluminesce, specifically when they’re disturbed by a change in shear force. This is why the brightest glows are visible in crashing waves or around the boards of surfers.

    Beautiful as it appears, blooms like these are deadly to marine life. The excess numbers of phytoplankton strip water of oxygen, causing mass die-offs among fish. Even residents several miles inland of the beaches are reporting the unpleasant smell that results. (Image credits: AP; video credit: Scripps Institute of Oceanography; via Gizmodo)

  • Featured Video Play Icon

    How COVID-19 Affects the Lungs

    One of the best known COVID-19 symptoms of this pandemic is difficulty breathing, and while you’ve likely heard a lot about ventilators used to help patients get oxygen, you may not know much about the processes that cause the breathing problems. This video from Deep Look provides a solid overview of the infection route and how lung damage occurs during infection. Perhaps unsurprisingly — this is FYFD, after all — fluid dynamics plays a major role in this process, both under normal conditions and when air sacs in the lungs get damaged by the body’s immune system responding to the virus. (Image and video credit: Deep Look)

  • Featured Video Play Icon

    Holding Pipes in Place

    Newton’s 3rd law states that any action has an equal and opposite reaction. Often engineers use this to our advantage; the thrust from expelling propellants is what lifts our rockets to space. But sometimes those reactions are undesirable, as illustrated in this Practical Engineering video with underground pipes.

    Anytime flow through the pipe is forced to change direction, the flow causes an equal and opposite force on the joint. Just as with rockets, engineers refer to this reaction force as thrust. And if the thrust goes unaccounted for, it will force pipe joints apart. Civil engineers use several methods to fix pipelines against these forces, including concrete blocks that distribute the force to the surrounding soil and flange fittings that resist pipe movement. (Video and image credit: Practical Engineering)