This lovely video from Ruslan Khasanov showcases the beautiful interplay of surface tension, diffusion, and immiscibility in common fluids. With soy sauce, oil, ink, soap, and a little gasoline, he creates a mesmerizing world of color and motion. It’s a great reminder of the wonders that populate our daily lives, if we just look closely enough to see them. (Video credit: R. Khasanov; via Wired; submitted by Trevor)
Month: August 2013

Why Honeycomb is Hexagonal
The regular hexagonal structure of honeycomb may owe more to fluid dynamics than the careful engineering of the bees that build it. Observations indicate that honeycomb cells start out circular and become hexagonal as the bees continue building. Both experiments and models show that an array of circular cells can transform into hexagons due to surface tension driving flow at the junctions where the three cell walls meet. But for the wax to flow, it has to be warm–about 45 degrees Celsius compared to the hive’s ambient temperature of 25 degrees. The researchers suggest that the worker bees constructing the comb knead and heat the wax with their bodies until it’s able to flow and form the hexagons. (Photo credit: G. Mackintosh; via Nature and B. L. Karihaloo et al.)

Ski Jumping Aerodynamics
Last summer we featured fluid dynamics in the Summer Olympics and there’s more to come for Sochi. Winter athletes like ski jumper Sarah Hendrickson are hard at work preparing, which can include time in wind tunnels, as shown here. There are two main diagnostics in tests like these: drag measurements and smoke visualization. The board Hendrickson stands on is connected to the tunnel’s force balance, which allows engineers to measure the differences in drag on her as she adjusts equipment and positions. This gives a macroscopic measure of drag reduction, and reduced drag makes the skier faster on the snow and lets her fly longer in the jump. The smoke wand provides a way to visualize local flow conditions to ensure flow remains attached around the athlete, which also reduces drag. (Video credit: Red Bull/Outside Magazine; submitted by @YvesDubief)

Shocking Instabilities
The Richtmyer-Meshkov (RM) instability occurs when the interface between two fluids of different density is impulsively accelerated – usually by the passage of a shock wave. The image above shows a thin layer of gaseous sulfur hexafluoride embedded in air. Each vertical line, from left to right, shows the distortion of the two fluids at subsequent time steps after a Mach 1.2 shock wave passes through the gases. The interface’s initial waviness grows into mushroom-like shapes that mix the two gases together, ultimately leading to turbulence. Scenarios involving the RM instability include supersonic combustion ramjet engines, supernovas, and inertial confinement fusion. The RM instability is closely related to Rayleigh-Taylor instability and shares a similar morphology. (Photo credit: D. Ranjan et al.)
Evaporating Drops
When still drops evaporate from a surface, they do so in several phases, as illustrated in the video above. Initially, the drop forms a spherical cap. At this point the velocity within the droplet is so small that it is difficult to resolve, but particles within the drop move outward toward the contact line. As the drop evaporates, they form a circle of sediment – the familiar coffee ring. As the drop flattens, radial velocity increases, drawing more and more particles to the coffee ring. Eventually the drop pulls away from the ring, leaving surface tension and evaporation to compete in driving the internal flow. During this phase, some parts of the contact line try to re-establish the flow pattern that made the first ring; this leaves behind circular segments broken up by the increasing instabilities in the contact line. In the final stage, surface tension smooths some of the irregularities and drives an inward velocity that leaves behind radial sediment segments. (Video credit: G. Hernandez-Cruz et al.)

Fluids Round-up – 24 August 2013
Fluids round-up time! Here are your latest fluids links to check out:
- One of the great fundamental questions of life is, of course: what is the airspeed velocity of an unladen swallow? Jonathan Corum explains how to use fluid dynamics to estimate the answer. (submitted by Andrew C)
- Sound and acoustics play a big role in fluid dynamics. Check out acoustics blog Listen To That Noise to learn more about the subject daily.
- io9 has a great collection of crazy natural ice sculptures, some of which remind me of wild airfoil-shaped ice I found several years back.
- For the chemically-inclined, Simon Gladman has a neat implementation of Hiroki Sayama’s Swarm Chemistry that adds fluid dynamics and advection into the simulation. Check out videos and get links to the code here.
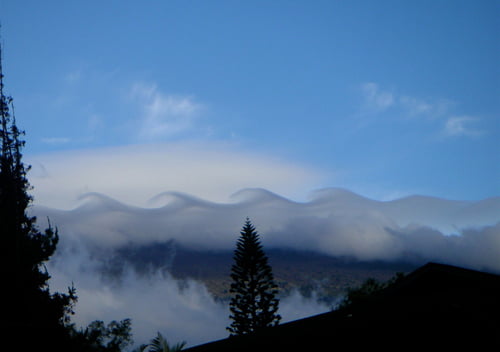
- Finally, TED has some gorgeous photos of unusual clouds including our headliner, a lovely example of a Kelvin-Helmholtz cloud, to go along with Gavin Pretor-Pinney’s talk on the joys of cloud-spotting. (via Flow Visualization on FB)
(Photo credit: G. Pretor-Pinney)

Vortex Street in the Clouds
Most objects are not particularly aerodynamic or streamlined. When air flows over such bluff bodies, they can shed regular vortices from one side and then the other. This periodic shedding creates a von Karman vortex street, like this one stretching out from Isla Socorro off western Mexico. From the wind’s perspective, the volcanic island forms a blunt disruption to the otherwise smooth ocean. This vortex shedding is seen at smaller scales, as well, in the wind tunnel, in soap films, and in water tunnels. If you’ve ever been outside on a windy day and heard the electrical lines “singing” in the wind, that’s the same phenomena, too. With the right crosswind, radial bicycle spokes will buzz for the same reason as well! (Photo credit: MODIS/NASA Earth Observatory)
Flame Feedback
When a flame is enclosed in a combustion chamber, it can create violent oscillations in the pressure field. Flames have a natural unsteadiness in their heat release. These temperature fluctuations create pressure waves in the chamber. In the right enclosure, those pressure waves resonate and feed energy back into the initial perturbation. This creates a self-exciting oscillation, not dissimilar from aeroelastic flutter. This combustion instability is known as a thermoacoustic instability because of the coupling between temperature and pressure (acoustic) waves. The quick demo above lets you see and hear such an instability; here’s the same setup in high-speed, which makes the oscillating flame even clearer. The violence of this instability can be great enough to destroy engines. Famously, the F1 engine used in the Saturn V rocket had a history of instability issues before the fuel-injector was redesigned. For another great demo of this effect, check out this video from T. Poinsot. (Video credit: V. Anandan)
Breaking Waves
Most beach-goers have probably wondered just what makes the waves coming in to shore rear up and break. The secret lies in the depths–or rather the lack thereof–beneath the waves. Far from shore, the wave’s length scale is small compared to the ocean depth, and the ocean’s bottom is effectively infinitely far away to all parts of the wave. But, as the wave rolls toward shore, the depth decreases and the ocean bottom begins to influence the wave. In the trough, the ocean bottom slows the wave. Meanwhile, the crest of the wave carries forward, rising until its height reaches 80% of the water depth, at which point it will tip over and break.(Video credit: BBC)

Streamlines in Oil
Bernoulli’s principle describes the relationship between pressure and velocity in a fluid: in short, an increase in velocity is accompanied by a drop in pressure and vice versa. This photo shows the results left behind by oil-flow visualization after subsonic flow has passed over a cone (flowing right to left). The orange-pink stripes mark the streamlines of air passing around the Pitot tube sitting near the surface. The streamlines bend around the mouth of probe, leaving behind a clear region. This is a stagnation point of the flow, where the velocity goes to zero and the pressure reaches a maximum. Pitot tubes measure the stagnation pressure, and, when combined with the static pressure (which, counterintuitively, is the pressure measured in the moving fluid), can be used to calculate the velocity or, for supersonic flows, the Mach number of the local flow. (Photo credit: N. Sharp)