Light streams from the branches of trees in this series from photographer Vitor Schietti. The effect is created with a combination of fireworks, long-exposure photography, and compositing. I love how the falling sparks create streaklines just like so many flow visualization diagnostics do! Follow more of Schietti’s work on Instagram. (Image credit: V. Schietti; via Colossal)
Tag: streakline

Fiery Streaklines
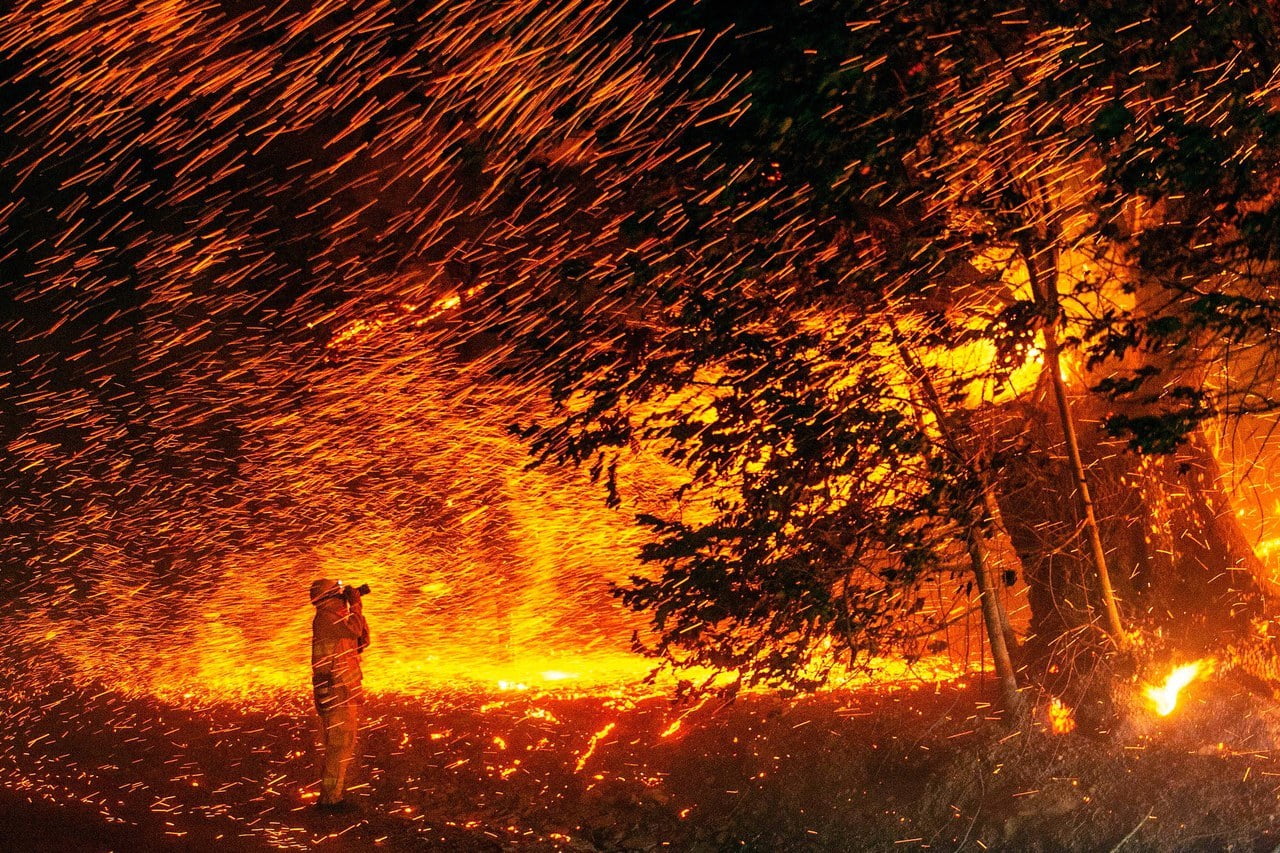
Embers fly through the Kincade wildfire leaving streaks of light that reveal the strong winds helping drive the fire. This unintentional flow visualization mirrors techniques used by researchers to understand how flows are moving. The shutter of the camera remains open for a fixed time, so the length of each streak tells us about the speed of the flow. Longer streaks occur where embers moved faster.
Here we see the longest streaks in the upper left side of the image, which tells us that the wind was moving faster there than it did at lower heights, like near the photographer in the picture. That’s in keeping with what we would expect. In general, winds move faster above the ground than they do near the surface. That speed difference is one of the reasons wildfires are so difficult to contain; a single ember caught by high winds is easily carried to unburnt areas, allowing the fire to spread more quickly than if it had to burn along the ground. (Image credit: J. Edelson/Getty Images; via Wired)

Graphene Swirls
Graphene powder swirls in alcohol in this prize-winning photo from this year’s Engineering and Physical Sciences Research Council photography competition in the UK. The image was captured while producing graphene ink that can print circuits directly onto paper. According to the researcher’s description, this ink is forced through micrometer-sized capillaries at high pressure to rip the layers apart and produce a smooth, conductive ink in solution. In this photo, we seem to see more conventional mixing driven by the powder’s injection and the variations in surface tension due to the alcohol and its evaporation. The graphene leaves behind beautiful streaklines that highlight its path as it mixes. (Image credit: J. Macleod; via Discover)

Flow Above the Treetops
As this smoke visualization shows, trees have a significant impact on airflow around them. Flow in the image is from left to right. On the left, the upstream air is traveling in smooth, laminar lines that are quickly disrupted as the flow moves into the trees. After the first shorter trees, flow inside the wooded area has been broken up and slowed. Above the canopy, the smoke streaklines have also slowed and become more turbulent. Understanding how wind and trees interact is important in a variety of applications, including when adding renewable energy options to buildings and when predicting the spread of forest fires. (Image credit: W. Frank et al.)

Pathlines vs. Streaklines
When considering fluid motion, there are many ways to describe trajectories through the flow. One is the pathline, the trajectory followed by an individual fluid particle. Imagine releasing a rubber duck down a stream. Following the duck’s position over time would give you a pathline. Now imagine that instead of releasing a single rubber duck you release lots of them – say one every half-second from the exact same starting spot. You would end up with a line of rubber ducks stretching downstream, each of them sharing the same origin but with a different starting time. This is called a streakline. Would the streakline of rubber ducks follow the same trajectory as the lone duck? Not if the flow is time-varying! In fact, for unsteady flows, pathlines and streaklines can give completely different pictures of a flow, as illustrated in the video above. Knowing and understanding the difference between these types of trajectories is extremely important when it comes interpreting flow visualizations in unsteady flows because some visualization methods produce pathlines and others produce streaklines. (Video credit: V. Miller and M. Mungal)


