Tag: planetary science

  • Jupiter in Many Lights

    Jupiter in Many Lights

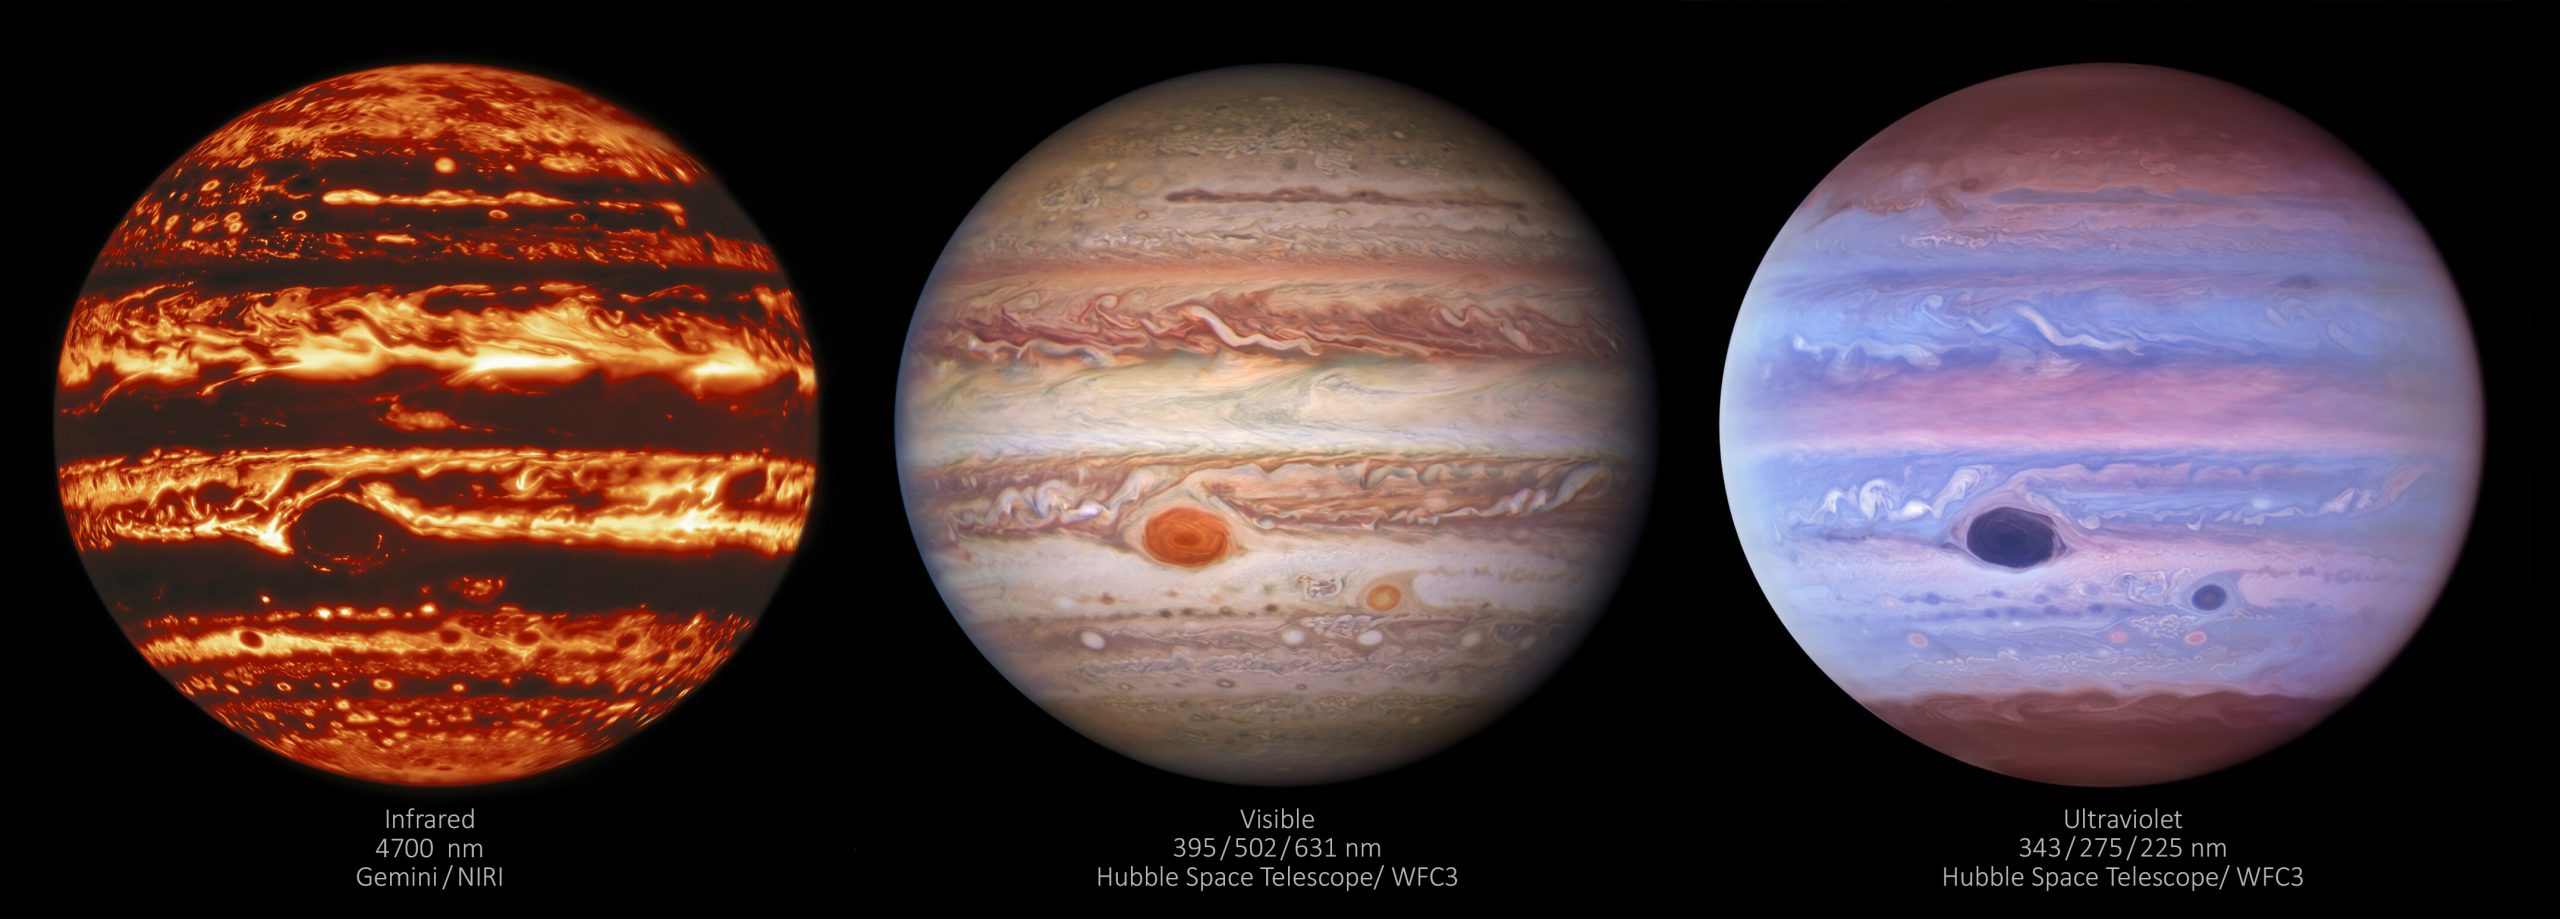
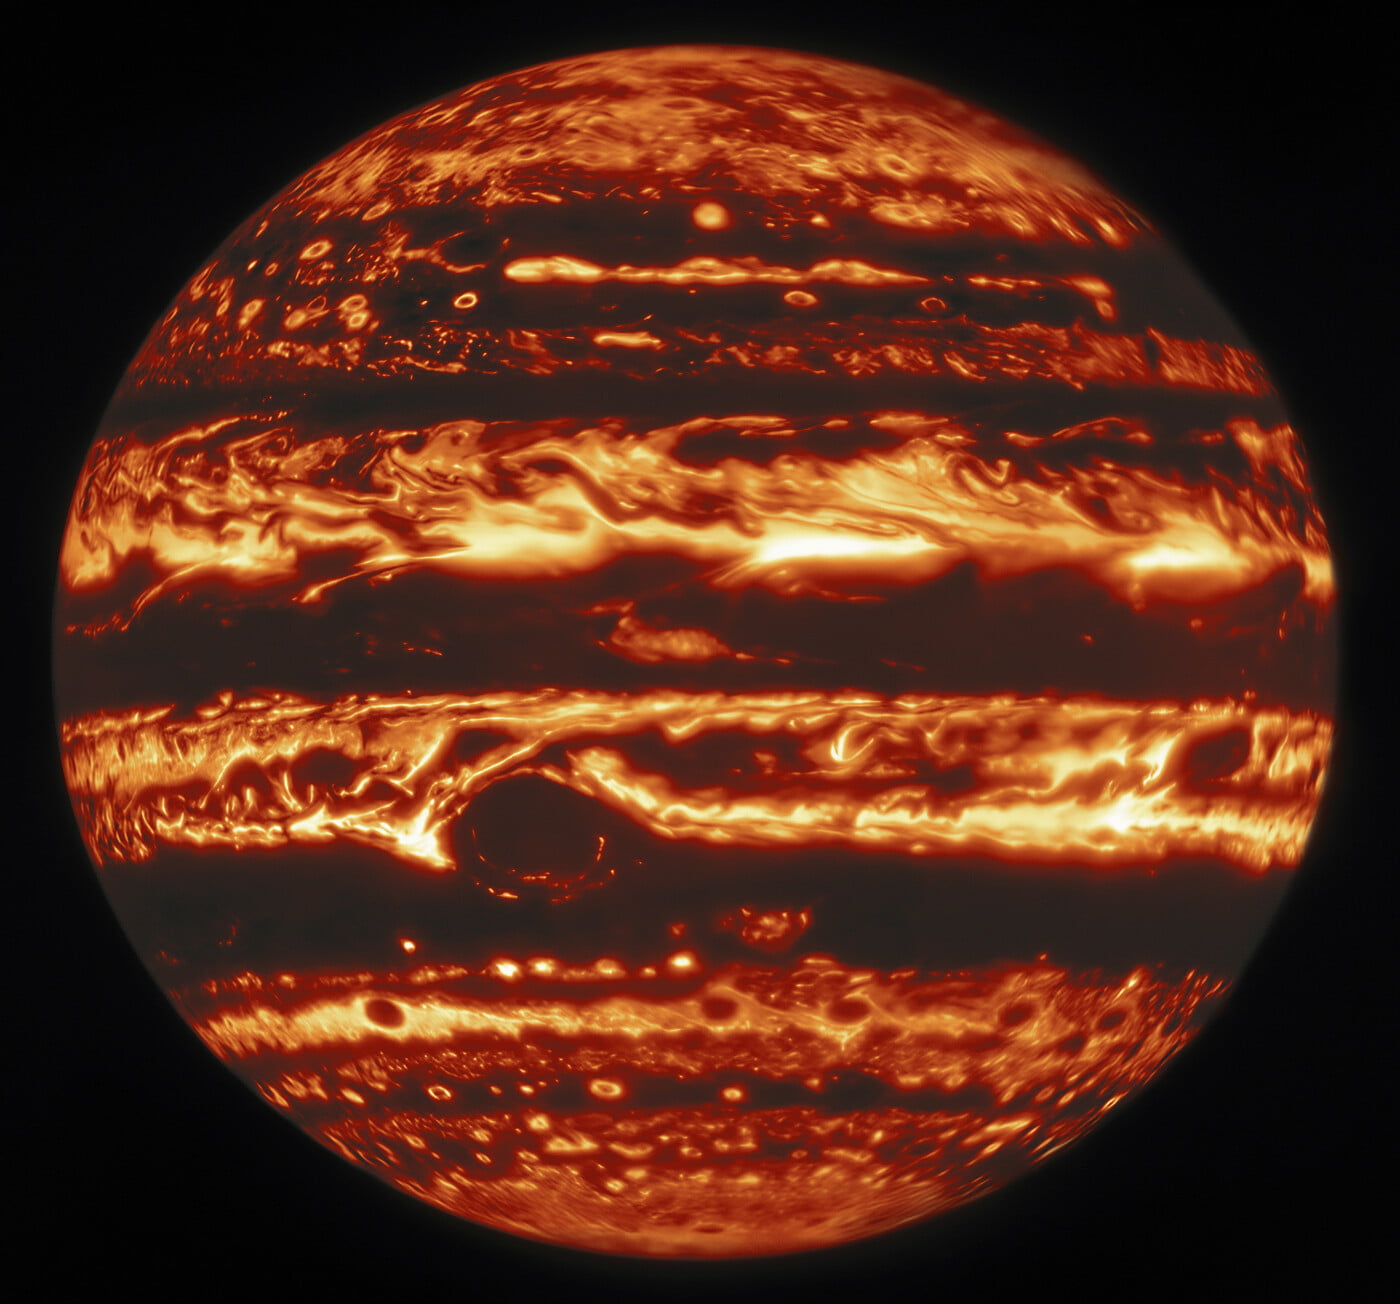
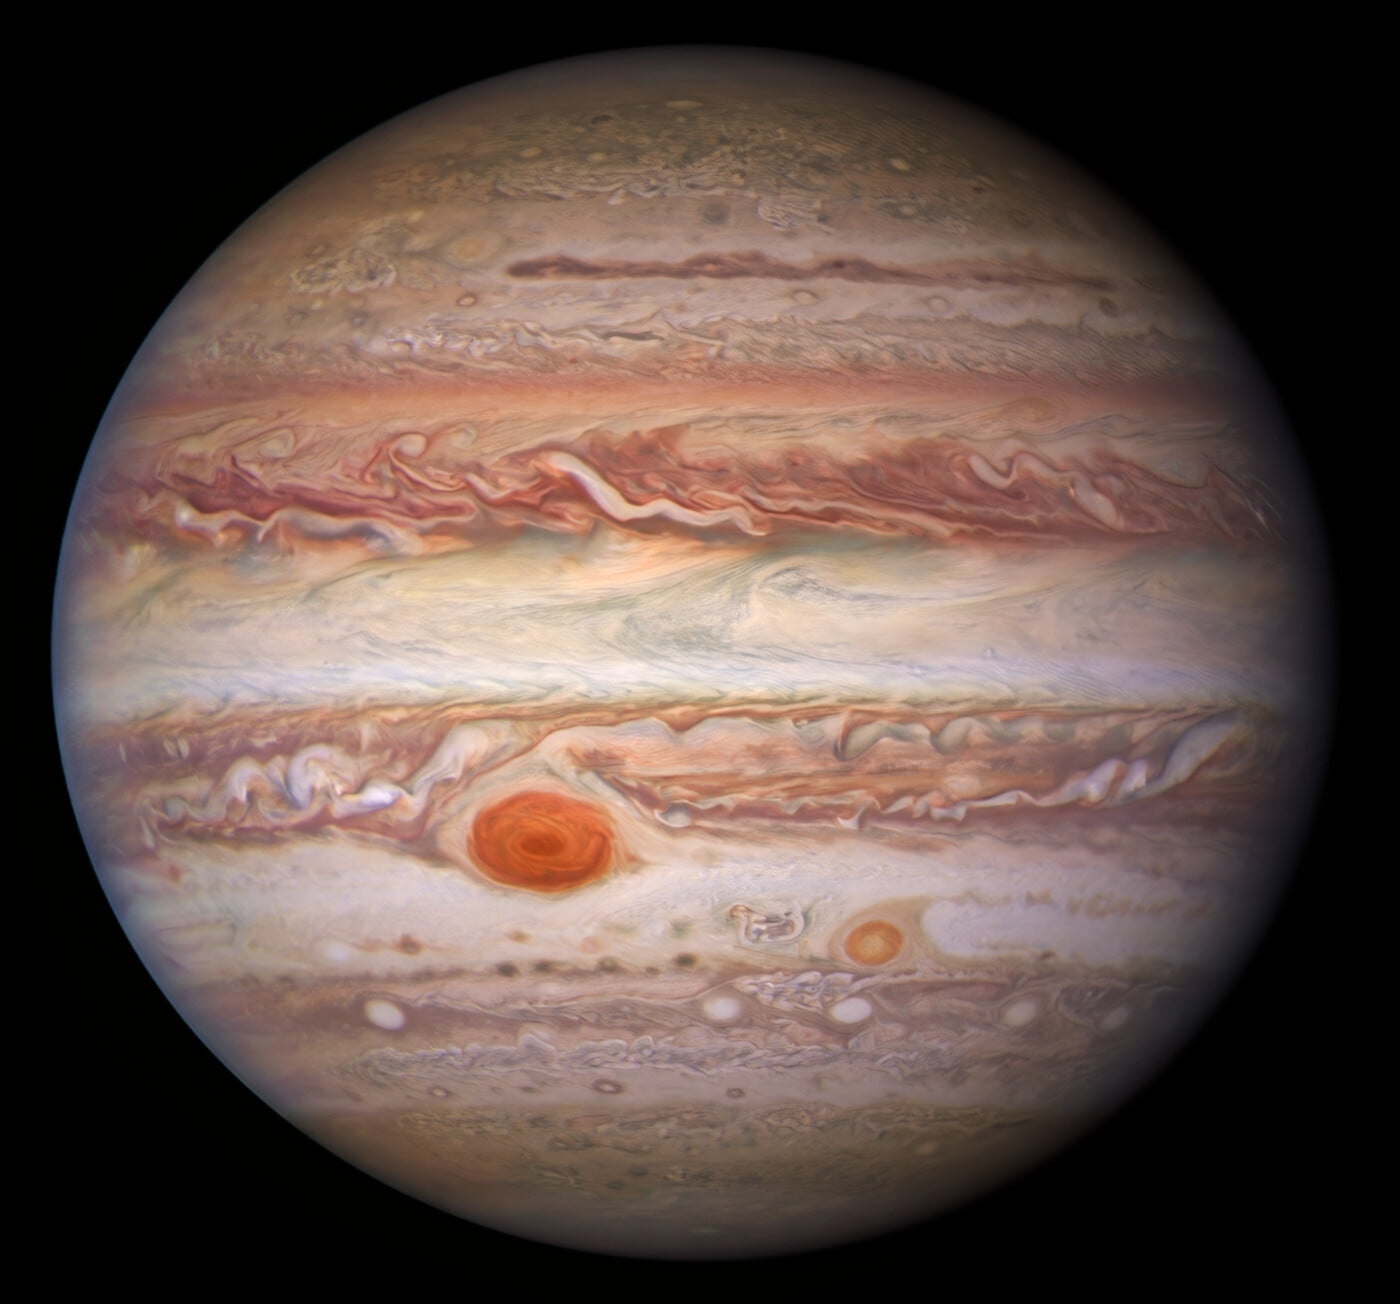
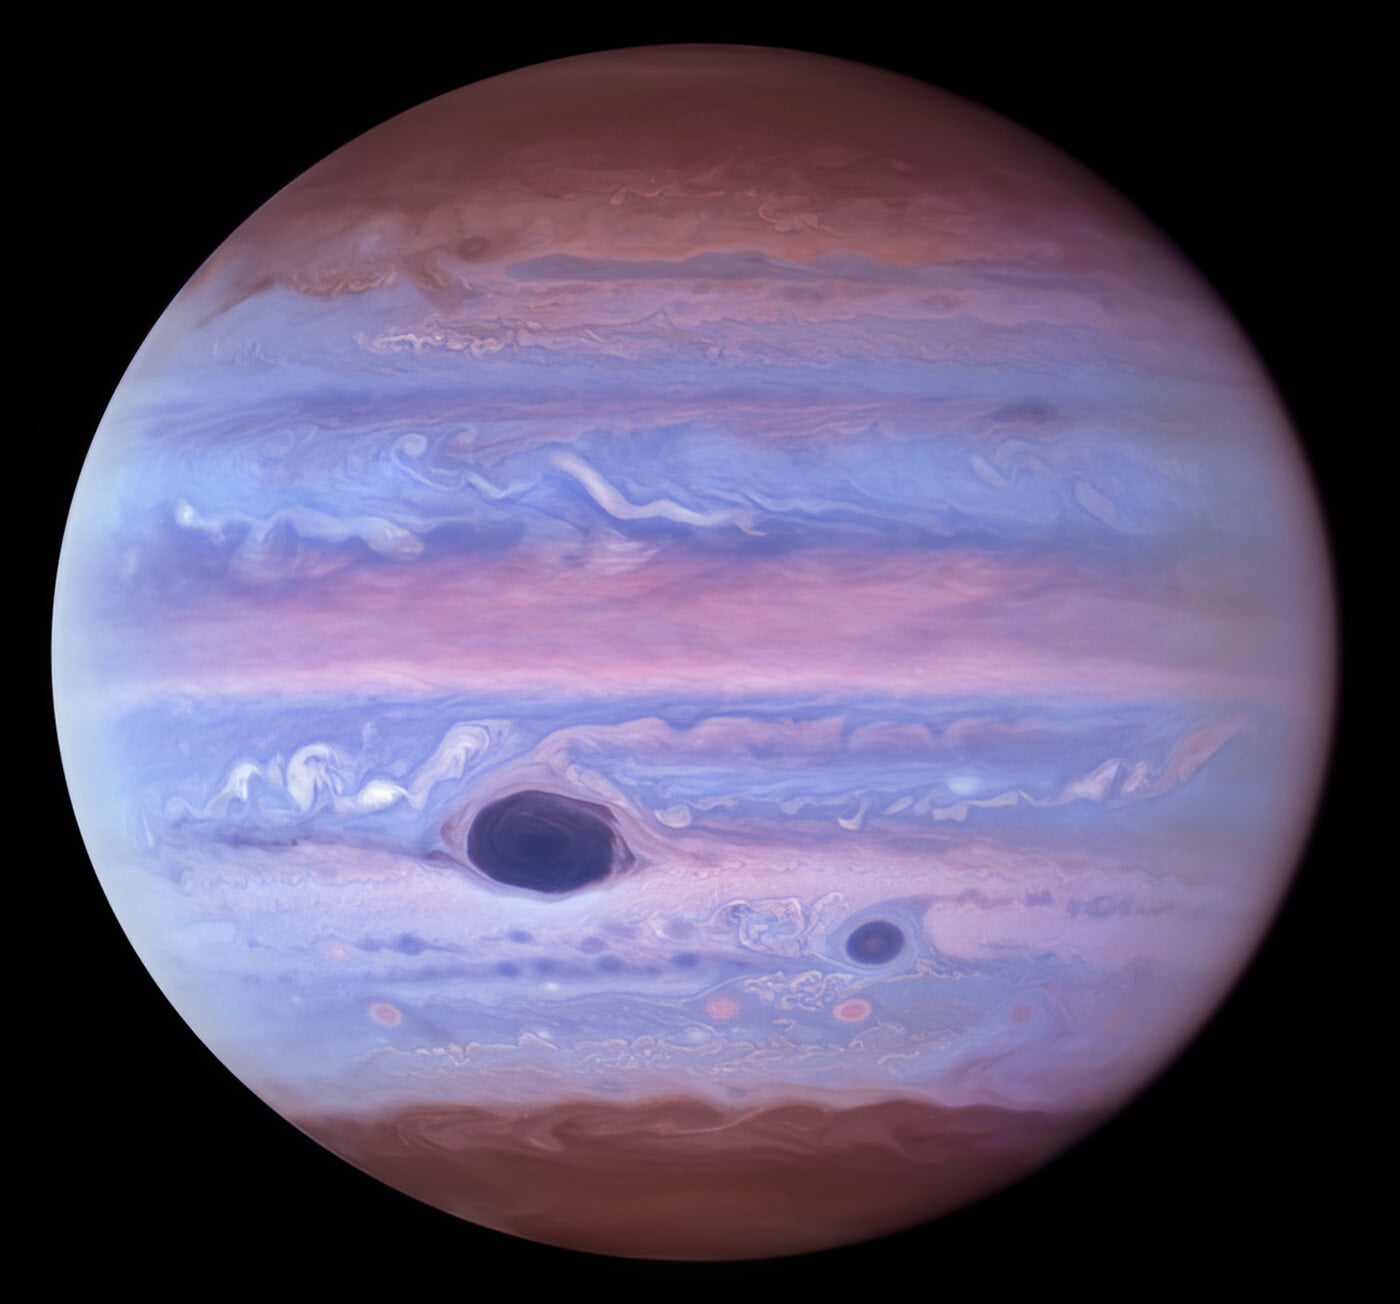
    Sometimes the key to unraveling a mystery is to observe the phenomenon in different ways. That’s why researchers are increasingly taking advantage of multiple instruments simultaneously observing targets like Jupiter. Here we see the gas giant in three different types of light: infrared, visible, and ultraviolet. Infrared bands reveal the hot and cold regions of Jupiter’s clouds, allowing scientists to identify convective areas. Ultraviolet observations can reveal high-energy processes, like Jupiter’s auroras. And the colors revealed in visible light can give hints about chemical make-up in different regions. But to get a fuller picture, scientists compare all three modes — along with radio signal data from Juno — to understand topics like the planet’s lightning-filled storms. (Image credits: International Gemini Observatory/NOIRLab/NSF/AURA/NASA/ESA, M.H. Wong and I. de Pater (UC Berkeley) et al.; via Gizmodo)

  • Ingenuity’s Dust Cloud

    Ingenuity’s Dust Cloud

    Mars is quite dusty. It periodically gets swallowed by planet-spanning dust storms, but it’s also home to regular dust devils whose size can put Earth’s to shame. Exactly how so much dust gets picked up by Mars’ incredibly thin atmosphere — only 1% of Earth’s — is still something of a mystery. So scientists were excited after the Ingenuity helicopter’s fourth flight, where cameras on the Perseverance rover caught a billowing dust cloud following Ingenuity as it flew. Knowing how the helicopter flies, they may be able to unravel just how its wake picks up and carries dust. Since Ingenuity’s only purpose was to demonstrate flight on another planet, this would be a big scientific bonus for an already successful mission! (Image credit: NASA/JPL-Caltech/ASU/MSSS/SSI; via Nature; submitted by Kam-Yung Soh and jpshoer)

  • The Variable Venusian Day

    The Variable Venusian Day

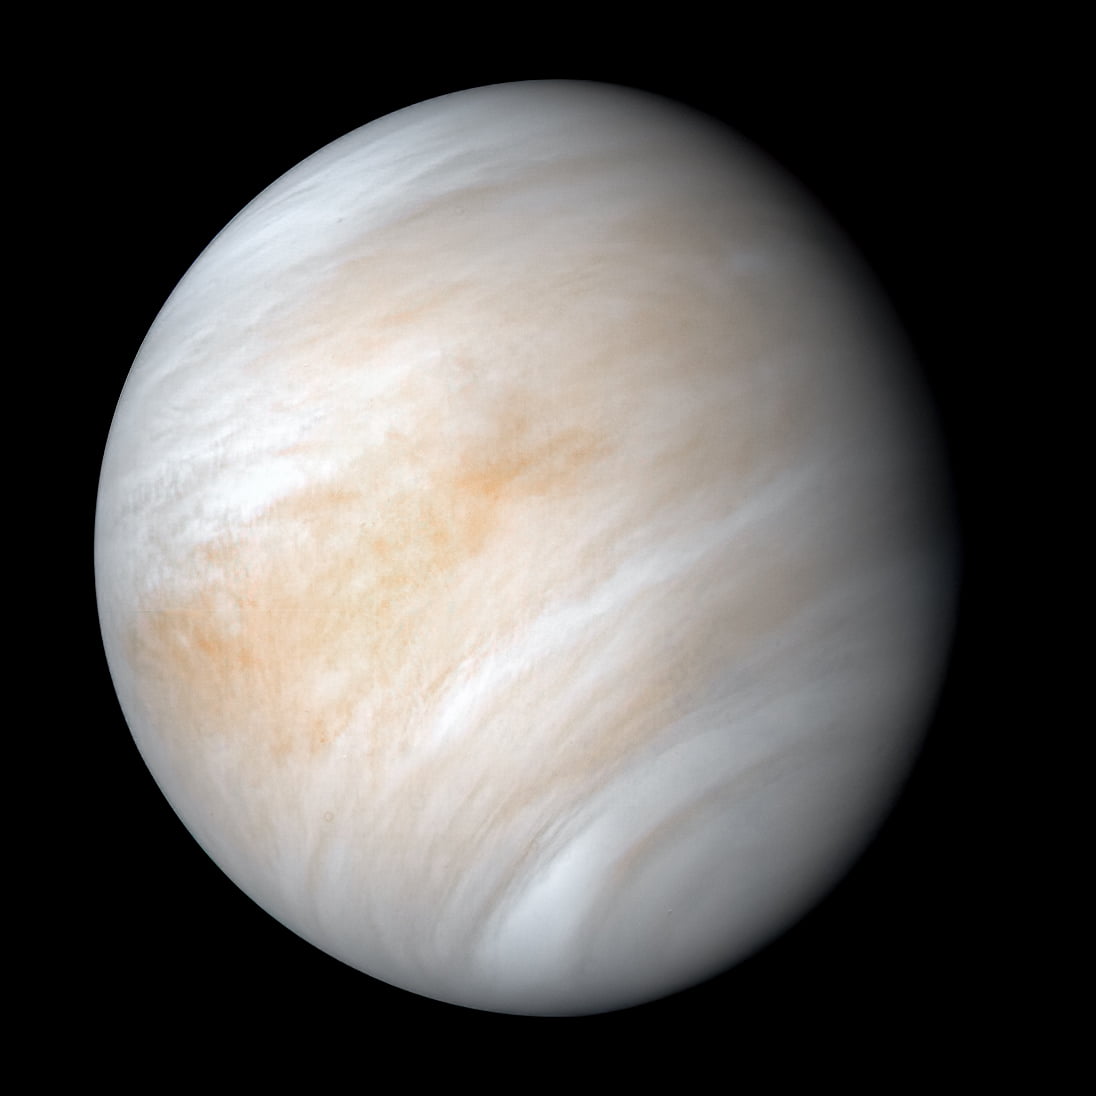
    Venus is a thoroughly unpleasant place thanks to its hellish temperatures and acidic clouds, but a new study adds another wrinkle to our strange sister planet: Venus’s day varies by up to 21 minutes in length. This peculiar factoid is the result of 15 years spent monitoring Venus’s rotation via radar. Previous attempts to pin down the exact length of Venus’s day produced differing answers; those disagreements make more sense in light of the new study, where individuals measurements of Venus’s rotation rate could differ by 3 minutes just from one (Earth) day to the next!

    So why does Venus’s rotation rate change so dramatically? Venus’s atmosphere is massive — 100 times more massive than Earth’s — and it spins incredibly fast. The upper layers of Venus’s atmosphere can complete a rotation in 4 Earth days, while the solid ground requires 243 Earth days. As the atmosphere spins and sloshes, some of its angular momentum gets transferred to the ground, changing the planet’s rotation rate. (Image credit: NASA/JPL-Caltech; research credit: J. Margot et al.; via AGU Eos; submitted by Kam-Yung Soh)

  • Featured Video Play Icon

    Ferrovolcanism

    Beyond Earth, scientists expect to find objects formed by a volcanism much different than what we typically see here. Researchers used Syracuse University’s Lava Project apparatus to simulate ferrovolcanism — in this case with a mixture containing both metallic lava and silicate lava. Interestingly, the team found that the two types of lava flow largely independently of one another. The silicate lava is much more viscous but less dense and flows relatively slowly. The metallic lava is far less viscous and flows about 10 times faster, but it’s also denser, so most of it flows beneath the silicate lava, with only a few fingers that burst out atop the other lava or erupt in braided flows from the leading edge of the flow.

    The upcoming Psyche mission will explore a metal asteroid (of the same name) that’s thought to be the remains of an early planet’s nickel-iron core. Studies like this one are giving planetary physicists new insight into the kinds of geological features await us there. (Video and research credit: A. Soldati et al.; via AGU Eos; submitted by Kam-Yung Soh)

  • Blue Dunes

    Blue Dunes

    This false-color image shows a Martian dune field near the northern polar cap. The image itself covers an area 30 kilometers wide, but the dune field stretches over an area the size of Texas. In the photo cooler areas have been rendered in bluer tints, while warm areas are shown in yellow and orange. The sun warms the wind-sculpted dunes more than in the valleys that lie between. Complex dune networks like these build up over time as consistent winds push sand and create interactions between individual dunes. (Image credit: NASA/JPL-Caltech/ASU; via Colossal)

  • Rainfall Beyond Earth

    Rainfall Beyond Earth

    Rain is not unique to our planet: Titan has methane rain and exoplanet WASP 78b is home to iron rain (ouch). A new study examines rainfall across planets from the perspective of individual rain drops. The authors examine raindrop shape, terminal velocity, and evaporation rate as a function of droplet size for a wide range of known and speculated atmospheres.

    They found that raindrops are surprisingly universal. Although planets with higher gravity tend to produce smaller raindrops, they found a remarkably narrow range for maximum drop size. That’s a pretty wild result, all things considered! The idea that iron, ammonia, methane, and countless other fluids falling through vastly different atmospheres all share very common characteristics is fascinating. (Image credit: NASA/JPL-Caltech/SwRI/MSSS/Brian Swift; research credit: K. Loftus and R. Wordsworth; via Science News; submitted by Kam-Yung Soh)

  • Jovian Auroras

    Jovian Auroras

    Like Earth, Jupiter is home to polar auroras that light the sky as charged particles interact with the planet’s magnetosphere. A recent paper identifies interesting features in the aurora that appear similar to expanding vortex rings (see inset below). Although the researchers cannot yet identify the origin of the rings, they hypothesize that the process begins at the far edges of Jupiter’s magnetosphere where it interacts with the incoming solar wind. One theory posits that shear flows and Kelvin-Helmholtz instabilities where the magnetosphere and solar wind meet drive the phenomenon. (Image credit: Jupiter – NASA, ESA, and J. Nichols, aurora features – NASA/SWRI/JPL-Caltech/SwRI/V. Hue/G. R. Gladstone/B. Bonfond; research credit: V. Hue et al.; via Gizmodo)

    Diagram showing an inset of Jupiter's northern aurora, with further insets showing the expanding ring features.
  • Featured Video Play Icon

    Lava and Life

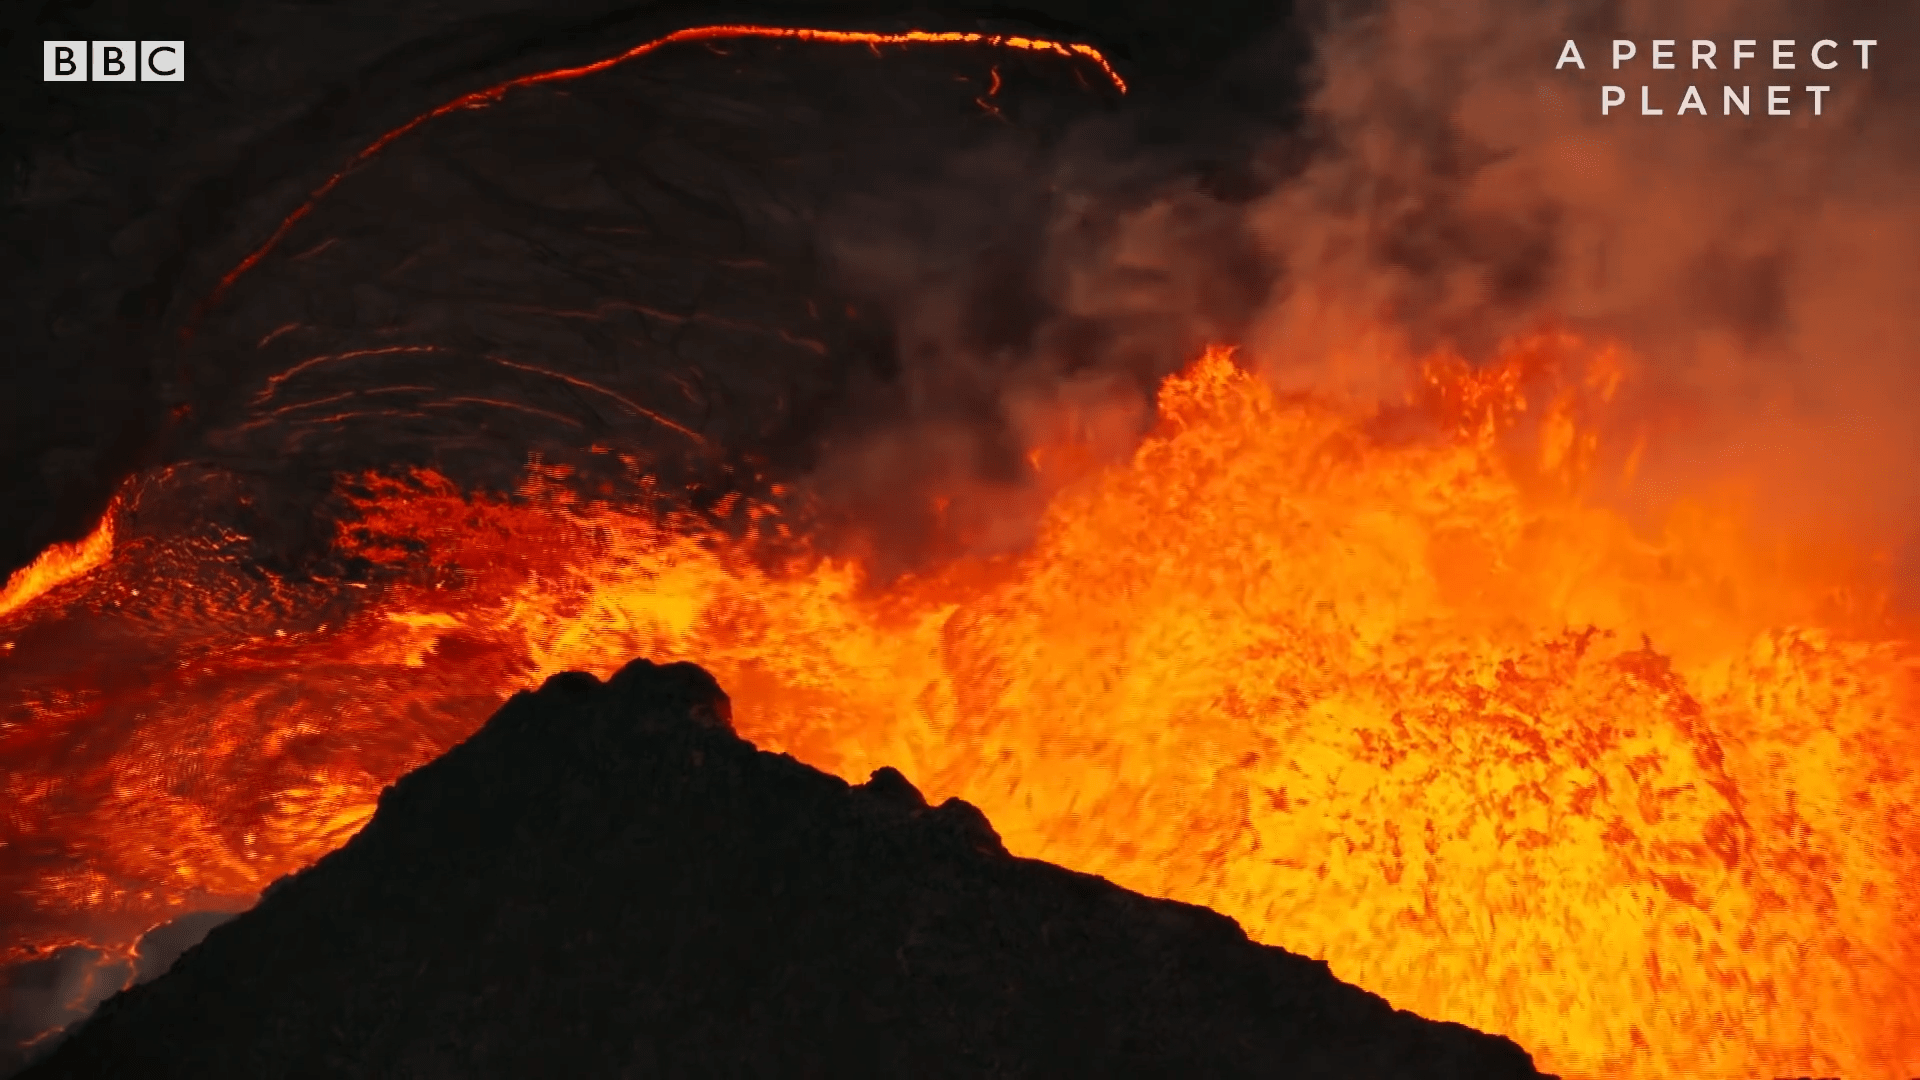
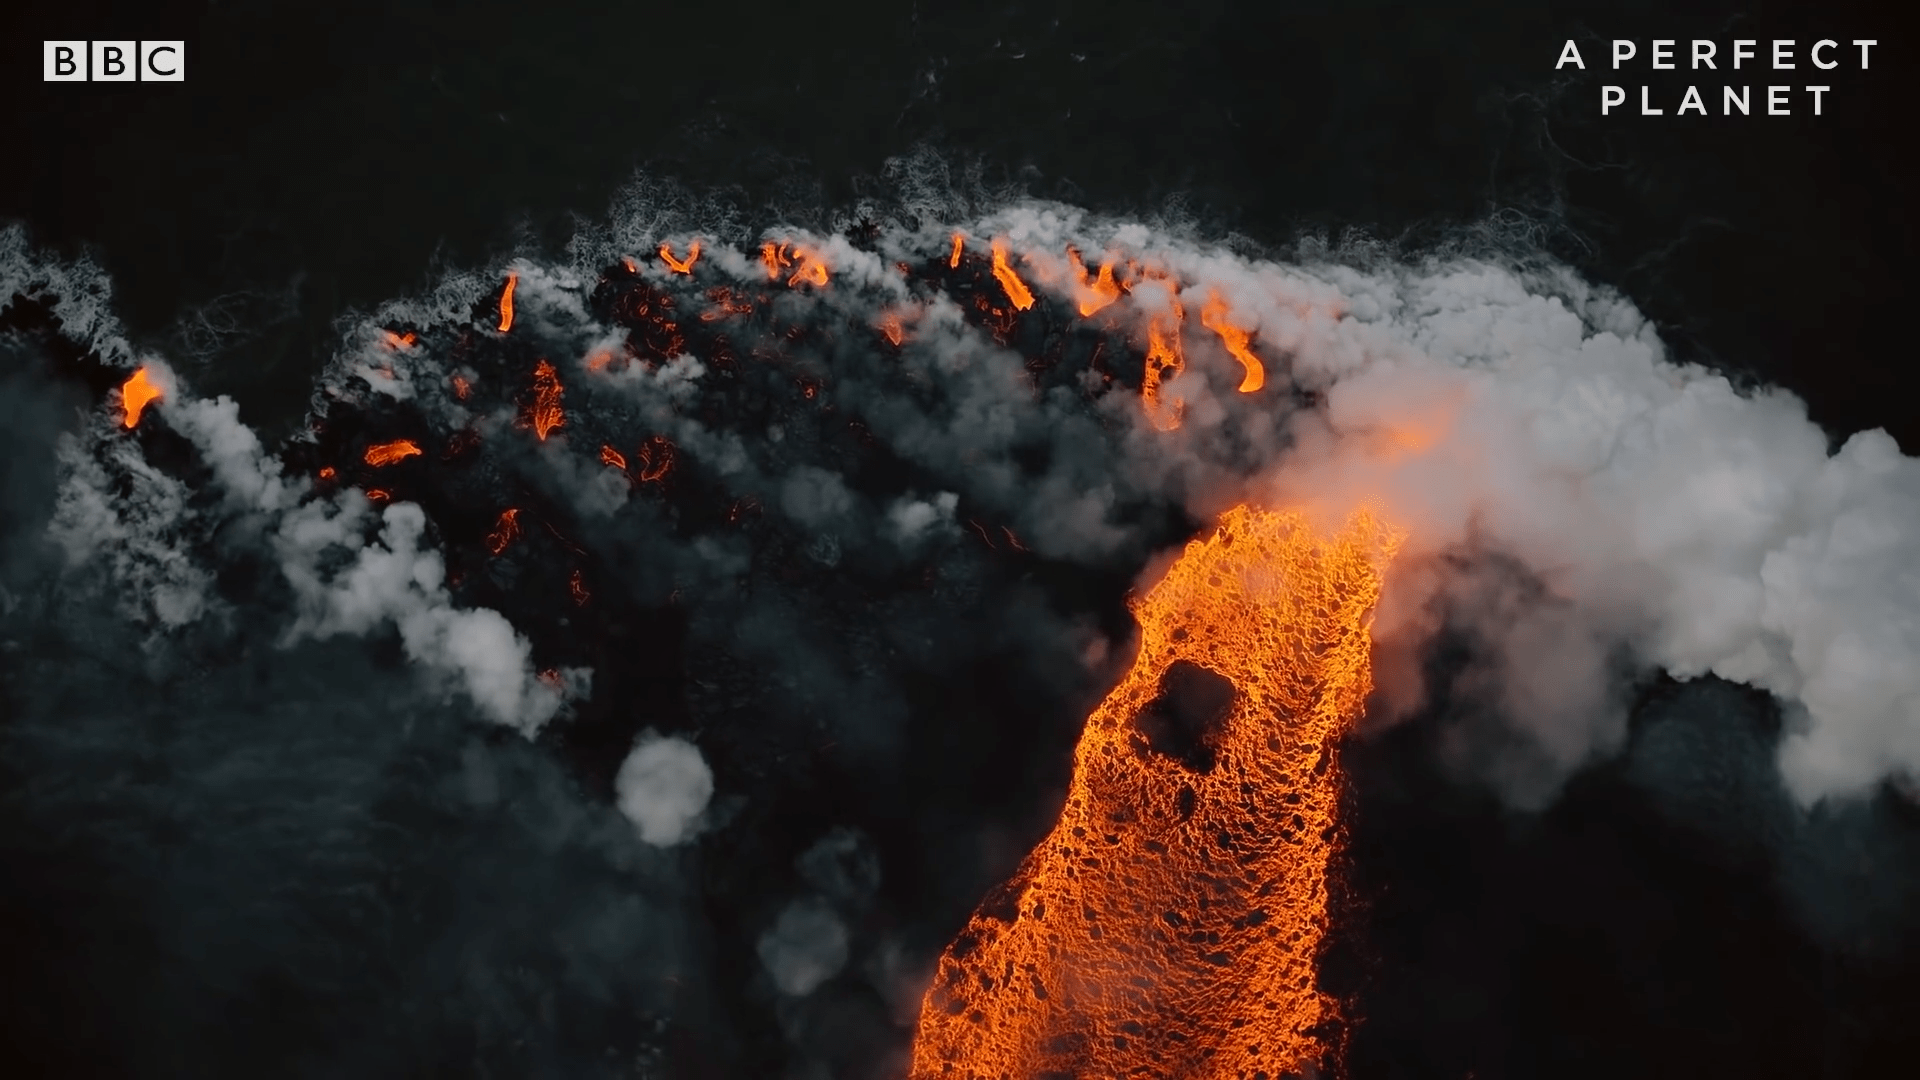
    Kilauea’s 2018 eruption gave us some of the most stunning volcanic footage ever seen, a tradition carried on in this BBC footage. As powerful and destructive as lava is, it’s also critical to life as we know it here on Earth. Volcanoes are a piece of the tectonic activity on our planet that drives the carbon cycle, without which we’d have no oceans or breathable atmosphere. It’s tough to imagine the geological scales over which these cycles act, but fortunately, there are numerical simulations to help! (Image and video credit: BBC Earth)

  • Albedo Effect

    Albedo Effect

    Temperature isn’t the only factor that determines how ice will melt. In this photo, a dark oak leaf absorbed more solar radiation than the reflective ice around it, causing the ice beneath it to melt. Scientifically, this effect is described by albedo; darker, more absorptive surfaces like the leaf have a lower albedo, whereas light, reflective ice and snow have a high albedo and can better resist melting on sunny days. (Image credit: K. James; submitted by Kam-Yung Soh)

  • Shedding Light on Martian Dust Storms

    Shedding Light on Martian Dust Storms

    In 2018, Mars was enveloped by a global dust storm that lasted for months. Although such storms had been seen before, the 2018 storm offered an unprecedented opportunity for observation from five orbiting spacecraft and two operating landers. As researchers comb through that data, they’re gaining new insights into the mechanisms that drive these extreme events.

    At NASA Ames, a team of researchers used observations of dust columns as input to a simulation of Mars’ global climate, then watched as the digital storm unfolded. Simulations like these have an important advantage over observations: the simulations allow scientists to track the transport of dust from one region to another.

    That dust tracking is critical for some of the team’s results. They found feedback patterns between dust lifting and deposition in different regions. For example, early in the storm dust was largely supplied from the Arabia/Sabaea regions, but once that dust was deposited in the Tharsis region, it kicked off a massive lifting event from Tharsis that put twice as much dust into the atmosphere as had landed there. Later, dust deposited back in Arabia by the Tharsis lofting generated new dust uplifts. As long as more dust got lifted than deposited, the intense storms continued. (Image credits: NASA, T. Bertrand/A. Kling/NASA Ames; research credit: T. Bertrand et al.; see also JGR Planets and AGU; submitted by Kam-Yung Soh)