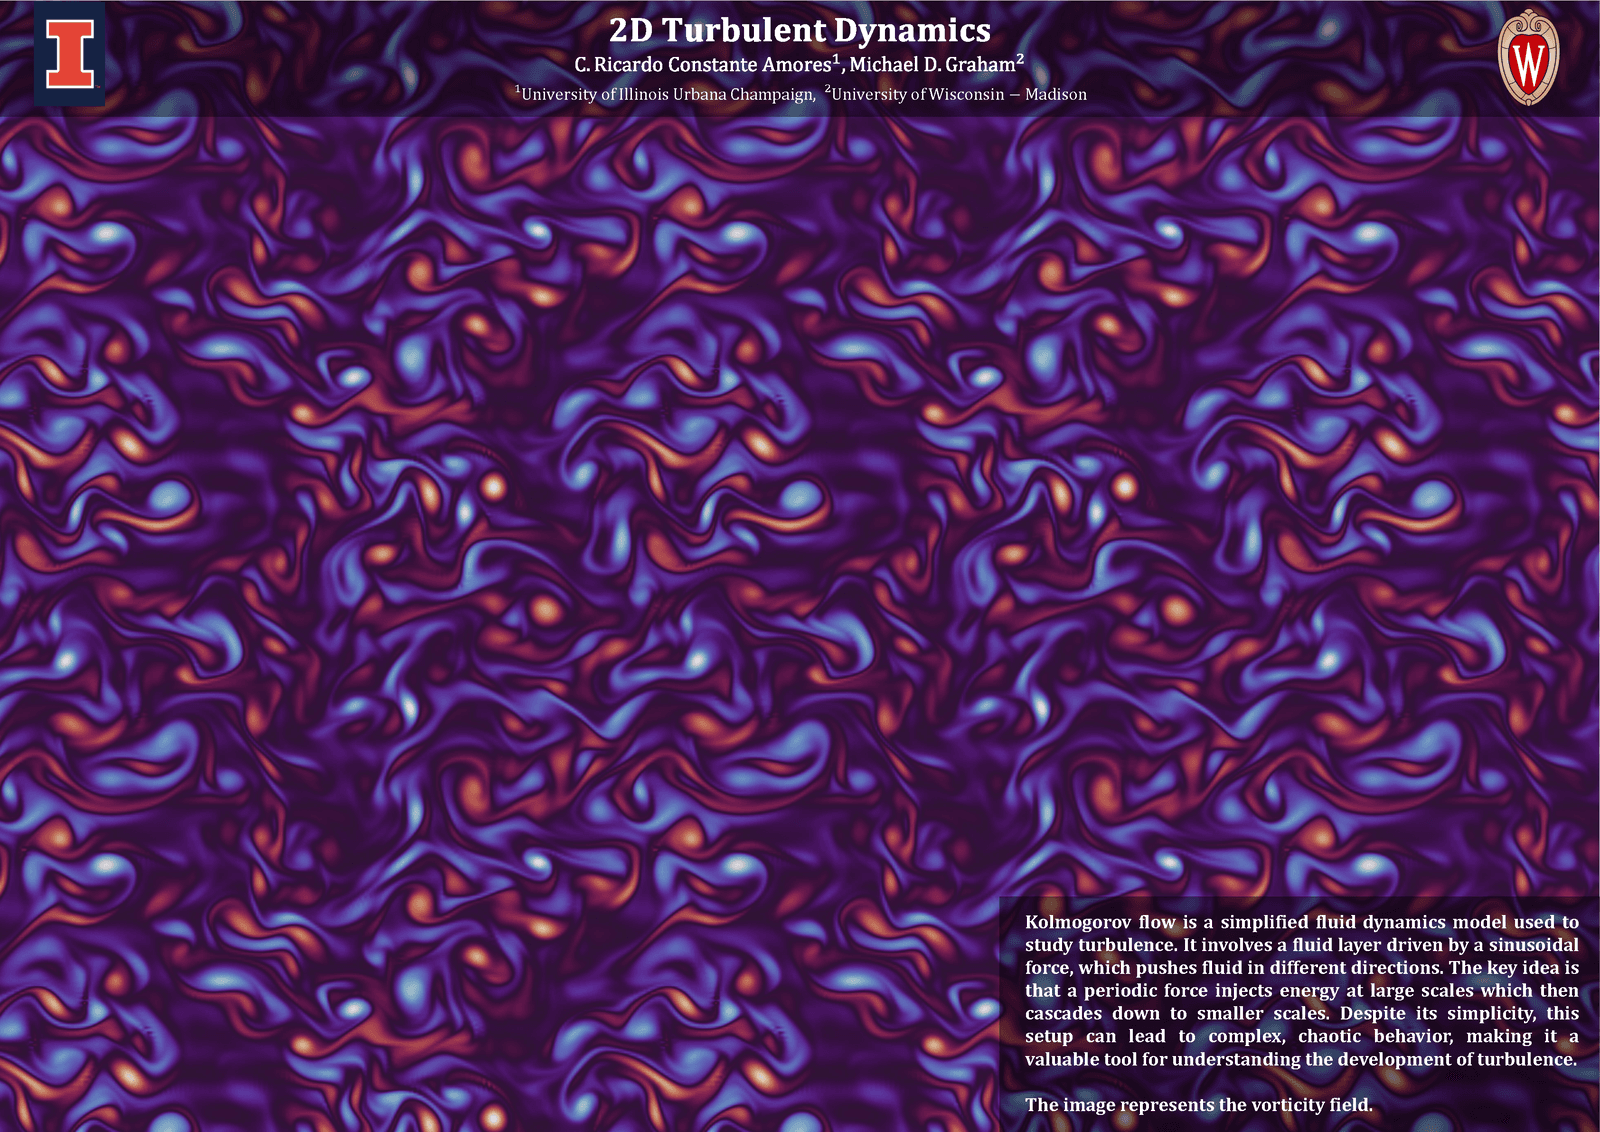
Turbulent flows are ubiquitous, but they’re also mindbogglingly complex: ever-changing in both time and space across length scales both large and small. To try to unravel this complexity, scientists use simplified model problems. One such simplification is Kolmogorov flow: an imaginary flow where the fluid is forced back and forth sinusoidally. This large-scale forcing puts energy into the flow that cascades down to smaller length scales through the turbulent energy cascade. Here, researchers depict a numerical simulation of a turbulent Kolmogorov flow. The colors represent the flow’s vorticity field. Notice how your eye can pick out both tiny eddies and larger clusters in the flow; those patterns reflect the multi-scale nature of turbulence. (Image credit: C. Amores and M. Graham)
Tag: physics

“Trinity”


Inspired by the film Oppenheimer, artist Thomas Blanchard created “Trinity,” a short film imagining a nuclear explosion with macro-scale fluid motion. There’s clever video editing and compositing in this video, but no CGI. Instead, Blanchard filmed fire, sparklers, alcohol inks, pigments and more up close and in stunning detail. As always, his work is a reminder of the amazing possibilities of analog-based art. (Video and image credit: T. Blanchard)

Baseball’s Mysterious Rubbing Mud
Since 1938, every ball in Major League Baseball has been covered in a special “rubbing mud” harvested from a secret location in New Jersey. Although the league has tried in the past to replace the mud with an alternative, it’s never stuck. Researchers wondered just what makes this mud so special, so naturally, they brought some to the lab to study its composition and rheology.
The mud consists of clay, silt, and sand with a smattering of organic particles. The make-up was pretty typical of river mud in the region, although researchers noted a drop-off in large particle sizes that probably indicates some sieving. In terms of rheology, the mud is shear-thinning, meaning it behaves a bit like lotion. It sits solidly in the hand until it’s deformed, at which point it smoothly coats the surface as a liquid would.
So how does the mud change the baseballs? The researchers found three effects. First, the mud’s shear-thinning allowed it to fill in any pores or imperfections in the ball’s surface, creating a more uniform surface. Second, the dried mud’s residue doubled the ball’s contact adhesion. And, finally, the occasional large sand particles glued to the ball by the dried mud added friction. As the researchers put it, the rubbing mud “spreads like skin cream and grips like sandpaper.” (Image credit: L. Juarez; research credit: S. Pradeep et al.; via EOS)
Fediverse Reactions
-
How Sunflowers Follow the Sun


Sunflower blossoms face east, presenting their blooms to the morning sun and the bees that come exploring with it. But before they grow their massive flower, each plant spends the day following the sun, greeting it in the east and tracking it westward all day. Overnight, the plant reorients eastward to start over again. The motion occurs thanks to the plant internally shifting its water supply. During the day, it swells cells on the east-facing side of the plant, gradually lengthening that side and causing the plant to tip westward. At night, it switches to swelling the west-facing side. Why go to all this trouble? By following the sun, the plant is able to photosynthesize and grow more effectively. (Video and image credit: Deep Look)

Sunflower plants follow the sun during the day and reset overnight. Fediverse Reactions
-

Cooking Perfect Cacio e Pepe
In cooking, sometimes the simplest recipes are the toughest to master. Cacio e pepe — a classic three-ingredient Italian pasta — is an excellent example. Made properly, the sauce of cheese and black pepper combines with starchy water to coat the pasta in a uniform, cheesy sauce. Or, if you’re me, you wind up with a pasta sauce flecked with stringy clumps of melted cheese. Fortunately for those of us who have yet to master this one, a new research paper has us covered with tips to make the perfect cacio e pepe.
The key to that elusive silky sauce, they found, is the starch – water – cheese combination. Your water needs just the right amount of starch — they found that between 1 – 4% starch by (cheese) mass worked. If the starch concentration is too low (which can easily happen in pasta water), you’ll get the clumpy cheese mess that so frequently happens in my kitchen. Temperature is also critical; if the water is too hot when it’s added, then it can destabilize the sauce. Check out the pre-print’s Section V for the scientific, supposedly foolproof, recipe. I know I’ll be trying it! (Image credit: O. Kadaksoo; research credit: G. Bartolucci et al. pre-print; via APS News)
Fediverse Reactions
-
Bubbly Tornadoes Aspin
Rotating flows are full of delightful surprises. Here, the folks at the UCLA SpinLab demonstrate the power a little buoyancy has to liven up a flow. Their backdrop is a spinning tank of water; it’s been spinning long enough that it’s in what’s known as solid body rotation, meaning that the water in the tank moves as if it’s one big spinning object. To demonstrate this, they drop some plastic tracers into the water. These just drop to the floor of the tank without fluttering, showing that there’s no swirling going on in the tank. Then they add Alka-Seltzer tablets.
As the tablets dissolve, they release a stream of bubbles, which, thank to buoyancy, rise. As the bubbles rise, they drag the surrounding water with them. That motion, in turn, pulls water in from the surroundings to replace what’s moving upward. That incoming water has trace amounts of vorticity (largely due to the influence of friction near the tank’s bottom). As that vorticity moves inward, it speeds up to conserve angular momentum. This is, as the video notes, the same as a figure skater’s spin speeding up when she pulls in her arms. The result: a beautiful, spiraling bubble-filled vortex. (Video and image credit: UCLA SpinLab)
Fediverse Reactions
-
“One”


A 4-minute, unedited one-shot video of colorful paint sliding down a sheet? Yes, please.
Beautiful visuals aside, there are some really interesting physics involved here. It’s unclear whether the there’s any change in the speed at which paint gets deposited at the top of the incline over the course of the video, yet we see huge changes in the visual patterns. This happens, in part, because the layer of paint is getting thicker and heavier over time, changing the dynamics of its slide under gravity. There may even be some shear-thinning going on, given that paint is usually non-Newtonian. I can imagine some connections to landslides, avalanches, and other gravity currents with non-Newtonian fluids. (Video and image credit: R. De Giuli)
Visualizing Unstable Flames


Inside a combustion chamber, temperature fluctuations can cause sound waves that also disrupt the flow, in turn. This is called a thermoacoustic instability. In this video, researchers explore this process by watching how flames move down a tube. The flame fronts begin in an even curve that flattens out and then develops waves like those on a vibrating pool. Those waves grow bigger and bigger until the flame goes completely turbulent. Visually, it’s mesmerizing. Mathematically, it’s a lovely example of parametric resonance, where the flame’s instability is fed by system’s natural harmonics. (Video and image credit: J. Delfin et al.; research credit: J. Delfin et al. 1, 2)
Fediverse Reactions
-
Why Nature Loves Fractals


Trees, blood vessels, and rivers all follow branching patterns that make their pieces look very similar to their whole. We call this repeating, self-similar shape a fractal, and this Be Smart video explores why these branching patterns are so common, both in living and non-living systems. For trees, packing a large, leafy surface area onto the smallest amount of wood makes sense; the tree needs plenty of solar energy (and water and carbon dioxide) to photosynthesize, and it has to be efficient about how much it grows to get that energy. Similarly, our lungs and blood vessels need to pack a lot of surface area into a small space to support the diffusion that lets us move oxygen and waste through our bodies. Non-living systems, like the branches of viscous fingers or river deltas or the branching of cracks and lightning, rely on different physics but wind up with the same patterns because they, too, have to balance forces that scale with surface area and ones that scale with volume. (Video and image credit: Be Smart)
Fediverse Reactions
-
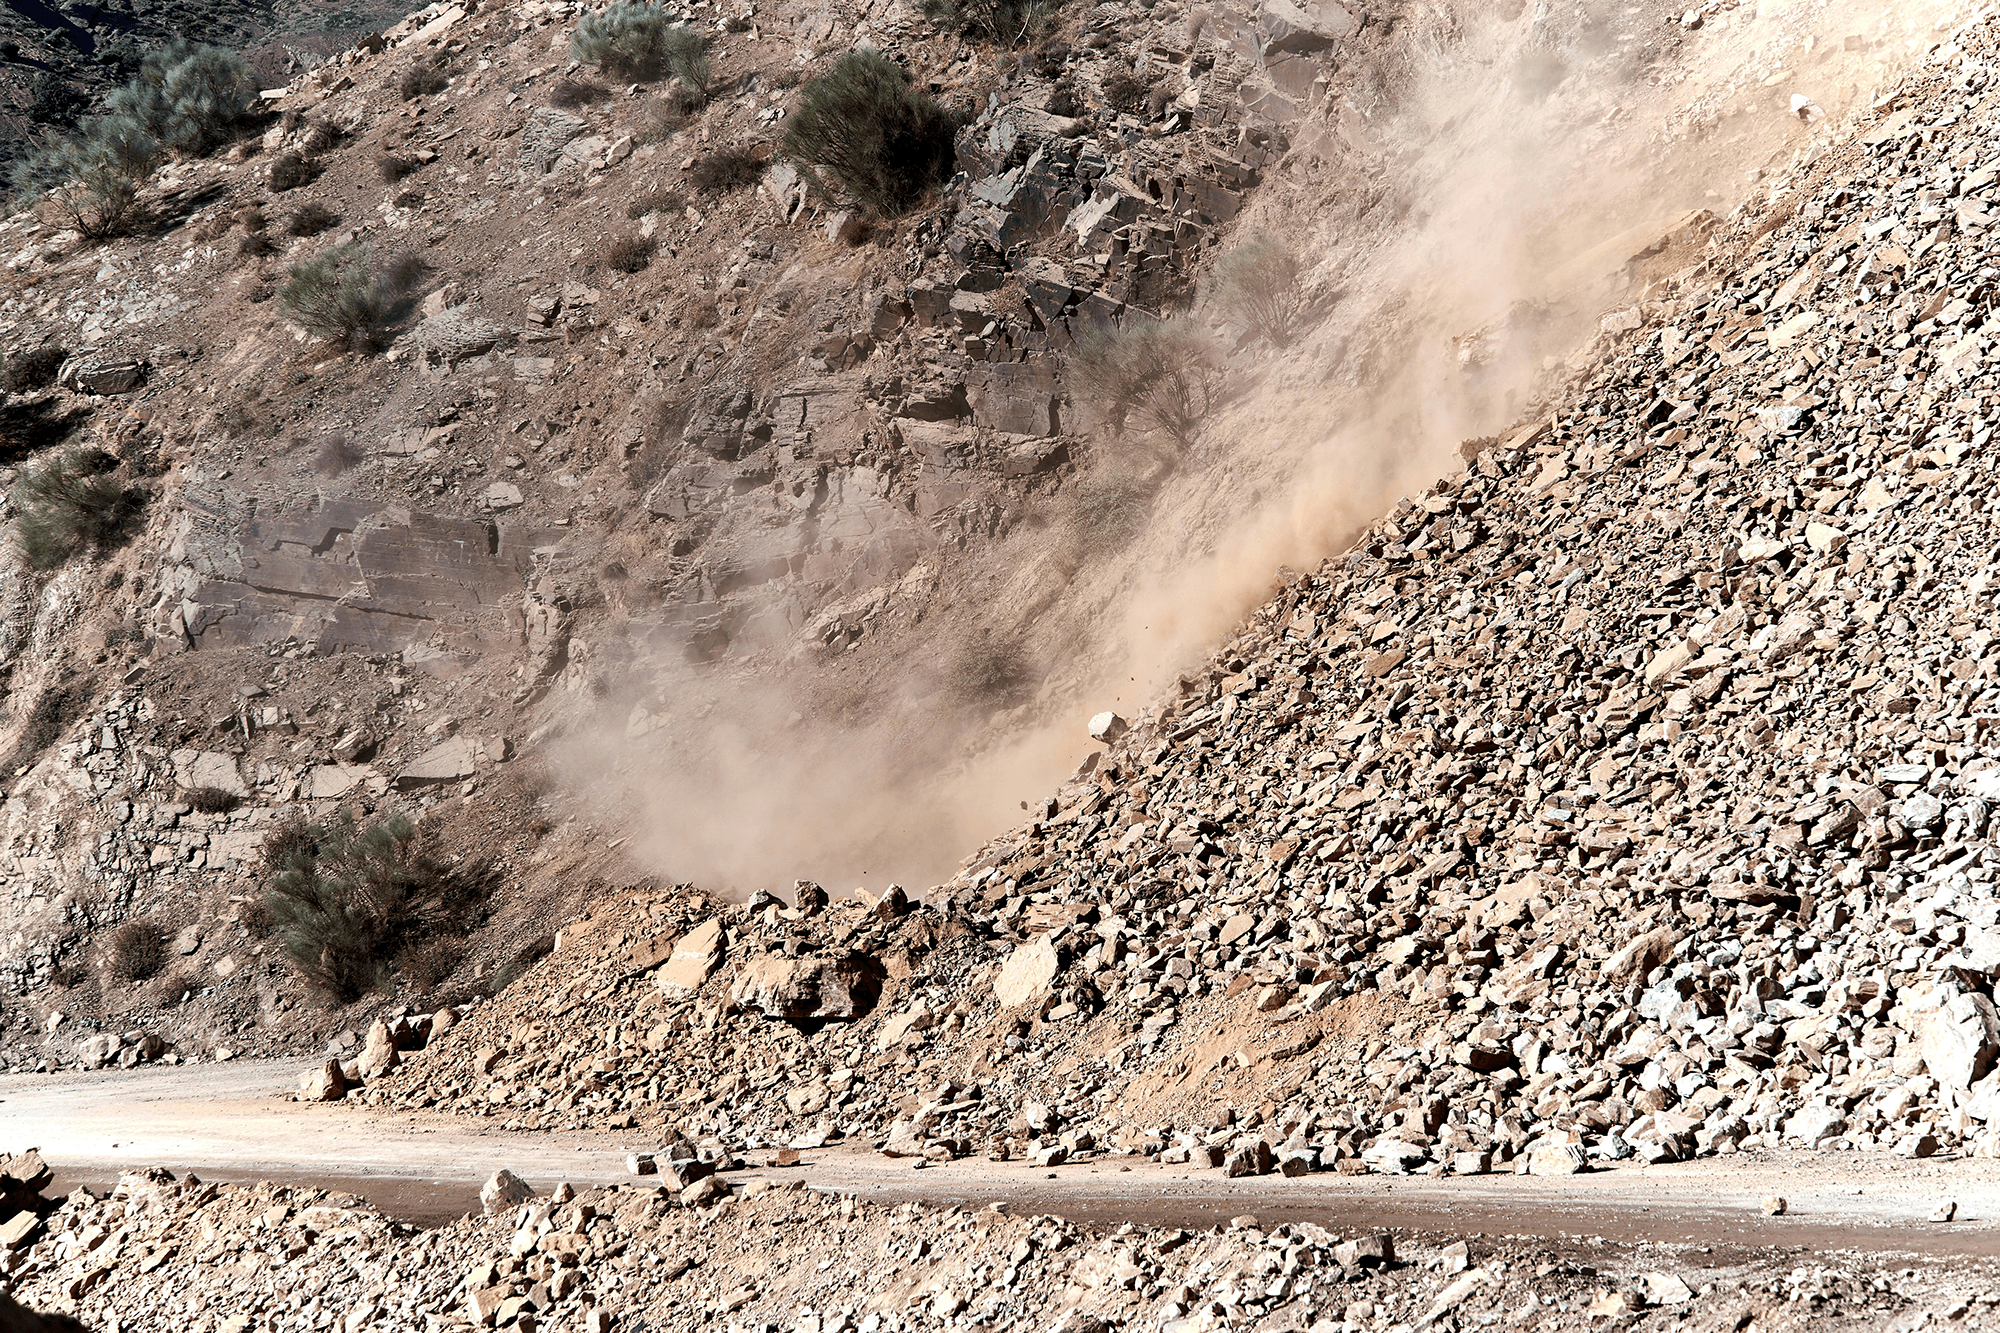
Predicting Landslide Speeds
Knowing what speed a landslide will reach helps us predict how much damage they can cause. That speed depends on many factors: the steepness of the terrain, the sliding distance, the thickness of the flowing layer, and the type of grains making up the flow. Researchers found that predictions from previous studies often underestimated the speeds reached by thicker flows. Through laboratory experiments with grains of different shapes, a team found that those models mistakenly assumed a fully-developed flow — in other words, one where the grains have reached a constant final speed. While spherical grains reach that state over a short sliding distance, that’s not the case for other grains.
Instead, the team used their results to build a new predictive model for landslide speeds. This one still depends on incline angle and flow thickness, but it also uses a dynamical friction coefficient to describe the granular material and capture how the flow’s speed varies with distance down the incline. (Image credit: W. Hasselmann; research credit: Y. Wu et al.; via APS News)
Fediverse Reactions
-