Nothing showcases the incredible power of our atmosphere like storms, and no one does stormchase photography like Mike Olbinski. In this vignette, he shows a stunning line of supercells caught near sunset on July 17, 2022. The high shear–combined with the setting sun–put on an incredible show. Dust blown up in a haboob, microbursts and downpours in the distance, and lots of churning, roiling turbulence. (Video and image credit: M. Olbinski)
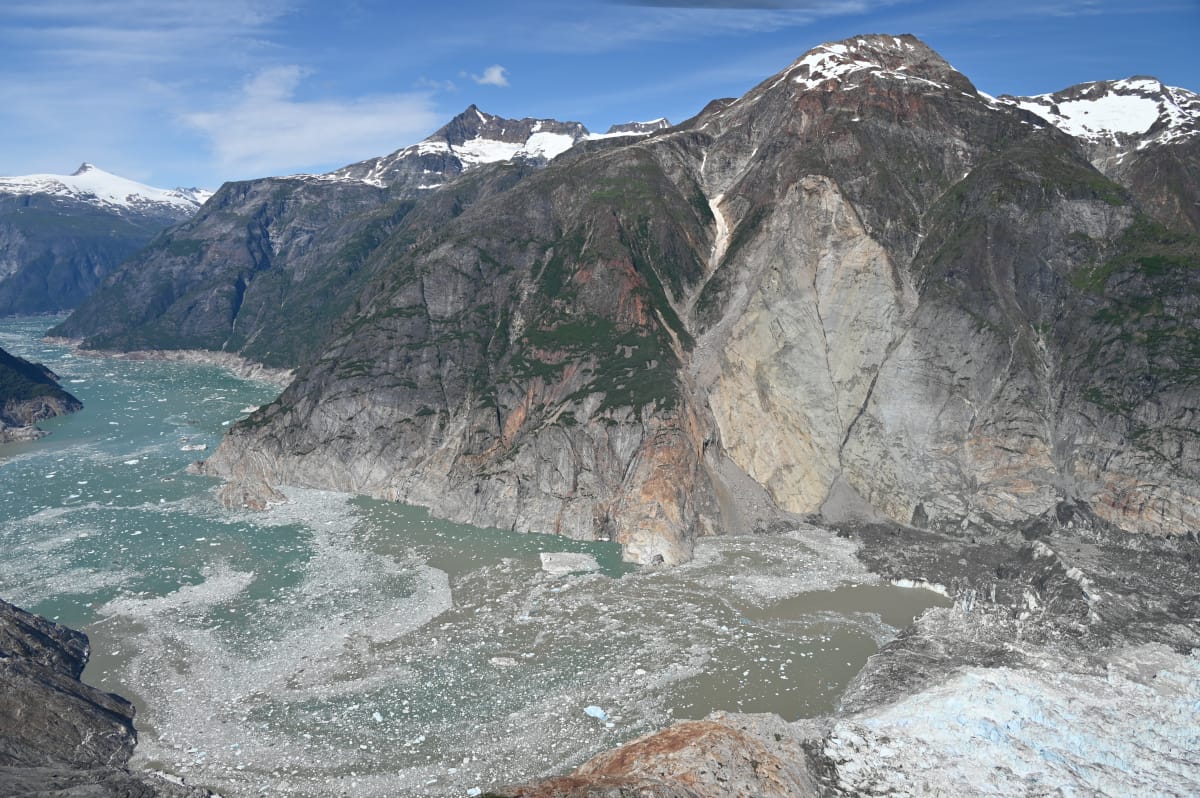
On 10 August 2025, the slopes of Alaska’s Tracy Arm Fjord gave way, sliding into the water. The resulting tsunami was the second-largest ever recorded, with a 481-meter runup after a 100-meter initial wave that moved at more than 70 meters per second. The fjord was fortunately empty at the time, though it is regularly visited by cruise ships. After the landslide, a seiche ricocheted through the fjord for 36 hours.
With no earthquake to trigger the tsunami, researchers had to piece together the accident through forensics. Their study concluded that the glacier’s retreat had left unstable slopes exposed, likening it to a child’s closet overstuffed with hastily gathered toys. The moment the door is no longer held closed, everything comes crashing out.
Ultimately, the landslide-induced tsunami is, therefore, a result of climate change. That result is disconcerting, given the increasing frequency of cruise ships visiting glacial fjords. Unlike earthquake-induced tsunamis, landslide-induced ones like the Tracy Arm event don’t come with a seismic warning. With rapid climate change and frequent tourism, risk management is critical. (Image credit: C. Read/USGS; research credit: D. Shugar et al.; via Eos)
An image showing the aftermath of the 10 August, 2025 landslide in Alaska’s Tracy Arm Fjord, which caused the second largest tsunami recorded. The light rock slope shows where material fell from. On the lower right, the foot of the South Sawyer Glacier is just visible.
Insect flight is vastly different than the aerodynamics engineers learn around aircraft. That’s particularly apparent looking at these tiny moths taking off and flying in slow motion. Almost every feature seems, at first glance, aerodynamically wasteful. Hairy, scaly surfaces instead of smooth ones? Relatively small wings for their body size? Moths break our engineering intuition.
For moths, flight is an inherently unsteady process. Every stroke of its wings cups and flings fluid away in an effort to generate enough lift to stay aloft. Notice how the wings flex with each stroke. Part of the moth’s efficiency comes from that flexibility, even though keeping wings relatively stiff is the norm for engineering larger fixed-wing craft. And those hairy surfaces? Not only can they help camouflage insects; they keep them hydrophobic so that water bounces off them. (Video and image credit: Ant Lab/A. Smith)
Coffee is a key ingredient in the scientific process for many researchers, so it’s no wonder that researchers often develop an interest in the drink’s physics and chemistry. In a new study, a research team devised an objective method to test both a coffee’s strength and its roast color.
The researchers used a potentiostat to test how an electric current interacted with the brewed coffee and showed how the measurements related to the coffee’s flavor. The method was even robust enough that they could identify which coffee sample came from a batch of beans that had failed a roaster’s quality controls.
While you’re unlikely to use such a method at home, it could be helpful in coffee shops, where baristas try to pin down the variables to produce the same flavor in every cup. (Image credit: M. Kenneally; research credit: R. Bumbaugh et al.; via Ars Technica)
NASA’s Ingenuity helicopter was the first aircraft humanity has flown on another planet, and engineers are looking to make the next generation of Martian helicopters bigger and more capable. That’s challenging in Mars‘ thin atmosphere, which is only 1% as dense as Earth’s. To get adequate lift, the rotors need to spin faster there.
During Ingenuity’s mission, the team intentionally designed the craft to keep the rotor tips below supersonic speeds. But for the next mission–SkyFall–they’re looking to push the rotorcraft further. In recent tests in a Mars simulator chamber, they successfully spun the new rotors to tip speeds as high as Mach 1.08, significantly increasing the loads SkyFall could carry. (Image and video credit: NASA/JPL-Caltech; via Ars Technica)
Artist Thomas Blanchard likes to create wild visuals from a mixture of mundane ingredients like ink, soap, oils, and ferrofluids. In this latest video, he’s mixed chemical reactions and physical phenomena into something reminiscent of a god’s eye staring across time and space, creation and destruction. (Video and image credit: T. Blanchard)
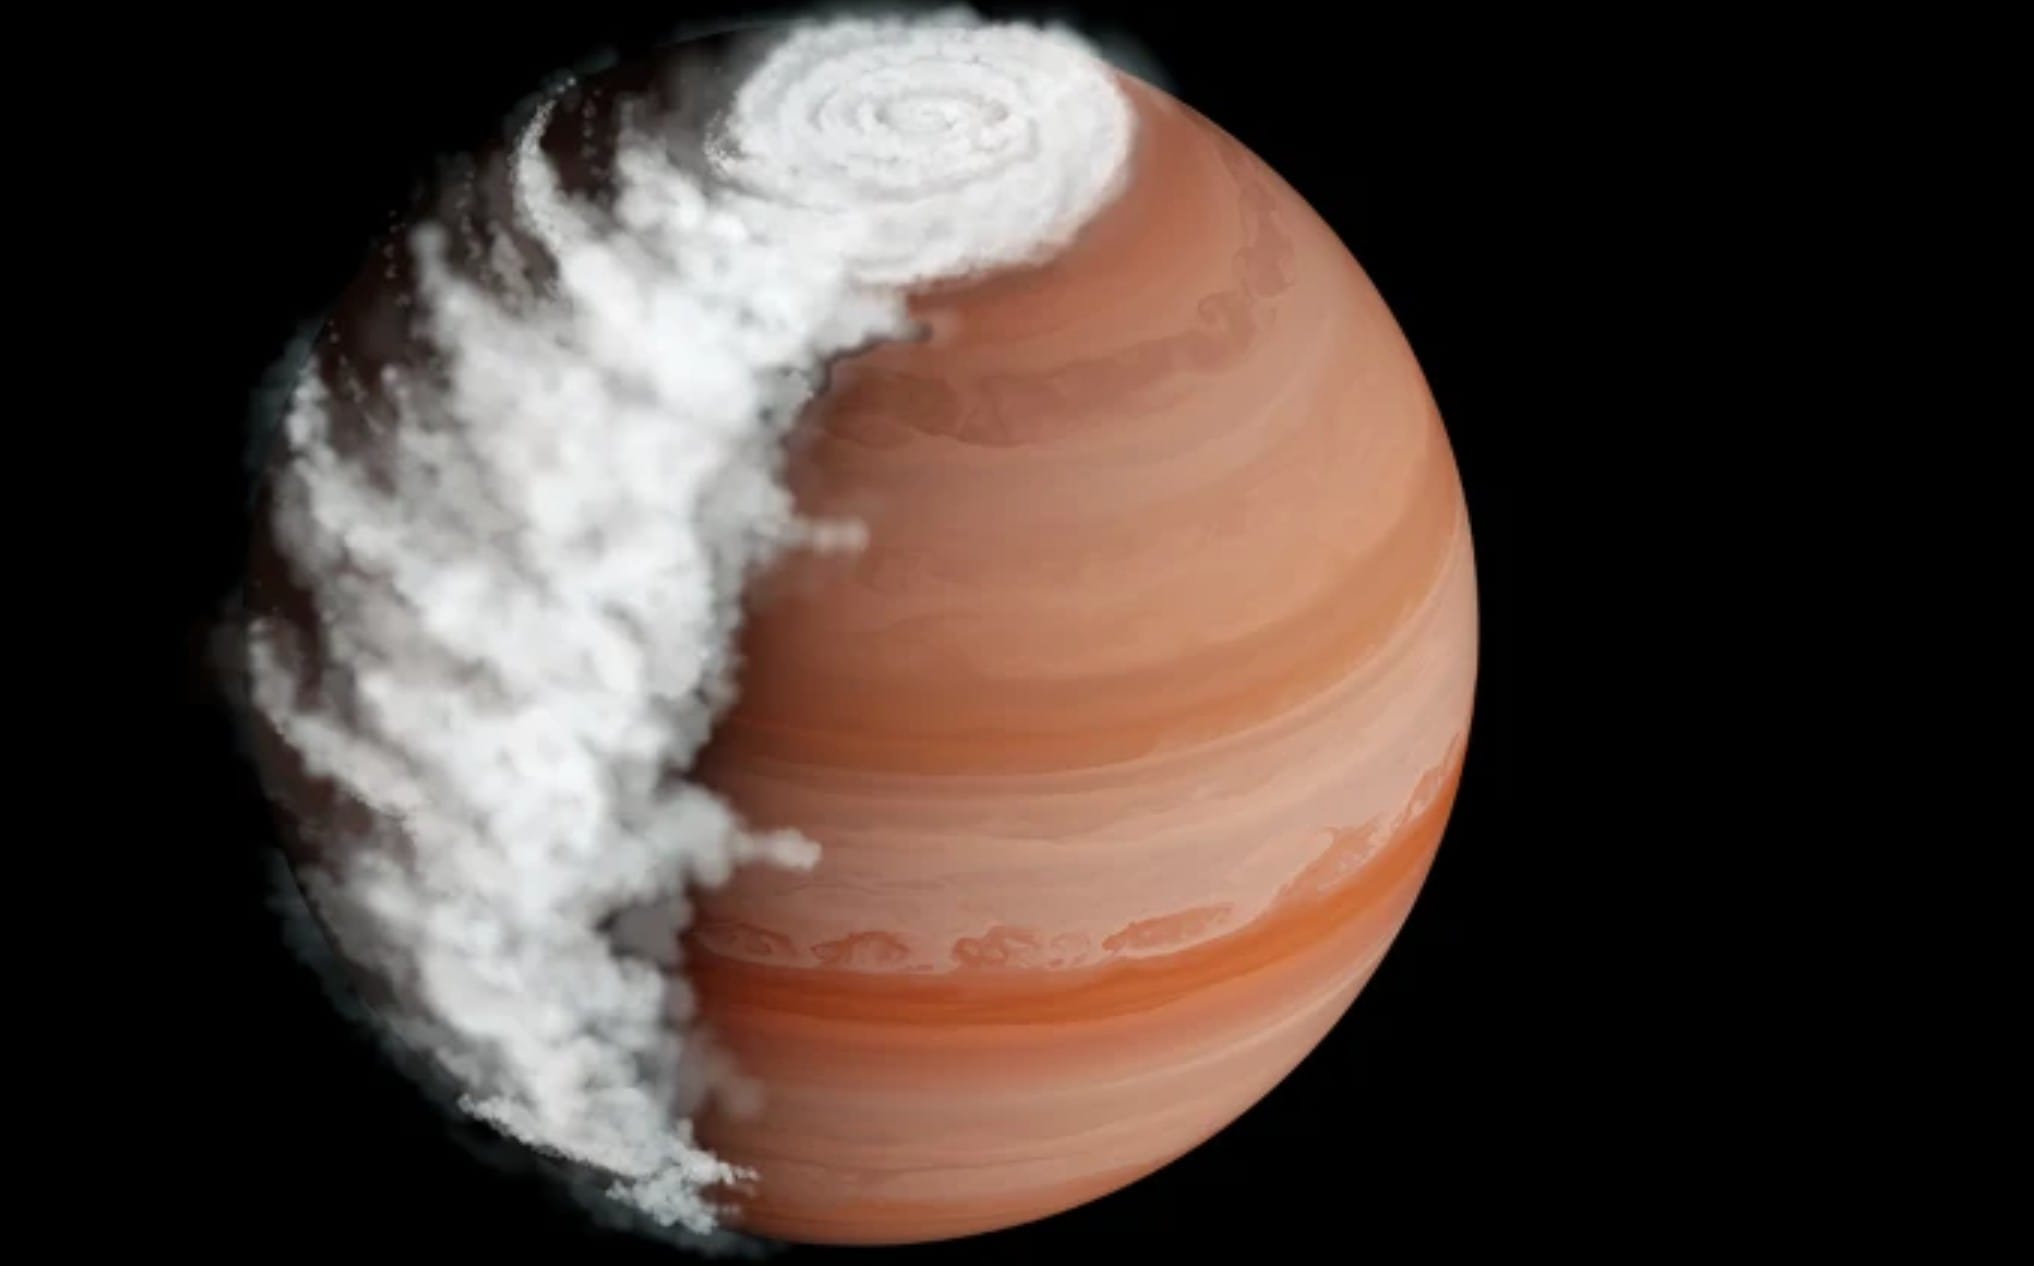
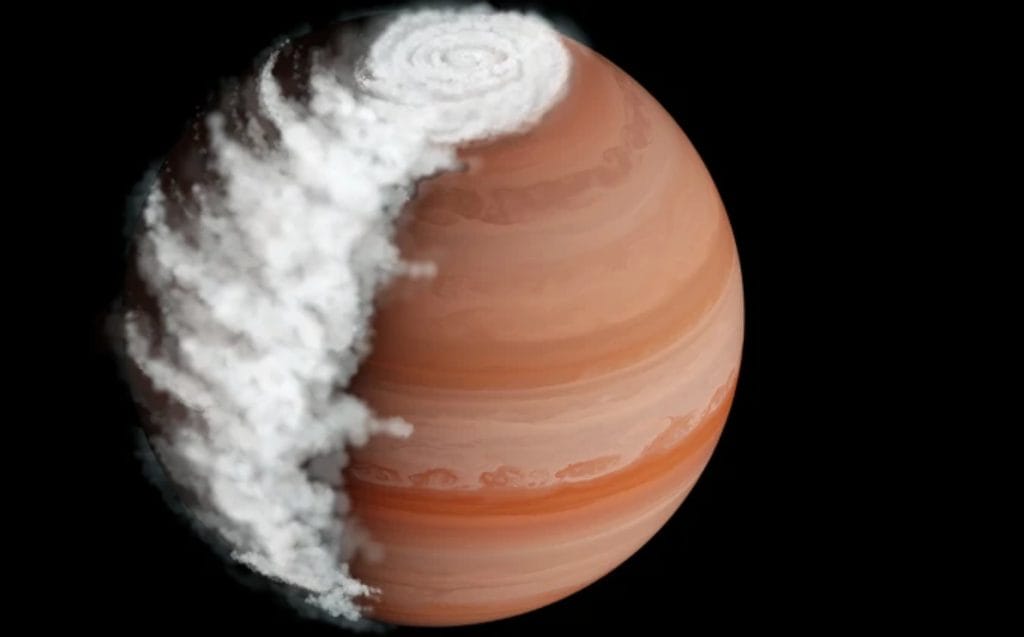
In the past few decades, our knowledge of exoplanets has exploded, but we’re still relatively limited in what we can learn about these worlds. That’s due, in large part, to the indirect way we observe them. Most exoplanets are found when we see them transit, passing between Earth and their star. During a transit, the planet blocks a portion of the light we would otherwise detect from the star, letting us know that something’s there. We’re often able to measure the spectra of light passing through the exoplanet’s atmosphere, giving us a glimpse of chemical signatures.
Today’s study looks at exoplanet WASP-94A b, a gas giant tidally-locked so that only one side ever faces its star. In its transit, researchers could clearly measure different spectra from the morning and evening sides of the planet. The asymmetry seems to indicate that the exoplanet develops thick clouds on the nightside, which then dissipate during the daytime. (Image credit: H. Robbins/JHU; research credit: S. Mukherjee et al.; via Nature)
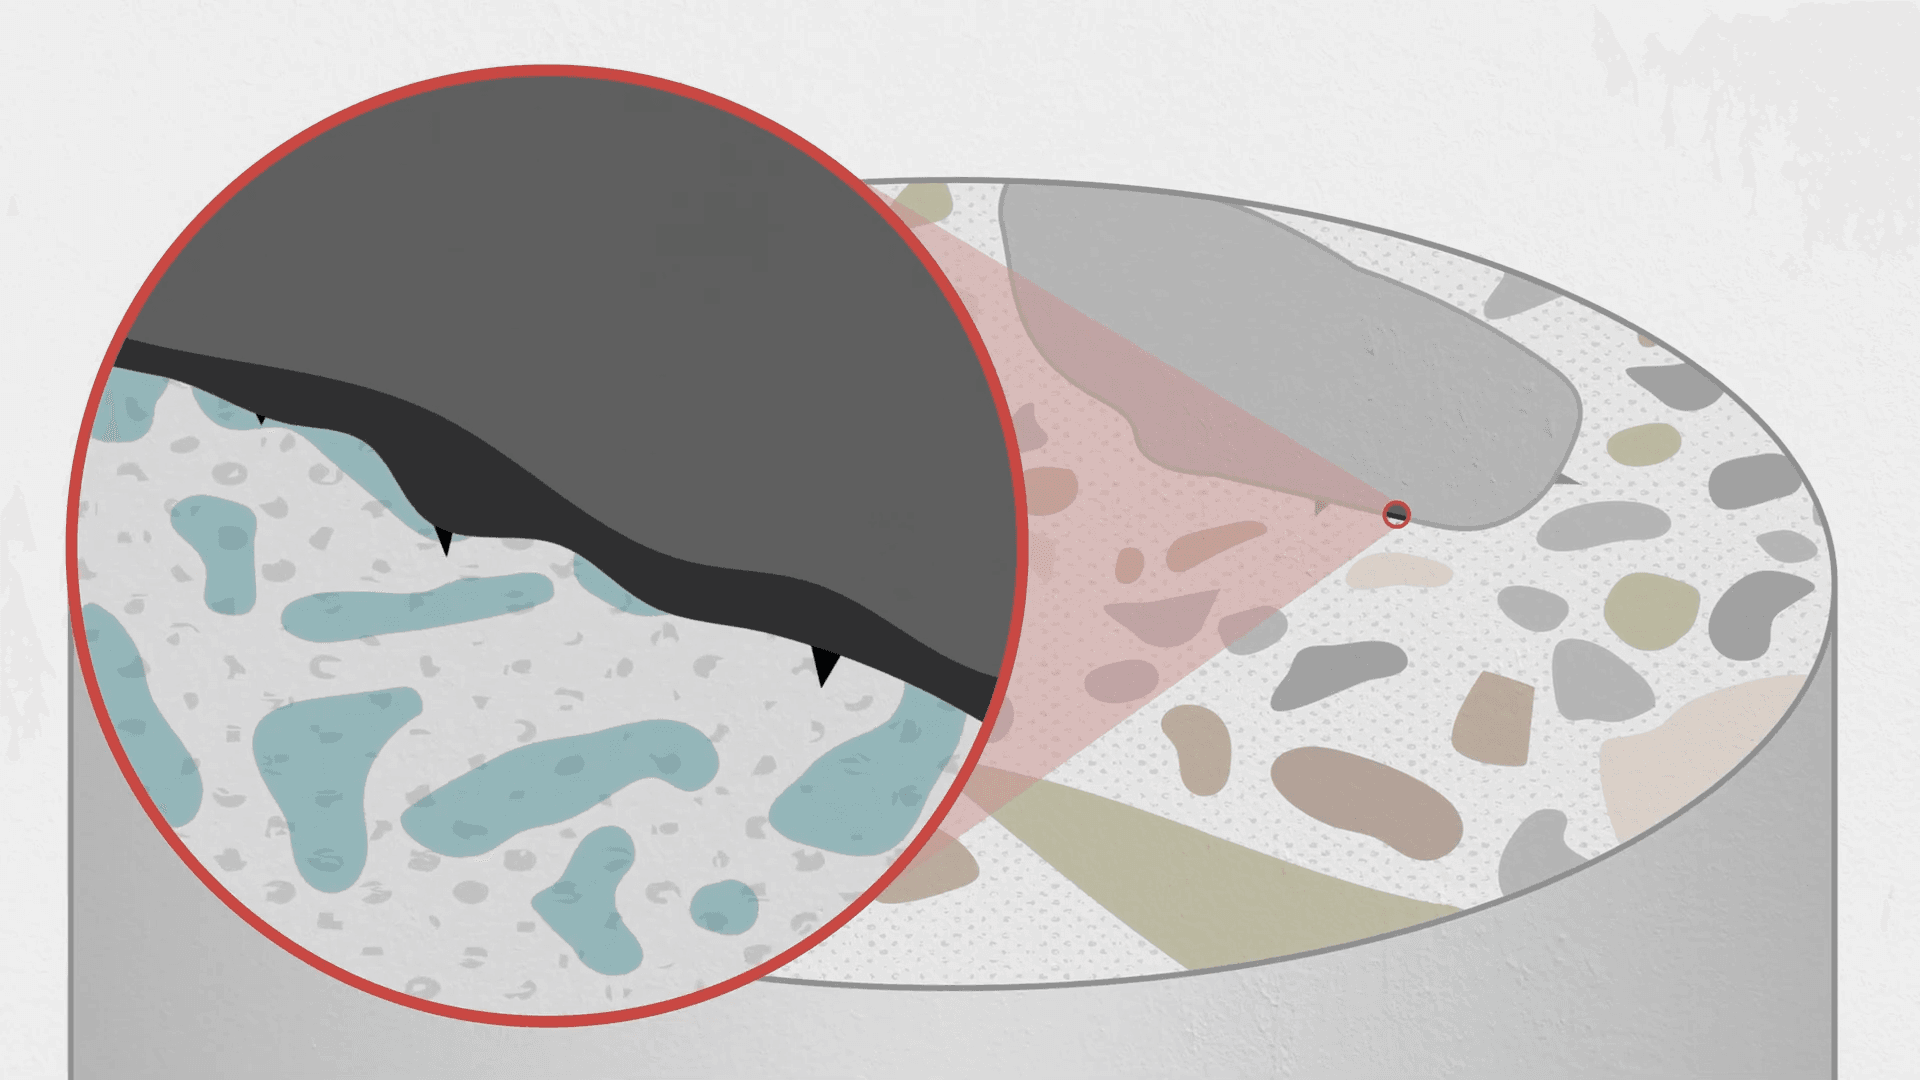
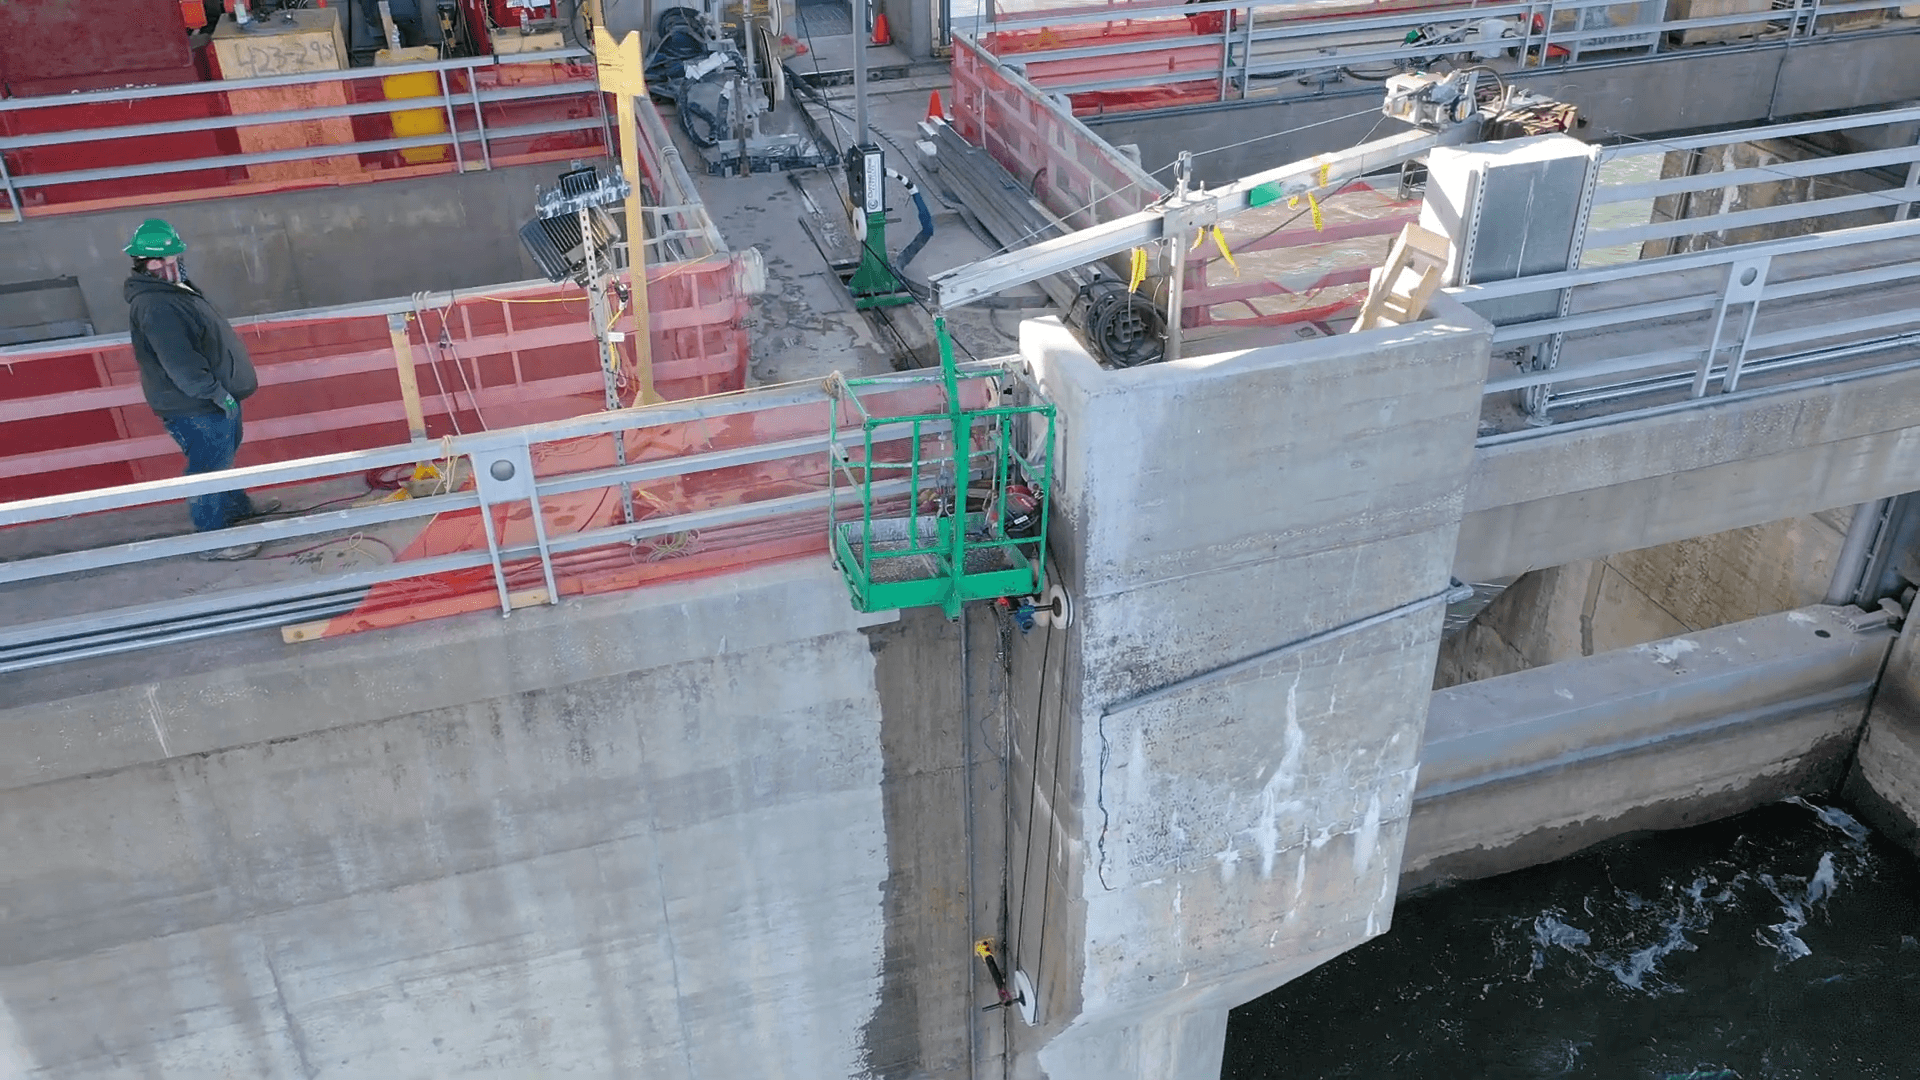
The concrete that makes up so much of our world is usually local in origin. To keep costs low, engineers use locally-sourced ingredients to make it. But not all ingredients perform the same.
In the decades since concrete’s widespread adoption, engineers have discovered that some components in the concrete are prone to chemical reactions that cause the concrete to expand over time. For big infrastructure projects like a mid-twentieth century dam, this sparks a conundrum: how can we deal with expanding concrete without losing out on years of the project’s planned lifetime?
To find out, see what Grady learned about the Tennessee Valley Authority’s clever method for relieving a dam’s stress. (Video and image credit: Practical Engineering)
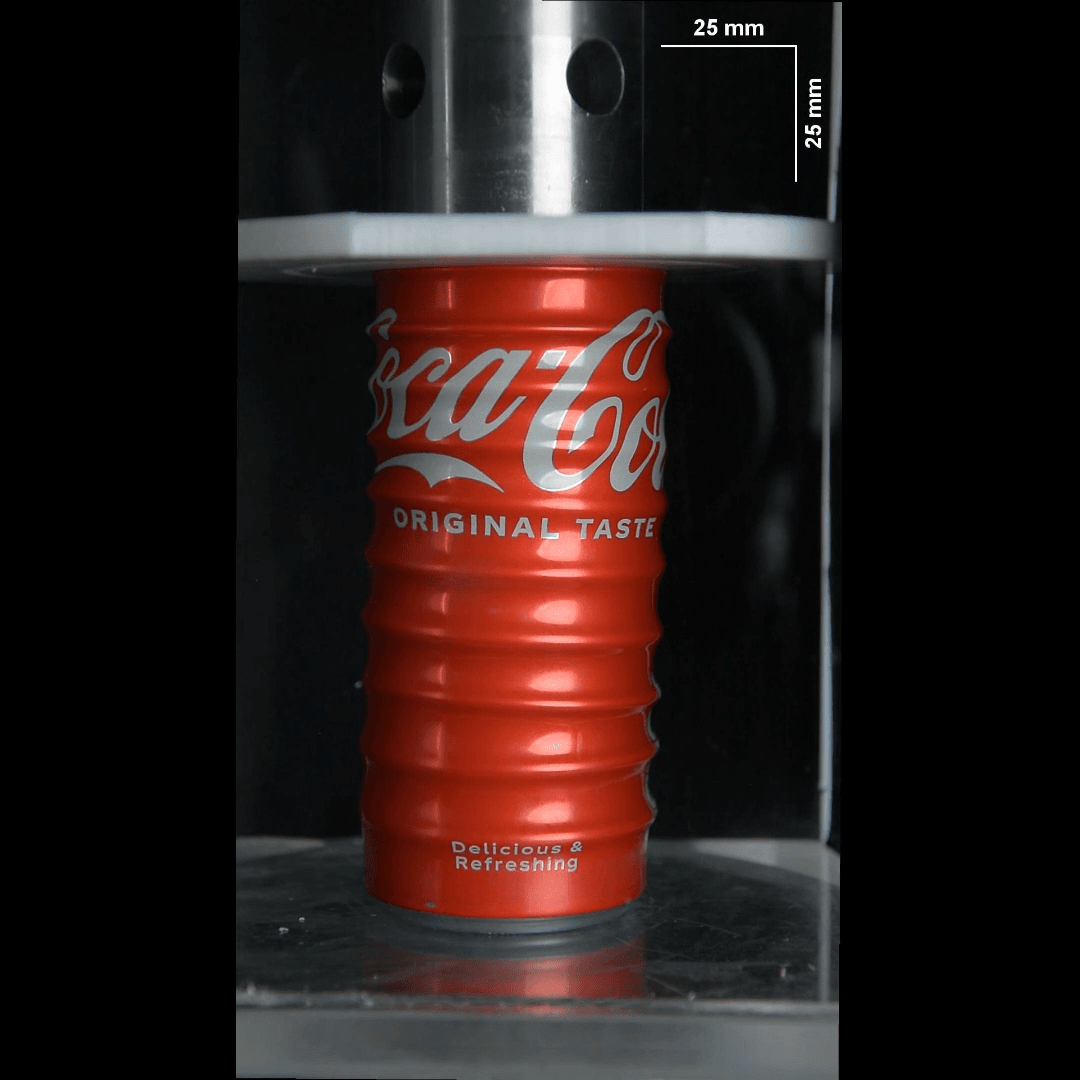
From oil drums to–yes–soda cans, liquid-filled cylindrical shells are everywhere. And, it turns out, these structures fail differently than empty shells or ones filled with a solid. Liquid-filled cylinders buckle in sequential rings, as seen in the video below. Researchers found that the buckling resulted from the shell softening and re-stiffening under the compressive load–repeating that process over and over for each ring. Their findings could help us detect containers that are in danger of failing. (Video, image, and research credit: S. Jain et al.; via Ars Technica)
Animation of a liquid-filled cylindrical shell buckling sequentially under compression.
Ocean sprays, coughs, and sneezes are just a few of the ways that droplets full of bacteria and salt can get aloft on a breeze. How do these bacteria stay viable even as their droplet evaporates? That’s the question behind this video’s research.
When a bacteria-laden droplet or a salt-laden droplet dries, the evaporating droplet’s contact area shrinks, leaving behind only a concentrated lump of bacteria or salt. But when droplets contain both salt and bacteria, the drying droplet’s contact line gets pinned, leaving a larger area stain. The bacteria’s presence seems to promote crystallization of the salt, which–in turn–traps water in isolated spaces, perhaps helping the bacteria stay viable longer. (Video and image credit: R. Ran et al.)
Animation of three droplets drying out. When all three components–water, salt, and bacteria–are in a droplet, the drying process looks very different.


 water with bacteria; 2) water with salt; and 3) water with bacteria and salt. Text reads, \"However, droplets containing both salt and bacteria exhibit striking drying dynamics.\"")