Tag: eddies

  • Featured Video Play Icon

    Colorful Dissipation

    Colorful eddies swirl in this short video from photographer Karl Gaff. Formed near the boundary at the bottom of the frame, these eddies act to dissipate some of the energy in the flow. Structures like these are key in turbulent flows, where energy must pass from large eddies to smaller and smaller ones until they reach a size where viscosity can extinguish them. (Video, image, and submission credit: K. Gaff)

    P.S. – Today’s post is FYFD’s 2,500th! Crazy, right? That means we have a pretty enormous archive. Want to explore? Click here for a random post.

  • Ice Rings Caused By Underlying Eddies

    Ice Rings Caused By Underlying Eddies

    Observations of strange ice rings on Lake Baikal, the world’s deepest lake, have puzzled scientists for decades. Surveys of satellite imagery have revealed rings on Baikal and two other lakes dating back to the 1960s and some of our earliest satellite images. The rings are roughly 5-7 km in diameter, with a dark layer of thin ice about 1 km wide around a brighter layer of thick ice.

    A new study, buoyed in part by on-the-ground observations during Siberian winter, argues that the ice rings observed on the surface are related to eddies of warmer water circulating below. The researchers were able to capture several eddies in their measurements, including one migratory one. The size, shape, and location of these sub-surface eddies are consistent with ice ring appearance. The kilometers’ wide eddies are several degrees warmer at shallow depths and rotate approximately once every 3 days.

    The researchers suspect the eddies form long before the ice does. Infrared observations in late autumn suggest the eddies form from a combination of wind and influx of river water into the lakes. Then, as ice does form, it’s affected by the underlying circulation. (Image credits: NASA, 1, 2; research credit: A. Kouraev et al.; via Gizmodo)

  • Featured Video Play Icon

    An Introduction to Turbulence

    With some help from Physics Girl and her friends, Grant Sanderson at 3Blue1Brown has a nice video introduction to turbulence, complete with neat homemade laser-sheet illuminations of turbulent flows. Grant explains some of the basics of what turbulence is (and isn’t) and gives viewers a look at the equations that govern flow – as befits a mathematics channel! 

    There’s also an introduction to Kolmogorov’s theorem, which, to date, has been one of the most successful theoretical approaches to understanding turbulence. It describes how energy is passed from large eddies in the flow to smaller ones, and it’s been tested extensively in the nearly 80 years since its first appearance. Just how well the theory holds, and what situations it breaks down in, are still topics of active research and debate. (Video and image credit: G. Sanderson/3Blue1Brown; submitted by Maria-Isabel C.)

  • Can Zooplankton Mix Oceans?

    Can Zooplankton Mix Oceans?

    Krill and other tiny marine zooplankton make daily migrations to and from the ocean surface. Previously, models of ocean mixing ignored these migrations; these animals are tiny, researchers argued, so any effects they could have would be too small to matter. But zooplankton make these migrations in huge swarms, and studies of a laboratory analog of their migrations (using brine shrimp rather than krill) reveal that, when moving en masse, these tiny swimmers create turbulent jets and eddies far larger than an individual. Their collective motion is enough to mix salty water layers 1000 times faster than molecular diffusion alone! Learn more in the latest FYFD video, embedded below. (Image and video credit: N. Sharp; research credit: I. Houghton et al.; h/t to Kam-Yung Soh)

  • Sedimentary Swirls

    Sedimentary Swirls

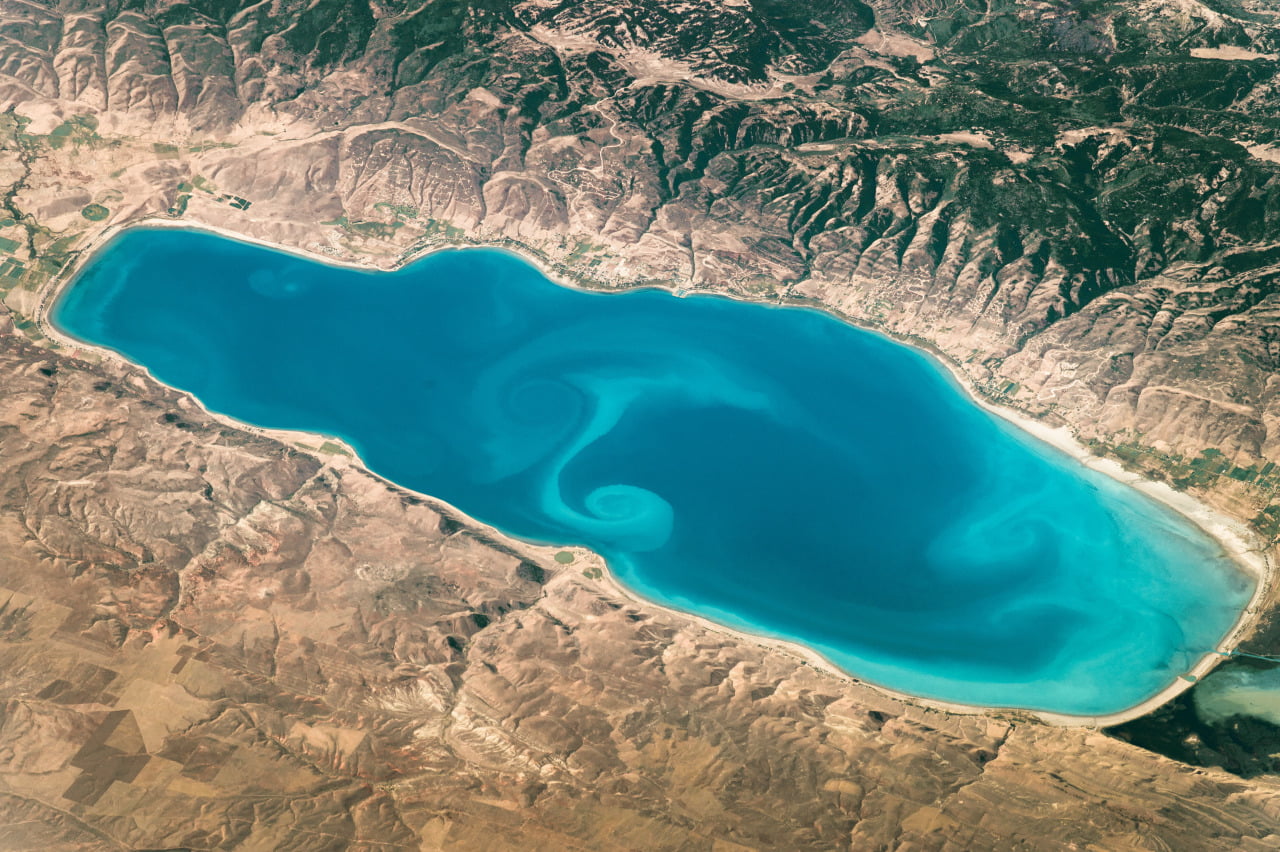
    Sediment swirls in Bear Lake caught the eye of an astronaut aboard the International Space Station last year. Bear Lake is situated in the Rocky Mountains, on the Idaho-Utah border. The eddies in the center of the lake are each about 3 km across and are likely the result of inflow from the lake’s tributaries. Silt and sediment picked up by the rivers and streams gets deposited into Bear Lake, revealing the turbulent mixing of tributary waters with those already in the lake. (Image credit: NASA; via NASA Earth Observatory)

  • Featured Video Play Icon

    Watching the Boundary Layer Go By

    In experiments, it can be difficult to track individual fluid structures as they flow downstream. Here researchers capture this spatial development by towing a 5-meter flat plate past a stationary camera while visualizing the boundary layer – the area close to the plate. The result is that we see turbulent eddies evolving as they advect downstream. Despite the complicated and seemingly chaotic flow field, the eye is able to pick out patterns and structure, like the merging of vortices that lifts eddies up into turbulent bulges and the entrainment of freestream fluid into the boundary layer as the eddies turn over or collapse. It is also a great demonstration of how the Reynolds number relates to the separation of scales in a turbulent flow. Notice how much richer the variety of length-scale is for the higher Reynolds number case and how thoroughly this mixes the boundary layer. (Video credit: J. H. Lee et al.)

  • Featured Video Play Icon

    Mixing the Southern Ocean

    Motion in the ocean is driven by many factors, including temperature, salinity, geography, and atmospheric interactions. While global currents dictate much of the large-scale motion, it’s sometimes the smaller scales that impact the climate. This visualization shows numerically simulated data from the Southern Ocean over the course of a year. The eddies that swirl off from the main currents are responsible for much of the mixing that occurs between areas of different temperature, which ultimately impacts large-scale temperature distributions, in this case affecting the flux of heat toward Antarctica. (Video credit: I. Rosso, A. Klocker, A. Hogg, S. Ramsden; submitted by S. Ramsden)

  • Featured Video Play Icon

    Visualizing Ocean Currents

    Researchers used computational models of ocean currents to produce this video visualizing worldwide ocean surface currents from June 2005 through December 2007. Dark patterns under the ocean are representative of ocean depths and have been exaggerated to 40x; land topography is exaggerated to 20x. Notice the wide variety of behaviors exhibited in the simulation: some regions experience strong recirculation and eddy production, while others remain relatively calm and unmoving. Occasionally strong currents sweep long lines across the open waters, carrying with them warmth and nutrients that encourage phytoplankton blooms and other forms of ocean life. (Video credit: NASA; submitted by Jason S)

  • Surf’s Up

    Surf’s Up

    Diffusion of ink in water + Lego minifigs = an awesome example of fluid mechanics as art. (Photo credit: Alberto Seveso; via io9; thanks to Jennifer for the link!)

  • Featured Video Play Icon

    Flow in Urban Areas

    While we typically think about boundary layers as a small region near the surface of an object–be it airplane, golf ball, or engine wall–boundary layers can be enormous, like the planetary boundary layer, the part of the atmosphere directly affected by the earth’s surface. Shown above is a flow visualization of the boundary layer in an urban area; note the models of buildings. In these atmospheric boundary layers, buildings, trees, and even mountains act like a random rough surface over which the air moves. This roughness drives the fluid to turbulent motion, clear here from the unsteadiness and intermittency of the boundary layer as well as the large variation in scale between the largest and smallest eddies and whorls. In the atmosphere, the difference in scale between the largest and smallest eddies can vary more than five orders of magnitude.