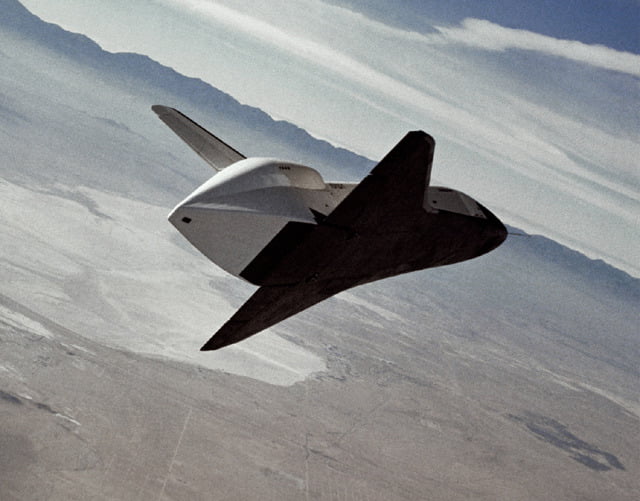
Wind tunnels are great, but there’s nothing like a flight test to learn about the aerodynamics of a new vehicle. Today in 1977, the space shuttle prototype Enterprise flew on its own for the first time. Enterprise was built purely to test the shuttle’s aerodynamic behavior during gliding and landing. Check out this video of one of Enterprise’s gliding and landing tests.
Search results for: “wind tunnel”
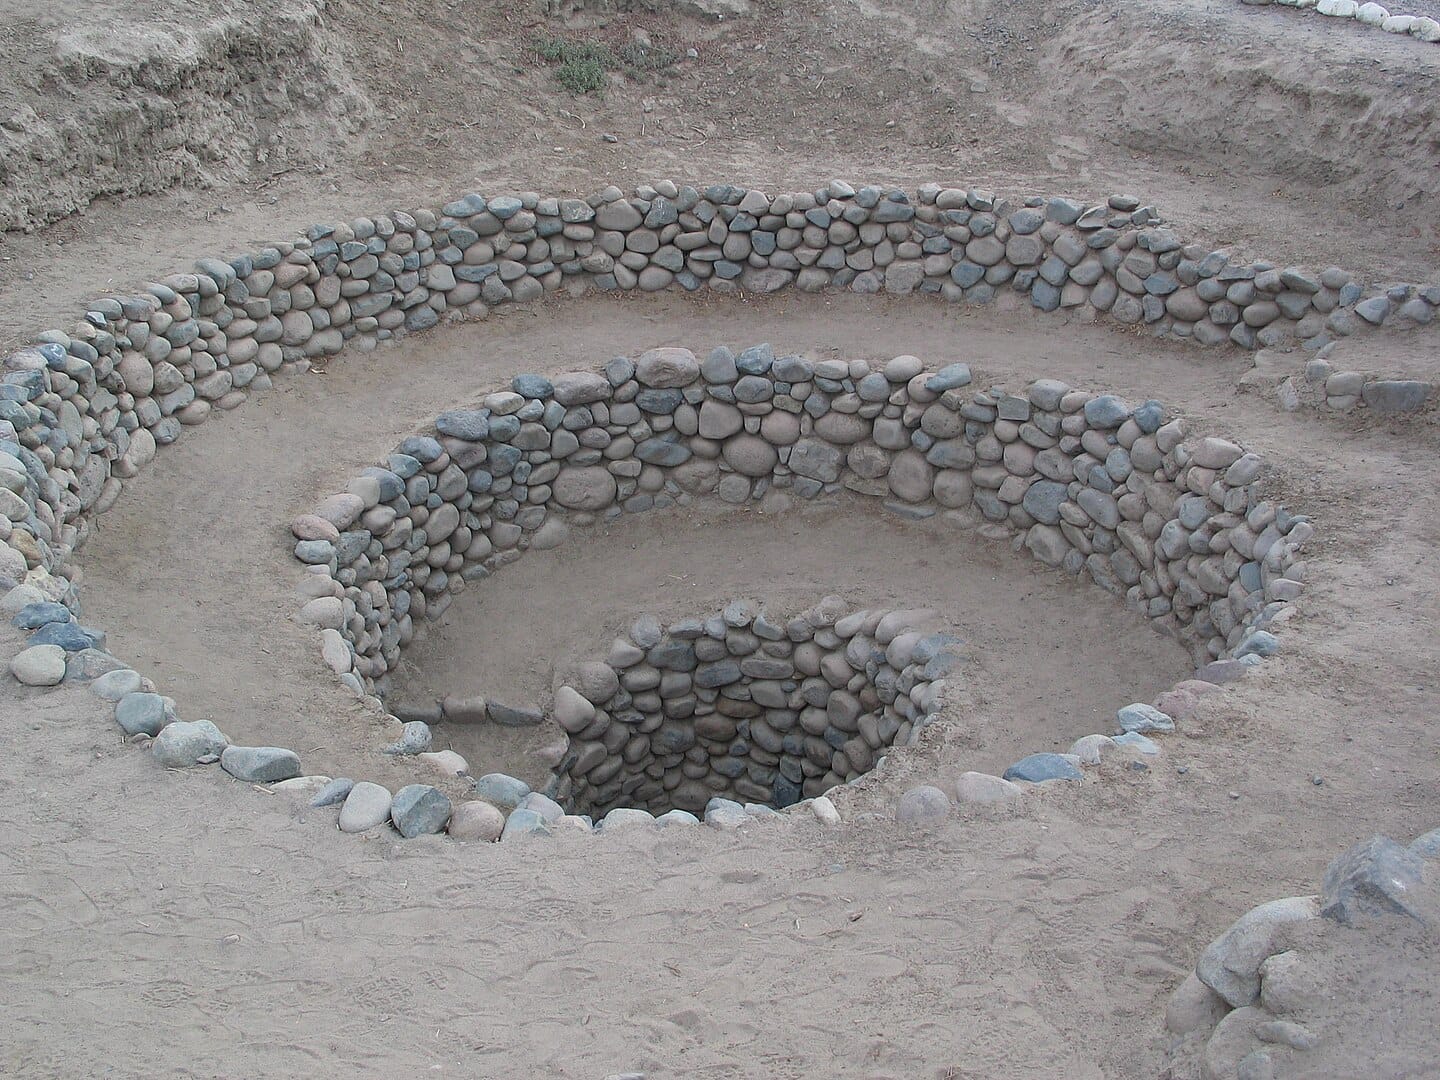
The Puquios System of Nazca
The arid Nazca region of Peru is dotted with spiral-shaped indentations, part of an irrigation system that helped indigenous civilizations thrive here before European contact. Although the region’s rainfall varies year-to-year, it never amounts to much. So pre-Columbian Nazcans turned instead to underground aquifers to gather and transport water.
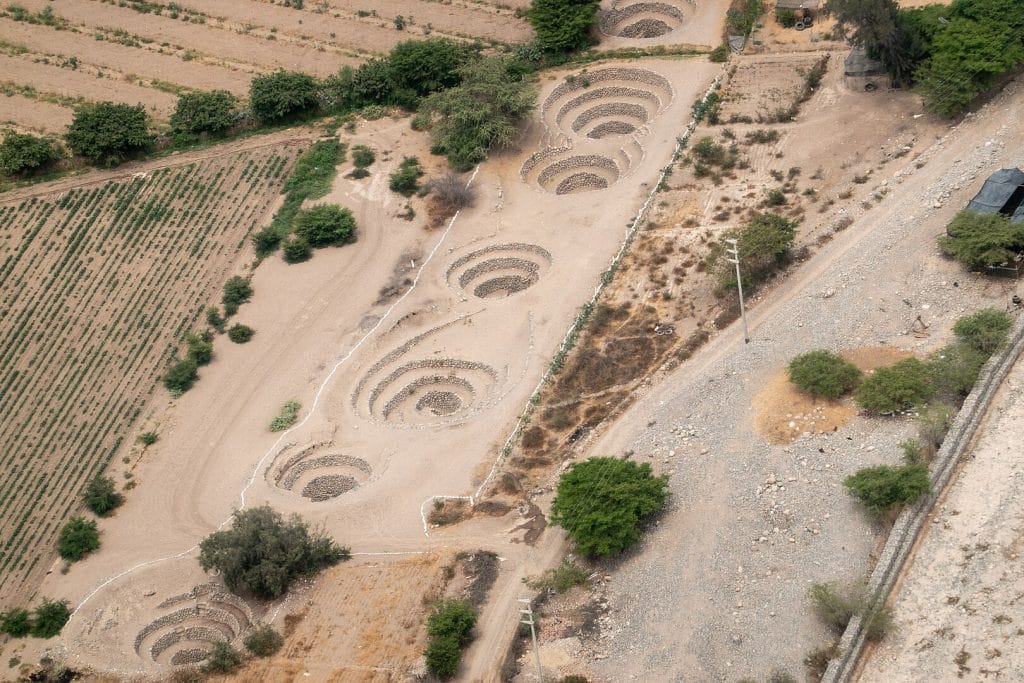
An aerial view of several puquois chimneys near Nazca, Peru. Aquifers in the region slope downward, following the local geology. Puquios builders began by digging a preliminary well in the highlands, tunneling down until they reached the aquifer. Then they built a horizontal tunnel underground, sloping gently downward, toward the location where water was needed. Along that roughly horizontal tunnel, they built additional chimneys, the spiraling mouths of which are seen above. These chimneys are thought to serve multiple purposes. They provide maintenance access to the aqueduct tunnel, and their shape may help funnel wind underground to oxygenate the water and help keep it flowing. Eventually, the underground tunnel would exit into an open trench and a reservoir, providing year-round water for irrigation and personal use.

Although the puquios cannot themselves be dated through usual archaeological means, the current consensus is that they originate from around 500 C.E., with subsequent modifications by both indigenous and colonial inhabitants. Impressively, several dozen puquios are still providing water today. (Image credits: Ab5602/Wikimedia, PsamatheM/Wikimedia, and R. Lasaponara et al.; research credit: R. Lasaponara et al.; via Eleanor K.)
Fediverse Reactions
-

Recreating Volcanic Lightning


Some natural phenomena, like volcanic eruptions or tornado formation, don’t lend themselves to fieldwork — at least not at the height of the action. The danger, unpredictability, and destructiveness of these environments is more than our equipment can survive. And so researchers find clever ways to recreate these phenomena in controllable ways. The latest example comes from a lab in Germany, where researchers are recreating volcanic lightning.
To do so, they heat and pressurize actual volcanic ash in an argon environment and let the mixture decompress into a jet, like a miniature eruption. The lightning that accompanies the jet is thought to depend on friction between ash particles, which build up electric charges when rubbed, just like a balloon rubbed against one’s hair. When the charges get large enough, lightning discharges the build-up.
Small-scale experiments like this one allow researchers to vary the temperature and water content of the ash and observe how this changes the lightning. Drier ash generates more lightning, but it’s hard to distinguish whether this is inherent to the ash or the result of the denser jets that form without the added eruptive force of steam. (Image credit: eruption – M. Szeglat, lab lightning – Sönke Stern/Ludwig-Maximilians-Universität München/Gizmodo; research credit: S. Stern et al.; via Gizmodo)

Pilot-Wave Hydrodynamics: Resources
This is the final post in a collaborative series with FYP on pilot-wave hydrodynamics. Previous posts: 1) Introduction; 2) Chladni patterns; 3) Faraday instability; 4) Walking droplets; 5) Droplet lattices; 6) Quantum double-slit experiments; 7) Hydro single- and double-slit experiments; 8) Quantum tunneling; 9) Hydrodynamic tunneling; 10) de Broglie’s pilot-wave theory
Thanks for joining us this week as we explored nearly two centuries’ worth of scientific discoveries around vibration, fluid dynamics, and quantum mechanics. For those who’d like to learn more about these and related topics, we’ve compiled some helpful resources below.
Other Videos, Articles, and Resources by Topic
Chladni Patterns
- ANSYS, “Chladni Plates”
- Brusspup, “Amazing Resonance Experiment!”
- Kenichi Kanazawa, “Color Sound”
- Microfluidic Chladni patterns
- Nigel Stanford, “Cymatics”
- Peter Remco, “Chladni patterns in a violin plate”
- Steve Mould, “Random couscous snaps into beautiful patterns”
Faraday Instability
- FYFD, Alligators and water dancing
- FYFD, Liquid crystals vibrating on a tuning fork
- Gallery of Fluid Motion, “The Tibetan singing bowl”
- Nigel Stanford, “Cymatics”
- Slow Mo Guys, “Chinese spouting bowl in slow motion.”
Quantum Mechanics
Pilot-wave Hydrodynamics
- Dual Walkers, learn about the physics from the researchers themselves
- Gallery of Fluid Motion, “The pilot-wave dynamics of walking droplets.”
- Gallery of Fluid Motion, “Shedding light on pilot-wave phenomena.”
- The Lutetium Project, “Never-ending bouncing droplets.”
- The Lutetium Project, “Dual walkers: drops and waves.”
- Through the Wormhole, Interview with Y. Couder
- Wired, “Have we been interpreting quantum mechanics wrong this whole time?”
- Veritasium, “Is this what quantum mechanics looks like?”
Selected (Academic) Bibliography by Topic
Articles marked with an asterisk (*) are recommended for their approachability and/or broad overview of the subject.
Chladni Patterns
- (*) M. Faraday, “On a peculiar class of acoustical figures; and on certain forms assumed by groups of particles upon vibrating elastic surfaces,” 1831.
- Lord Rayleigh, “On the circulation of air observed in Kundt’s tubes, and on some allied acoustical problems,” 1884.
- H. van Gerner et al., “Air-induced inverse Chladni pattern,” 2011.
Faraday Instability
- (*) M. Faraday, “On a peculiar class of acoustical figures; and on certain forms assumed by groups of particles upon vibrating elastic surfaces,” 1831.
Pilot-wave Hydrodynamics
- Y. Couder and E. Fort, “Single-particle diffraction and interference at a macroscopic scale,” 2006.
- A. Eddi et al., “Unpredictable tunnel of a classical wave-particle association,” 2009.
- (*) Y. Couder et al., “Walking droplets: A form of wave-particle duality at macroscopic scale?”, 2010.
- J. Molacek and J. Bush, “Droplets bouncing on a vibrating bath,” 2013.
- J. Molacek and J. Bush, “Droplets walking on a vibrating bath: toward a hydrodynamic pilot-wave theory,” 2013.
- D. Harris et al., “Wave-like statistics from pilot-wave dynamics in a circular corral,” 2013.
- O. Wind-Willassen et al., “Exotic states of bouncing and walking droplets,” 2013.
- (*) J. Bush, “Pilot-wave hydrodynamics,” 2015.
- D. Harris et al., “Visualization of hydrodynamic pilot-wave phenomena,” 2016.
(Image credit: A. Labuda and J. Belina)

Cycling Skinsuits and Vortex Generators


It didn’t take long for an aerodynamic controversy to crop up in this year’s Tour de France. At the 14km individual time trial, riders from Team Sky wore custom Castelli skinsuits with integrated dot-like patterns on their upper arms (shown above). By the next day, a sports scientist with a competing team cried foul play, claiming that these fabrics could have given Team Sky as much as 25 seconds’ advantage over other riders. The Sky team finished with 4 out of the top 10 places on the time trial, and their leader, three-time Tour winner Chris Froome, finished some 35 seconds ahead of his expected competitors for the yellow jersey.
Vortex generators explained
So how could a few dots make a measurable difference? These protrusions are vortex generators meant to modify flow around a cyclist. Humans are not aerodynamic and what typically happens when air flows over a cyclist’s arms is shown in the flow visualization above: the air follows the curve of the arm part way, then it separates from the body, leaving a region of recirculation that increases drag. Vortex generators can help prevent or delay that drag-inducing flow separation by adding extra energy and turbulence to the air near the arm’s surface. Because turbulent boundary layers can follow a curve longer before separating, this helps reduce the drag by reducing the recirculation zone.
About that time savings
Aerodynamically speaking, those vortex generators can make a difference, but the question is, how much? In his complaint, Grappe cites a 2016 paper by L. Brownlie et al. that wind-tunnel tested different vortex generator patterns for use in running apparel. The speeds tested included those relevant to cycling. The specific numbers Grappe quotes aren’t directly relevant, however:
As noted above, race garments that contain VG provide reductions in Fd of between 3.7 and 6.8% compared to equivalent
advanced race apparel developed for the 2012 London Olympics which in turn provided substantially lower drag than
conventional race apparel.the effectiveness of 5, 10 and 15 cm wide strips of VG applied to each flank of a sleeveless singlet revealed that the 5 cm wide
strips provided between 3.1 and 7.1% less Fd than the 10 cm wide strips and between 1.9 and 4.3% less Fd than the 15 cm wide
strips.Here Brownlie et al. are specifically describing the savings for running apparel, which uses vortex generators in very different places than you would on a cyclist. Note the second quote even refers to a sleeveless singlet, so the vortex generators measured are definitely not in the same place as these skinsuits!
The bottom line
I fully expect that vortex generators give a marginal aerodynamic edge, which is why Sky and other teams have already been using them in competition. But I hesitate to declare that the savings is as high as 5-7%, and I have no way to verify Grappe’s subsequent claims that this translates to 18-25 seconds in the time trial. Those are numbers he gives without citing what model is being used to translate drag gains into time.
In the end, what is needed is clarification of the rules. As they stand, one rule seems to allow the skinsuits because the vortex generators are integrated into the fabric, whereas another states clothing is forbidden “to influence the performances of a rider such as reducing air resistance”. Those two stances seems contradictory, and, for now, the race officials’ verdict to allow the suits stands.
If you want to learn more about aerodynamics and cycling, be sure to check out my latest FYFD video. (Image credits: B. Tessier/Reuters; Getty Images; L. Brownlie et al. 2009; h/t to W. Küper)

Prairie Dog Physics

One challenge facing burrowing mammals is ensuring sufficient oxygen within their den. Prairie dogs achieve this with a clever use of Bernoulli’s principle. They build multiple entrances to their tunnels. One of them, labeled as Entrance A above, is built with a raised mound of dirt, while the other, Entrance B, is not. The raised mound creates an obstacle for the wind to move around, which increases the wind velocity at Entrance A compared to the normal wind speed at Entrance B. From Bernoulli’s principle, we know that a higher velocity means a lower pressure, so there is a decreasing pressure gradient through the tunnel from Entrance B to Entrance A. That favorable pressure gradient pulls fresh air through the prairie dog tunnels, allowing the colony to breathe easy. (Image credits: N. Sharp; original prairie dog photos by jinterwas and J. Kubina; final images shared under Creative Commons; research credit: S. Vogel et al.; h/t to Chris R.)

Making Better Tags for Tracking Turtles


Tagging equipment is used on all manner of aerial and marine creatures to gather data about animal behavior in their natural environments. It can be difficult, though, for researchers to gauge what effects the tags have on an animal. A recent study by T. T. Jones et al. used drag measurements on marine turtle casts to estimate the effects of common tagging equipment. They found that, on large turtles, the equipment increases a turtle’s drag by as little as 5%, but for smaller species or juvenile turtles, the drag cost can be much larger – in some cases doubling a turtle’s drag when swimming. Such large increases in drag may significantly change a tagged turtle’s behavior and skew results or even endanger the animal. The researchers suggest a model that allows others to estimate a tag’s drag effects across species. (Image credits: T. Gray and M. Carey; research credit: T. T. Jones et al.; via PopSci; submitted by Chi M.)

How Erosion Shapes a Flow
Erosion creates all manner of strange shapes as wind and water cut away at solids. But why does the interaction of the fluid and solid result in the geometries we observe? Above is a collage from an experiment in which a soft clay sphere was immersed in a water tunnel. After 70 minutes, the sphere had worn into a roughly conical body (Image A) reminiscent of a re-entry capsule. Images B and C show instantaneous streaklines around the clay at 10 minutes and 70 minutes, respectively. Images D and E show diagrams of the flowfield seen in B and C. Fast-moving flow above and below the stagnation point (SP) wears the front of the body into a conical shape, whereas the recirculating vortices aft of the separation point (SL) create a sloped shoulder and flattened back in the clay. The results are consistent with a model in which erosion tries to create uniform shear stress at the solid surface – essentially the process is keeping the frictional force between the fluid and air constant along the surface. This makes sense. If a region’s shear stress is higher, it will be worn more quickly than the surrounding solid, causing it to recede and experience decreased shear stress (relative to the surrounding area) as a result. (Image credit: L. Ristroph et al.)

Visualization Via Temperature
One downside to many flow visualization techniques, like those using dye, smoke, or particles, is the difficulty of dealing with their aftermath. You can only introduce so much of them into a wind or water tunnel before it’s necessary to shutdown and clean everything. One alternative is to use temperature, as shown in the video above. By simply introducing a warmer fluid and using an IR camera, it’s possible to accomplish many of the same effects without the mess. (Video credit: A. Khandekar and J. Jacob; submitted by J. Jacob)

Visualizing F-18 Flow
Flow visualization techniques are helpful outside of wind and water tunnels, too. The photo above comes from the F-18 High Alpha Research Vehicle (HARV) program in which techniques like smoke and dye visualization were used in-flight to visualize airflow around an F-18 at large angles of attack. During flight a glycol-based liquid dye was released from tiny holes along the plane’s forebody, creating the pattern seen here later on the ground. This particular test corresponded to about 26 degrees angle of attack. (Photo credit: NASA Dryden)