It’s fascinating to sit on the beach and watch the waves roll in and break, but rarely do we get a view like the one in this video. Here researchers have created a breaking wave in a wave tank and recorded the wave as it travels the length of the tank with a high-speed camera moving at the same speed as the wave crest. This perspective, moving alongside the fluid, is a Lagrangian coordinate system; if one instead stood still and watched the wave roll past, it would be an Eulerian measurement. Traveling with the wave, we can see how a lip forms on the wave crest, then rolls down, capturing a tube of air. As water begins to flow over the lip, perturbations grow, causing ripples in the laminar curtain. Then the water strikes the main wave and rebounds turbulently, creating a familiar white cap. In the second half of the video, the process is shown from above, highlighting the entrainment of air and the creation of the bubbles that form the white cap of a breaking wave. (Video credit: R. Liu et al)
Search results for: “turbulence”

Liquid Mushrooms
The Rayleigh-Taylor instability can form at the interface between two liquids of different density under the influence of gravity, but a similar instability can occur in the absence of gravity. The image sequence above shows the Richtmyer-Meshkov instability, which occurs between two liquids of differing densities (regardless of their orientation) when impulsively accelerated. In this case, the experiment was conducted in a drop tower to simulate microgravity with the apparatus dropped on a spring to provide the impulse. As the instability grows, asymmetries appear. Nonlinear dynamics will amplify these distortions, eventually leading to turbulent breakdown. (Photo credit: C. Niederhaus/NASA Glenn, J. Jacobs/University of Arizona)

Air Entrainment
When a liquid jet falls into a pool, air is often entrained along with the liquid, creating a cavity and, often, bubbles. Shown above is video of a low-speed laminar jet entering a quiescent pool. The jet appears to entrain a thin film of gas, which then breaks up in a three-dimensional fashion, despite the symmetry of the incoming jet. As the speed of the incoming jet is increased and turbulence is introduced, the resulting air entrainment becomes violent and chaotic. For additional information and videos, see Kiger and Duncan 2012 and their supplemental videos. (Video credit: K. Kiger and J. Duncan)
Unsteady Rocket Nozzle
This numerical simulation gives a glimpse of flow inside an unsteady rocket nozzle. The nozzle is over-expanded, meaning that the exhaust’s pressure is lower than that of the ambient atmosphere. A slightly over-expanded nozzle causes little more than a decrease in efficiency, but if the nozzle is grossly over-expanded, the boundary layer along the nozzle wall can separate and induce major instabilities, as seen here. In the first segment of the video, turbulent structures along the nozzle wall boundary layer are shown; note how the boundary layer becomes very thick and turbulent after the primary shock wave (shown in gray). This is due to the flow separating near the wall. The second half of the video shows the unsteadiness this can create. The primary shock wave splits into two near the wall, creating a lambda shock wave, named for the shape of the lower case Greek letter. This shock structure is indicative of strong interaction between the boundary layer and shock wave. (Video credit: B. Olson and S. Lele)

Rocket Exhaust
A fiery jet of exhaust remains amid plumes of smoke as a Soyuz rocket lifts off from Baikonur Cosmodrome bound for the International Space Station. The lengthscales of such turbulence range from tens of meters to only millimeters, highlighting the incredible difficulty of accurately capturing and describing the fluid motion of a practical engineering problem. (Photo credit: NASA/Carla Cioffi; via Visual Science)
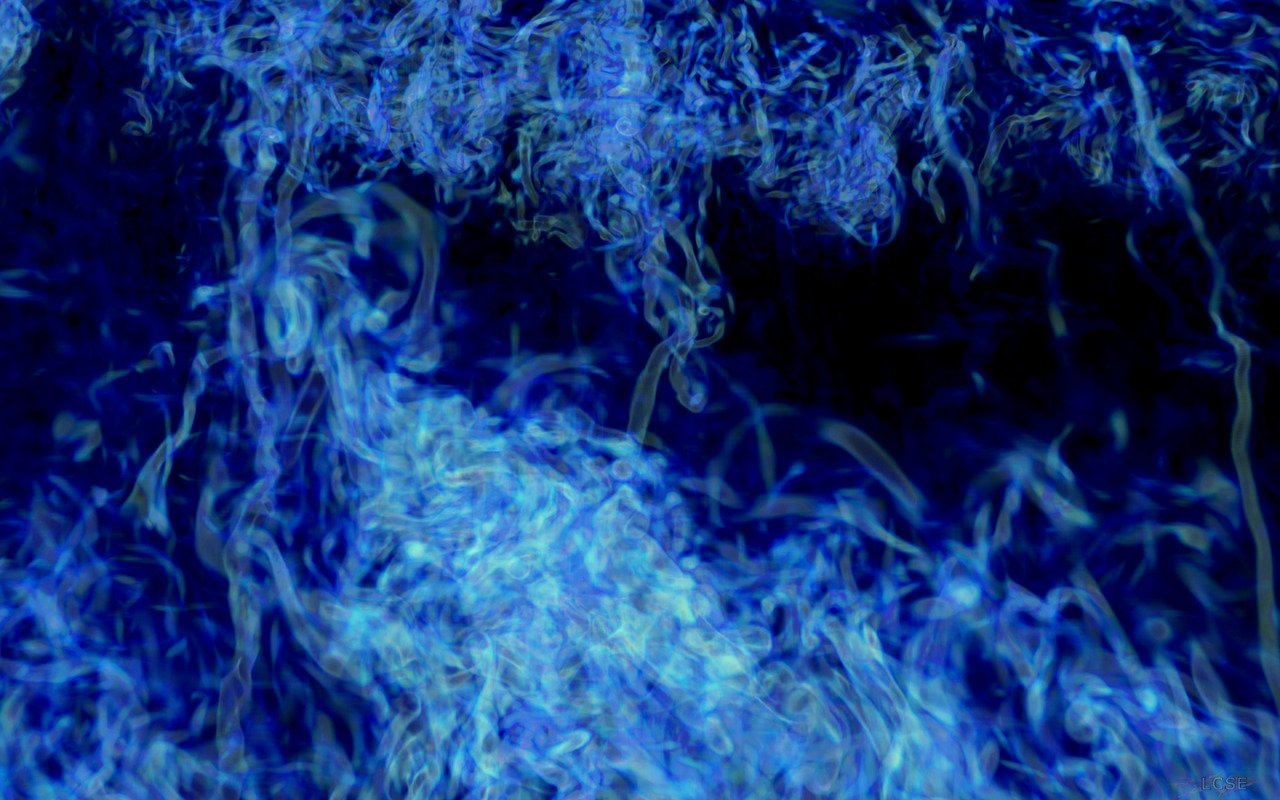
Supercomputed Fluids


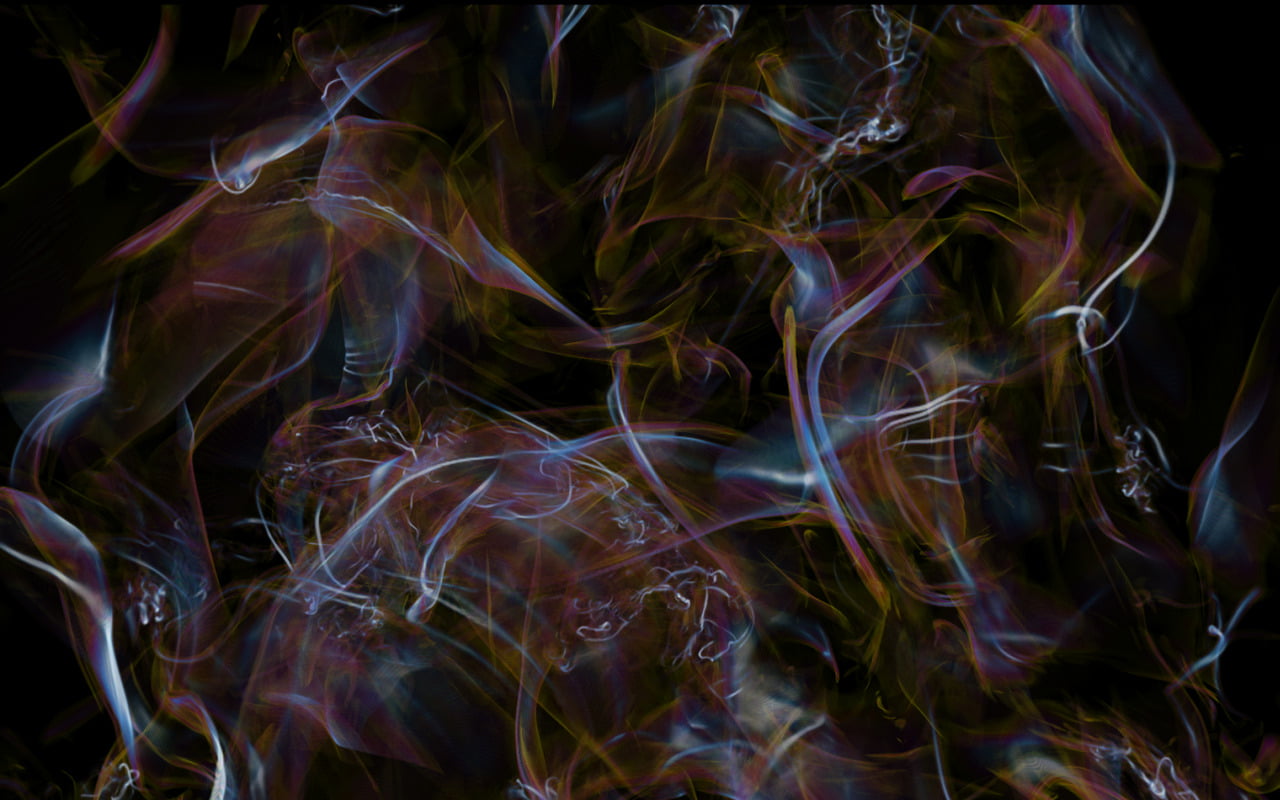
Computational fluid dynamics and supercomputers can produce some stunning flow visualizations. Above are examples of turbulence, the Rayleigh-Taylor instability, and the Kelvin-Helmholtz instability. Be sure to check out LCSE’s website for more; they’ve included wallpapers of some of the most spectacular ones. (Photo credits: Laboratory for Computational Science and Engineering, University of Minnesota, #)
Formula 1 Aerodynamics
[original media no longer available]
Computational fluid dynamics (CFD) and the advent of supercomputing have forever changed the way engineers design. Here the use of CFD in the design of Formula 1 racing cars is discussed. Although CFD is used by many companies in place of wind tunnel testing, each method has its advantages. CFD provides information about all flow quantities at all points in the flow but can only do so with an accuracy dependent on the grid and models used. It remains impossible to solve the equations of motion exactly for any problem of practical application because the computational cost is simply too high; instead software packages like FLUENT utilize turbulence models that approximate the physics. Wind tunnel testing, on the other hand, is physically accurate but typically yields only limited data and flow quantities due to the difficulty of instrumentation. (Video credit: BBC News; submitted by carhogg)
(Source: /)The Veil Nebula
There is no grander scale for the observation of fluid dynamics than that of the astronomical. Here Hubble astronomers discuss the formation of the Veil Nebula, a supernova remnant formed some 5,000-10,000 years ago. Wisps of gas and plasma remain, creating stunning astronomical landscapes that are the result of shock waves, turbulence, diffusion, and other processes familiar to us here on Earth. (Video credit: ESA/Hubble)
Wingtip Vortices
Any finite length wing produces wingtip vortices–potentially intense regions of rotational flow downstream of the wing’s ends. These vortices are associated both with the production of lift on the wing and with unavoidable induced drag. The tabletop demonstration above shows the region of the vortices’ influence and how strong the rotation is there. Note also that the two vortices have opposite rotational senses–the left side induces a clockwise rotation, whereas the right side induces an anti-clockwise rotation. The larger an aircraft, the stronger and longer lasting its vortices; this can be a source of danger for smaller aircraft passing through the wake. If a pilot crosses one wingtip vortex and overreacts to compensate, crossing the second counter-rotating vortex can cause even greater damage.

Using Flow Viz for Optimization


Flow visualization is a powerful design tool for engineers. When Google was interested in determining optimal configurations for their heliostat array, they turned to NASA Ames’ water tunnel facility to test upstream barriers to deflect flow off the heliostats. In each photo, flow is from left to right and fluorescent dye is used to mark streamlines and reveal qualitative flow detail. Upstream of the obstacles, the streamlines are coherent and laminar, but after deflection, the flow breaks down into turbulence. In this case, such turbulence is desirable because it lowers the local fluid velocity and thus the aerodynamic loads experienced by each heliostat, potentially allowing for a savings in fabrication. For more, see Google’s report on the project. (Photo credits: google.org)