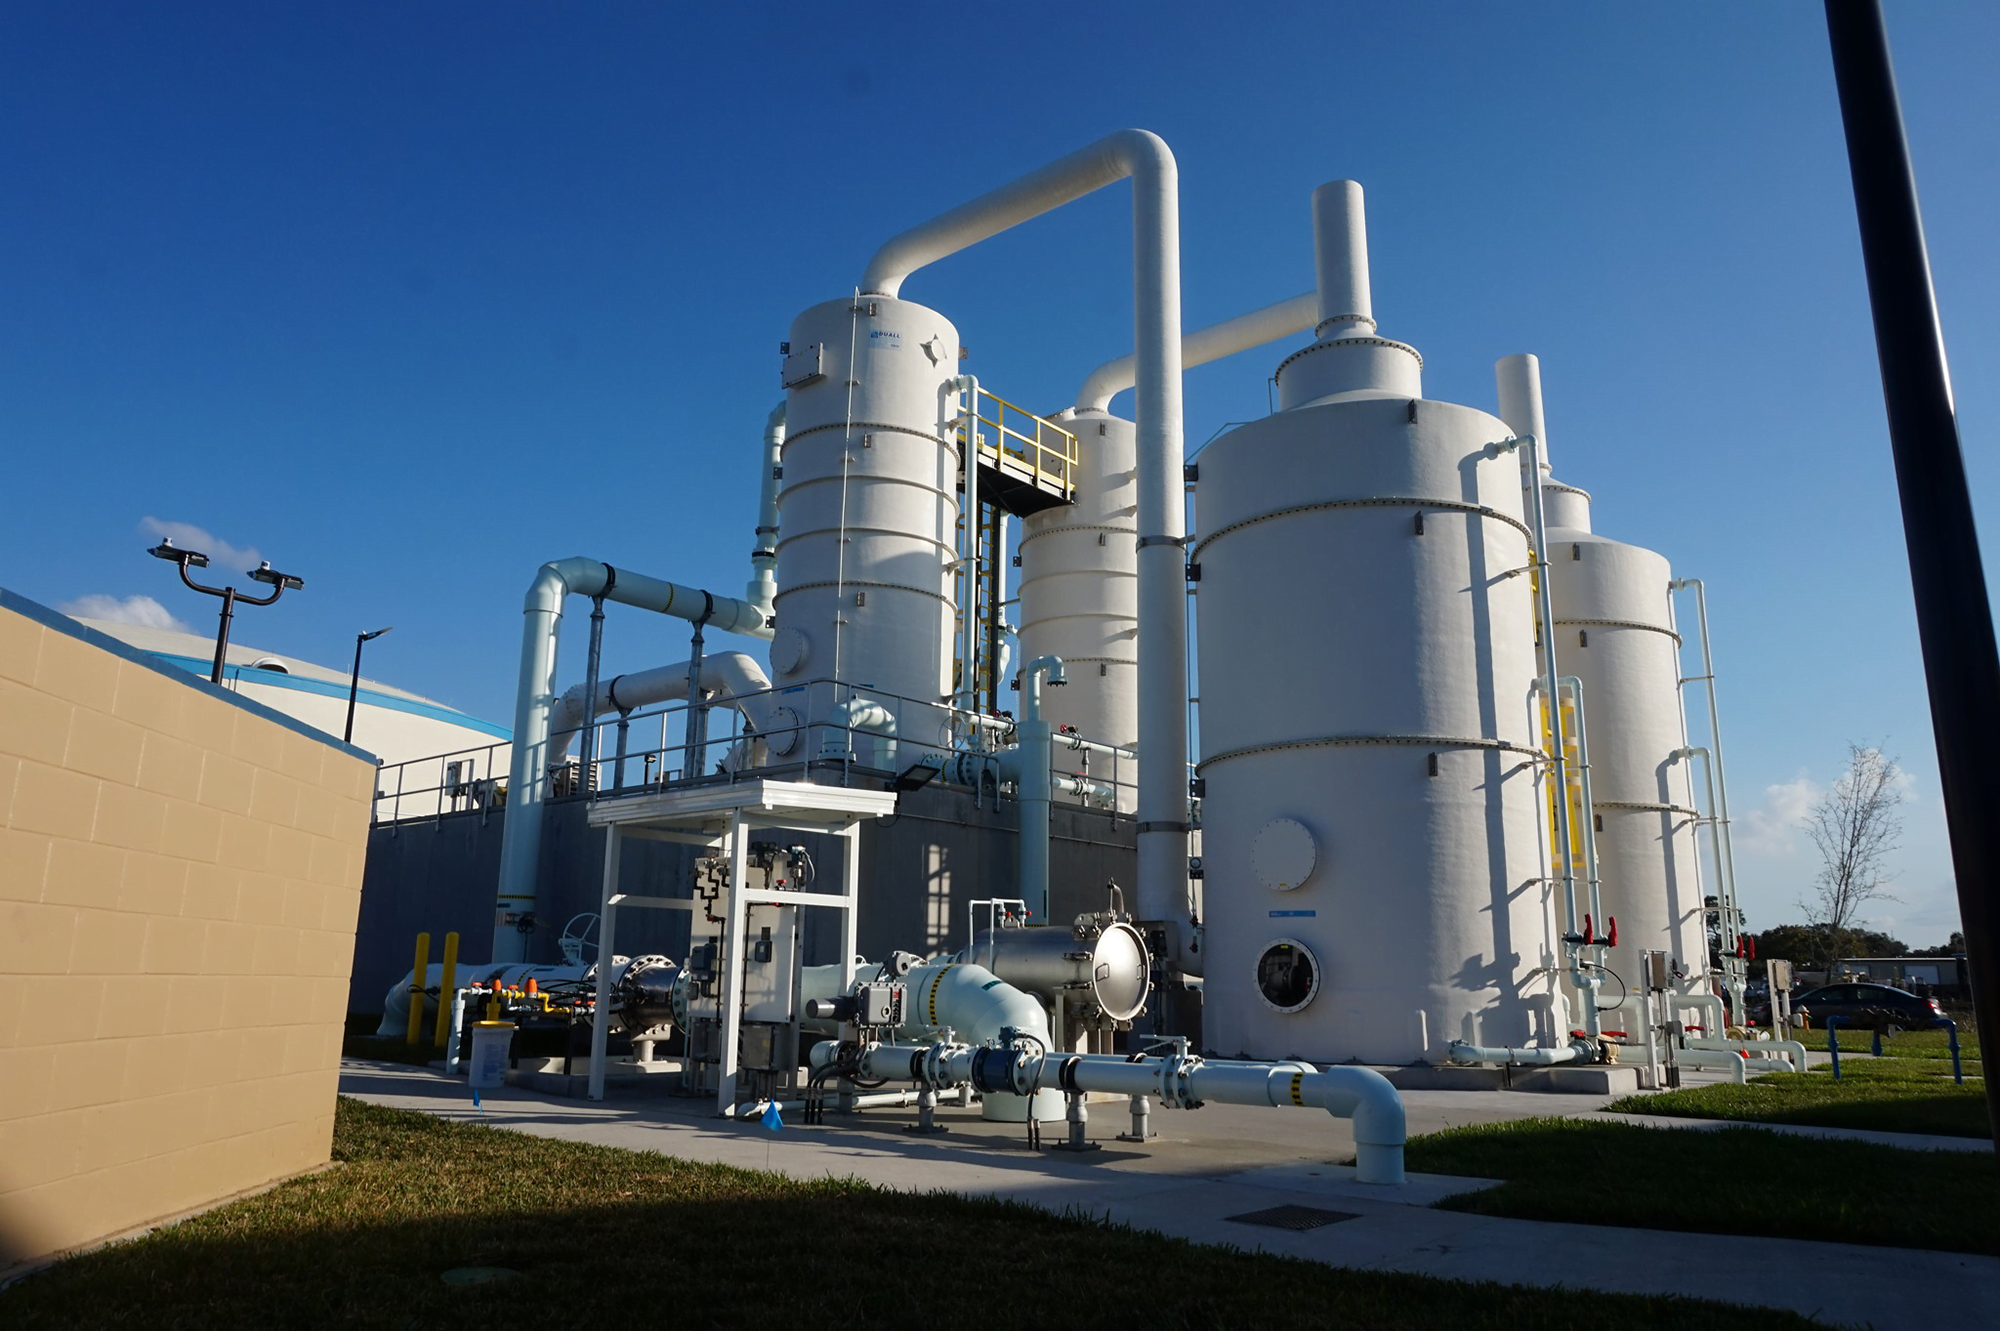
Desalination and water treatment plants both rely on reverse osmosis to generate clean water for human use. The standard theory behind reverse osmosis for the last half century suggested that the membranes separated water and other chemicals by forcing water molecules, driven by chemical gradients, to travel one-by-one through a dense membrane forest. But over the years, researchers saw signs that this theory didn’t hold up; for one, the membranes water travels through have pores in them that are larger than individual water molecules.
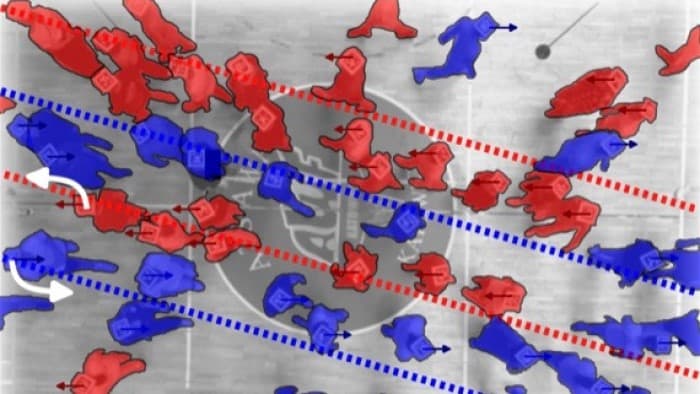
A new study examines the underlying assumptions of the prevailing model and finds instead that water moves through reverse osmosis membranes by pore flow. Instead of individual molecules pushed by concentration, flow takes place through pores and is driven by a pressure gradient. The difference is important because it enables engineers to design more efficient membranes according to real-world physics. By understanding the underlying mechanism, designers can tweak the pore size, density, and other features of reverse osmosis membranes to better filter unwanted chemicals and to remove salt from water with less energy input. (Image credit: Florida Water Daily; research credit: L. Wang et al.; via Wired; submitted by Kam-Yung Soh)


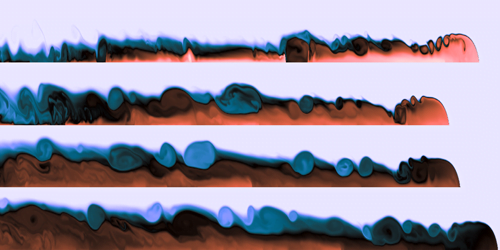
 dye in a freshwater estuary near the beach.")