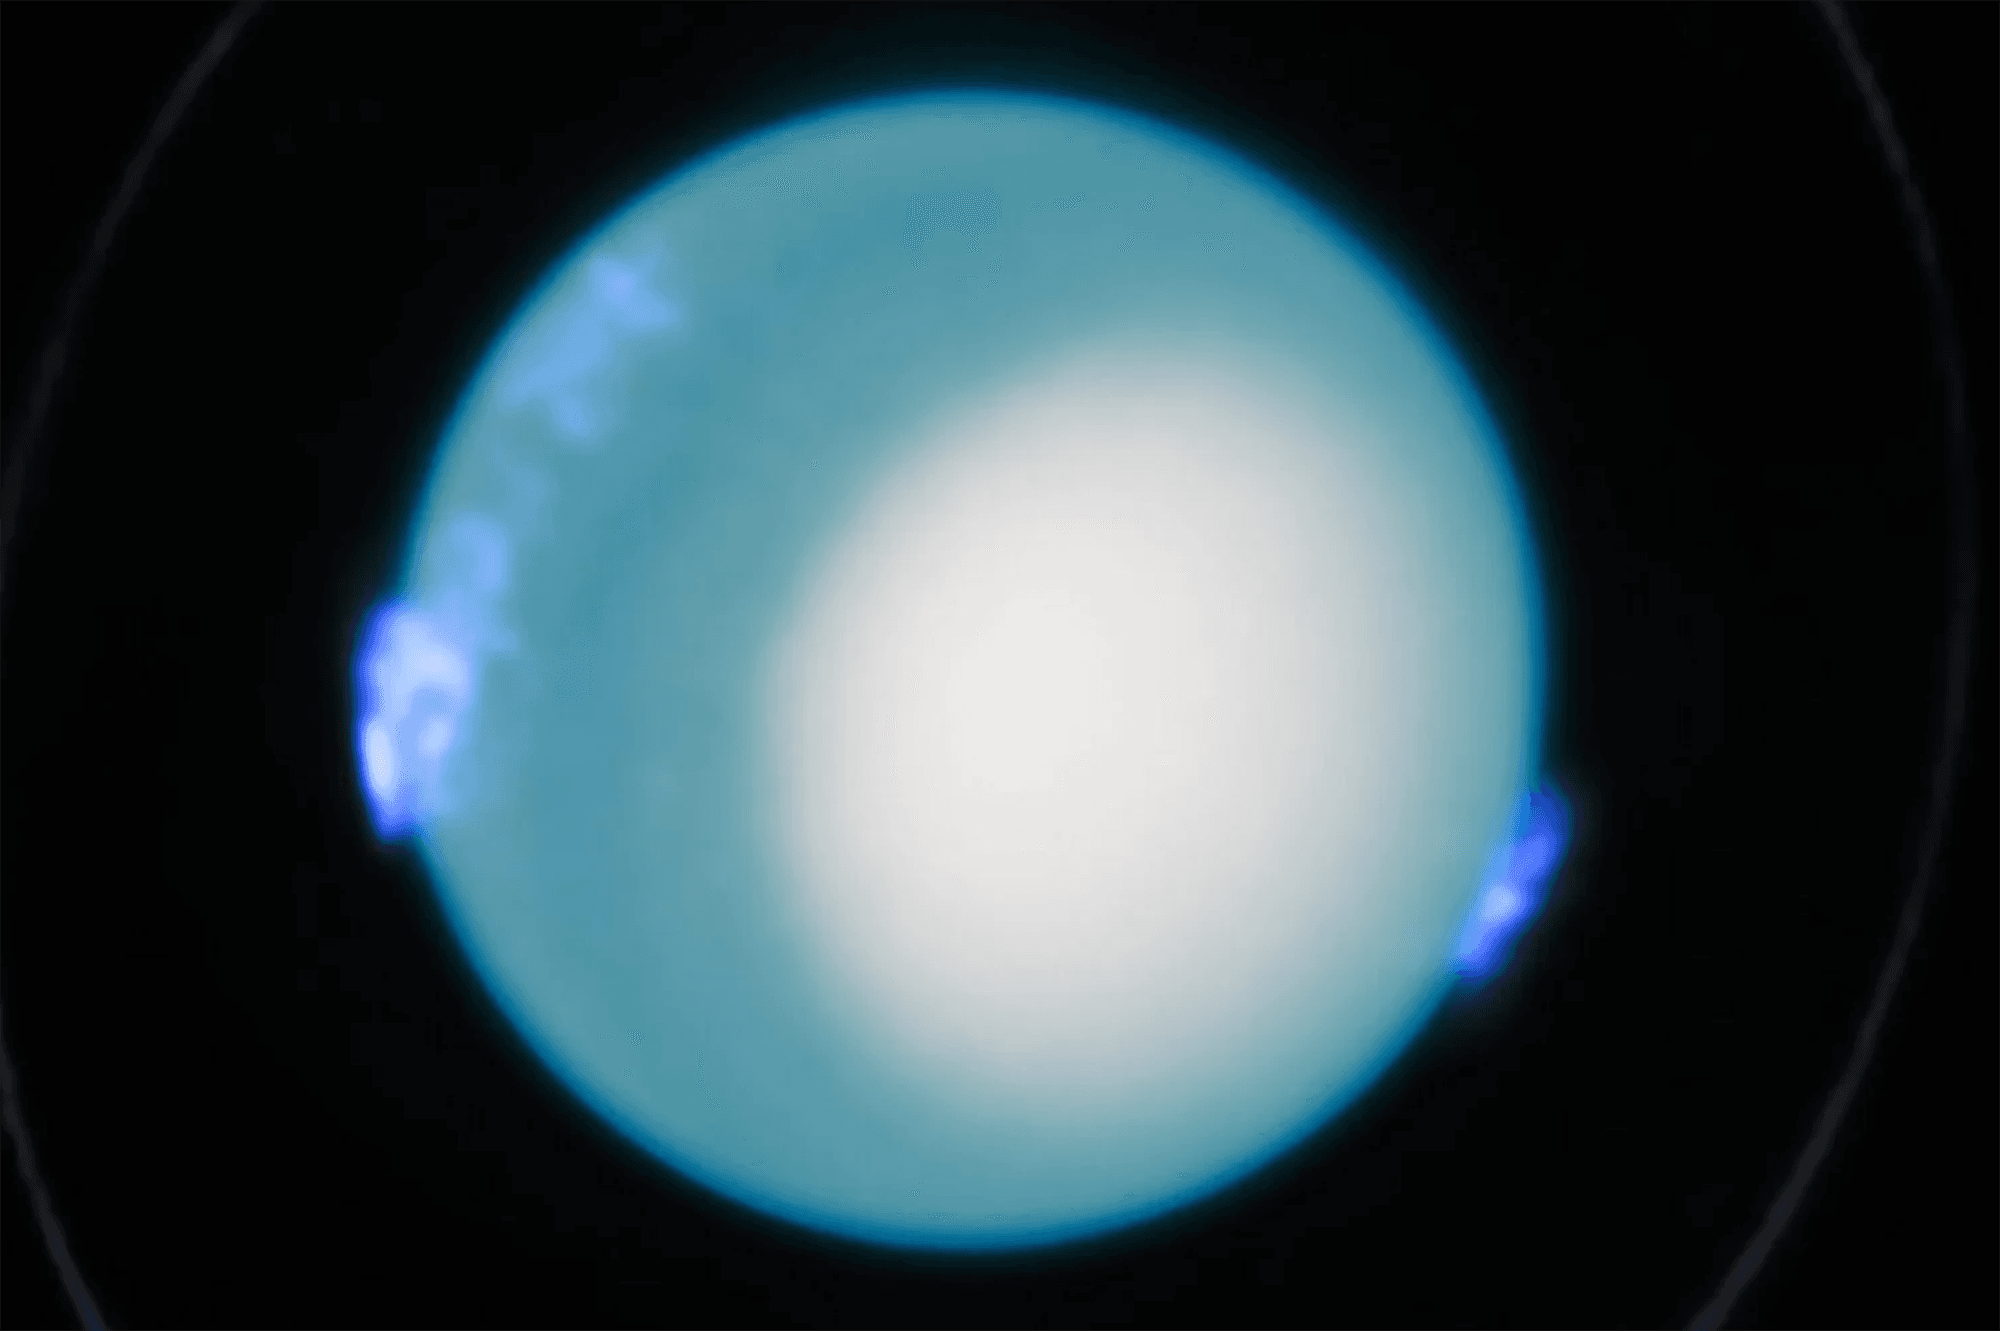
Uranus is one of our solar system’s oddest planets. An ice giant, it spins on its side. We originally estimated its rate of rotation using measurements from Voyager 2, the only spacecraft to have visited the planet. But that measurement was so imprecise that within two years, astronomers could no longer use it to predict where the planet’s poles were. Now a new study, drawing on over a decade of Hubble observations of Uranus’s auroras, has pinned down the planet’s rotation rate far more precisely: 17 hours, 14 minutes, and 52 seconds. While that’s within the original measurement’s 36-second margin of error, the new measurement has a margin of error of only 0.036 seconds. In addition to helping plan a theoretical future Uranus mission, this more accurate rotation rate allows researchers to reexamine decades of data, now with certainty about the planet’s orientation at the time of the observation. (Image credit: ESA/Hubble, NASA, L. Lamy, L. Sromovsky; research credit: L. Lamy et al.; via Gizmodo)
Search results for: “art”

Escape From Yavin 4
In an ongoing tradition, let’s take another look at some Star Wars-inspired aerodynamics. This year it’s the TIE fighter’s turn. Here, researchers simulate the spacecraft trying to escape Yavin 4’s atmosphere at Mach 1.15. The research poster’s blue contours show pressure contours, with darker colors connoting higher pressures. The bright low pressure region immediately behind the craft suggests a difficult, high-drag ascent and a turbulent, subsonic wake despite the craft’s supersonic velocity. (Image credit: A. Martinez-Sanchez et al.)
Fediverse Reactions
-

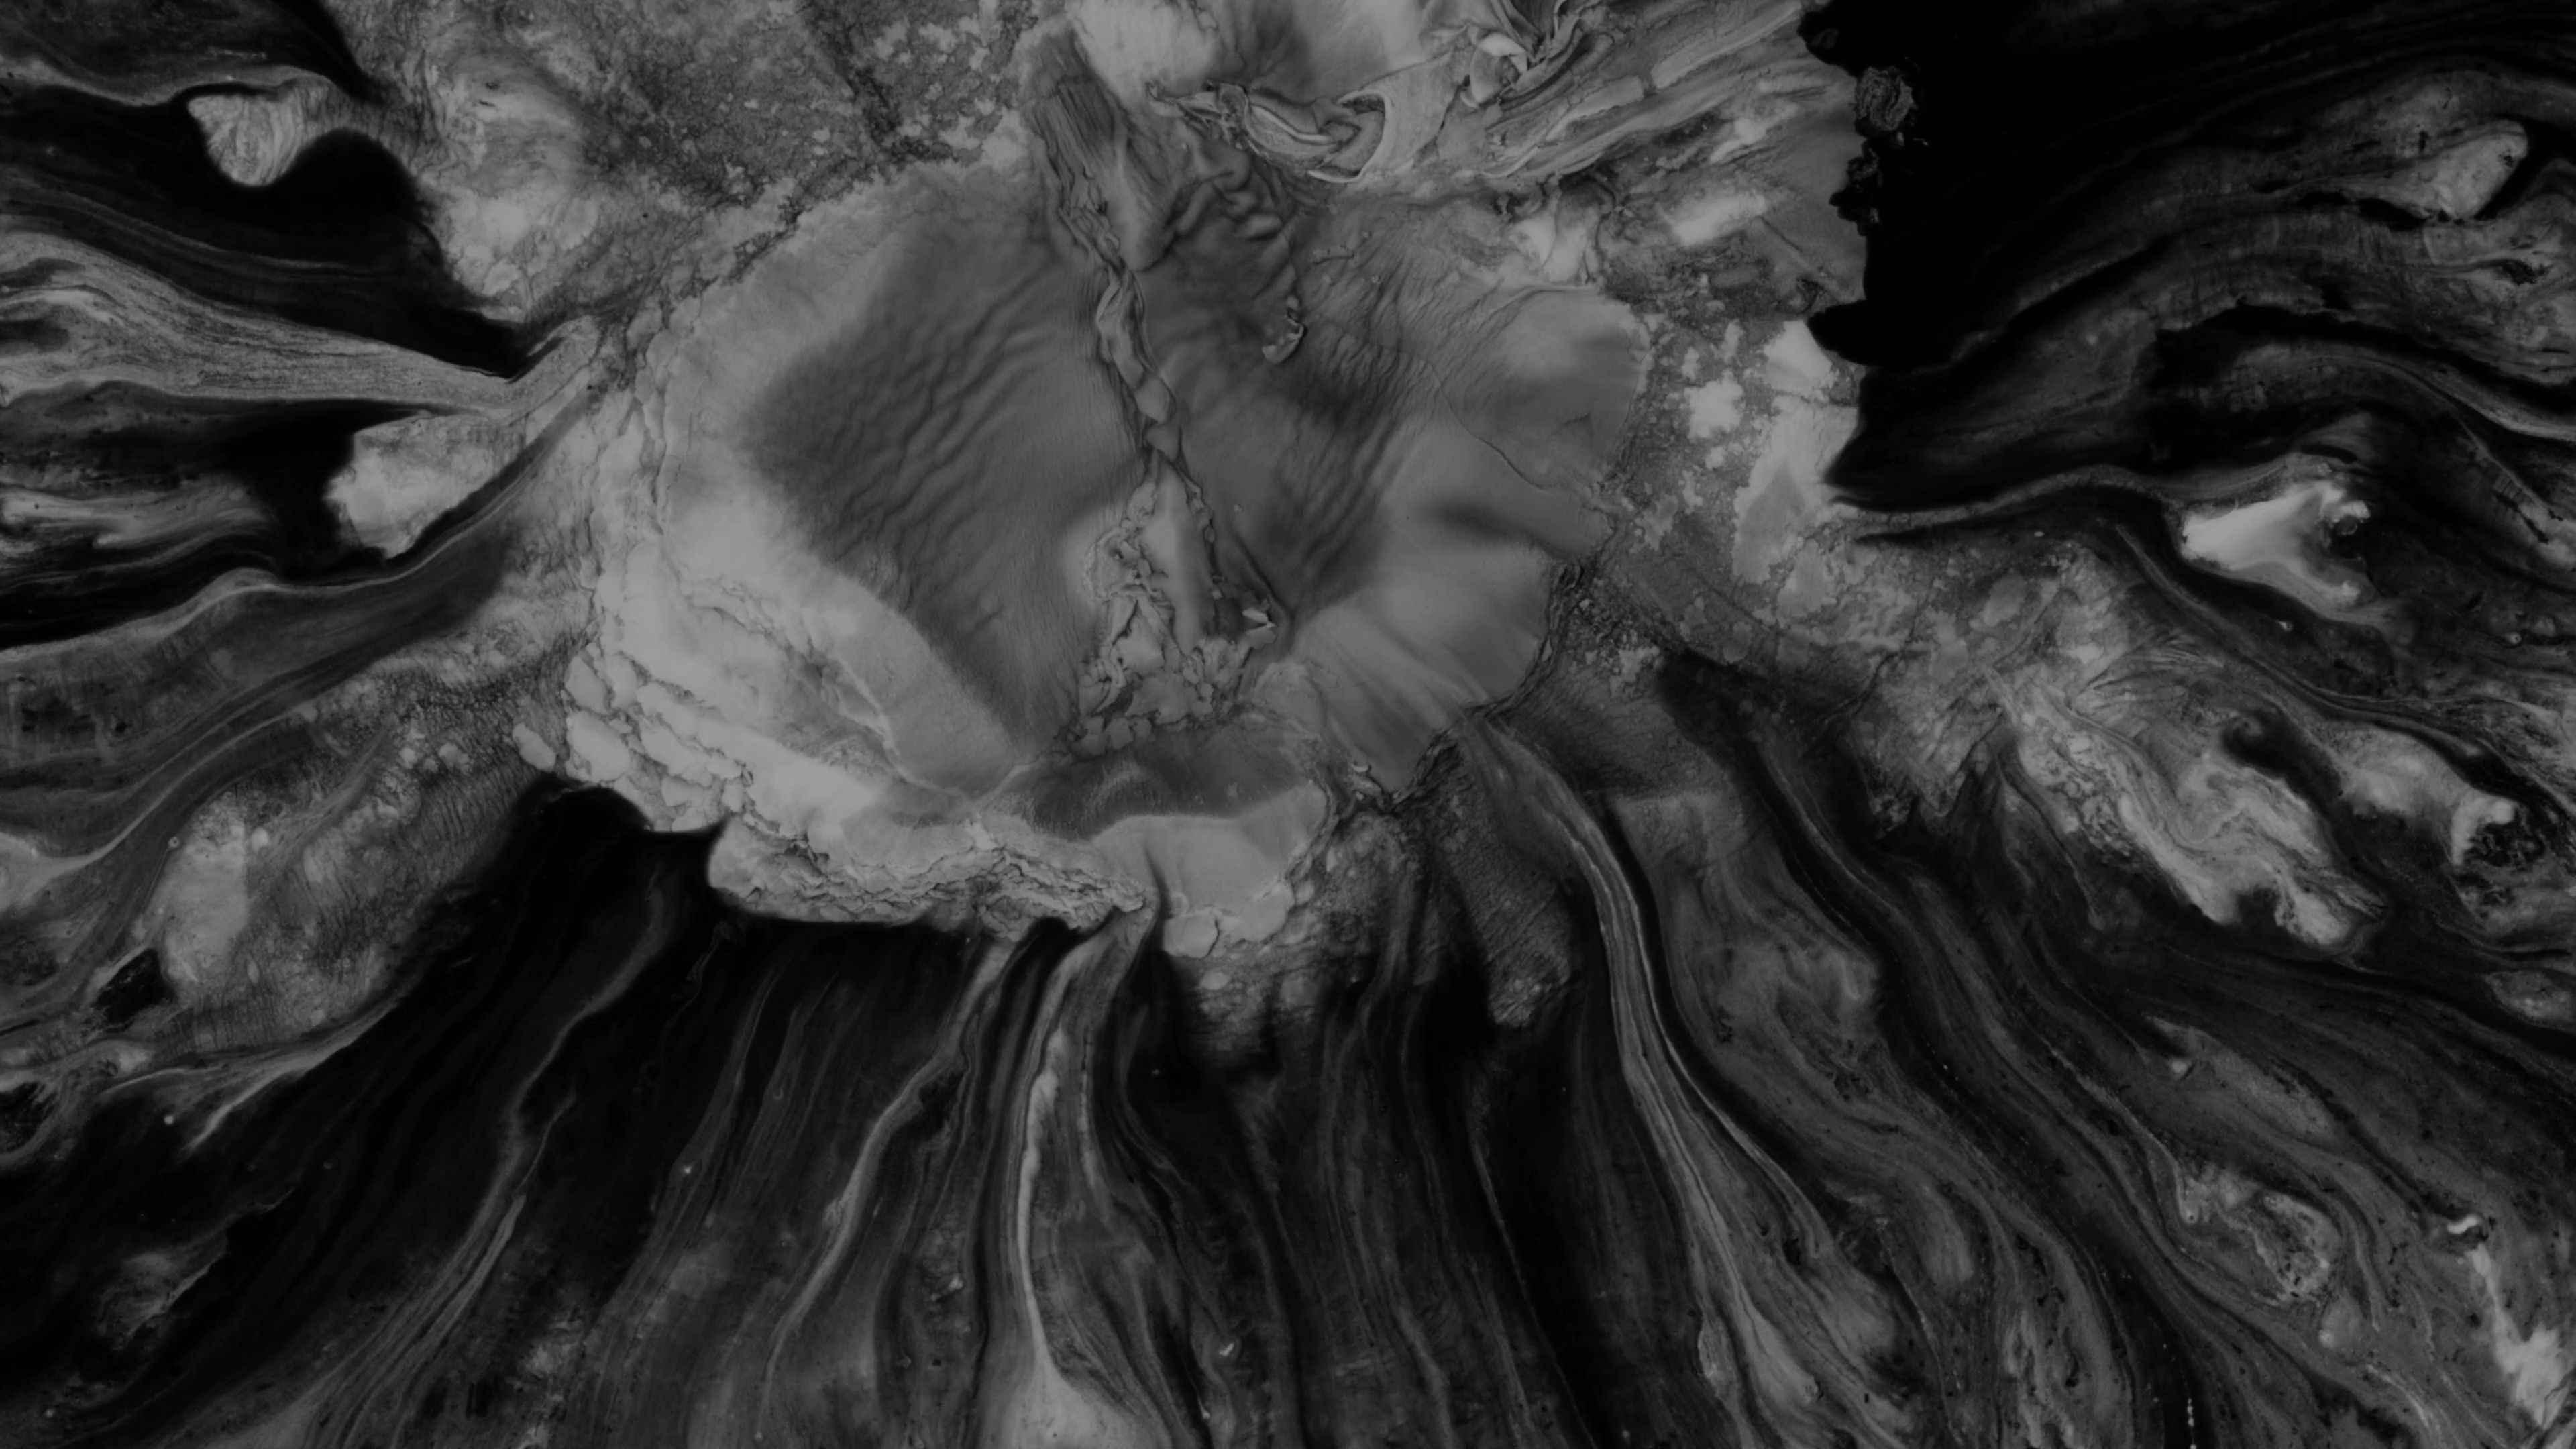
“Legend”


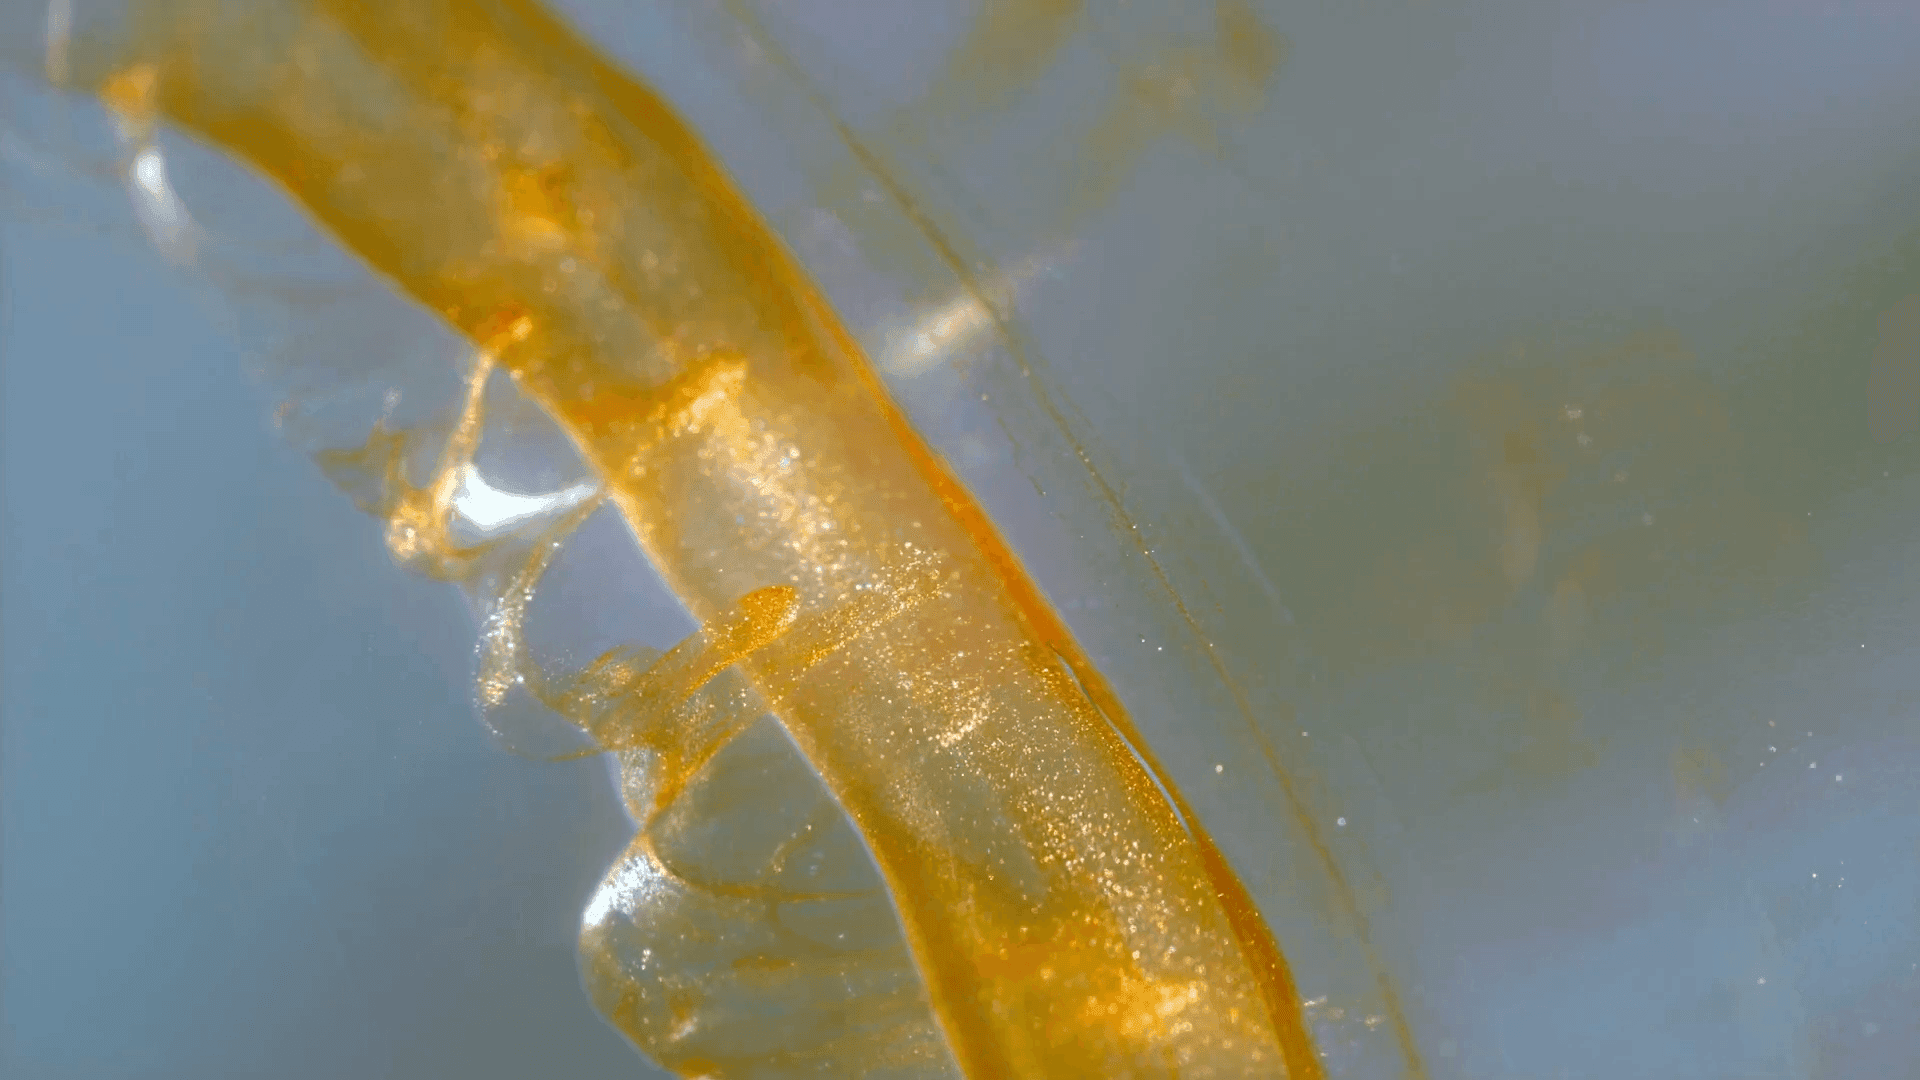
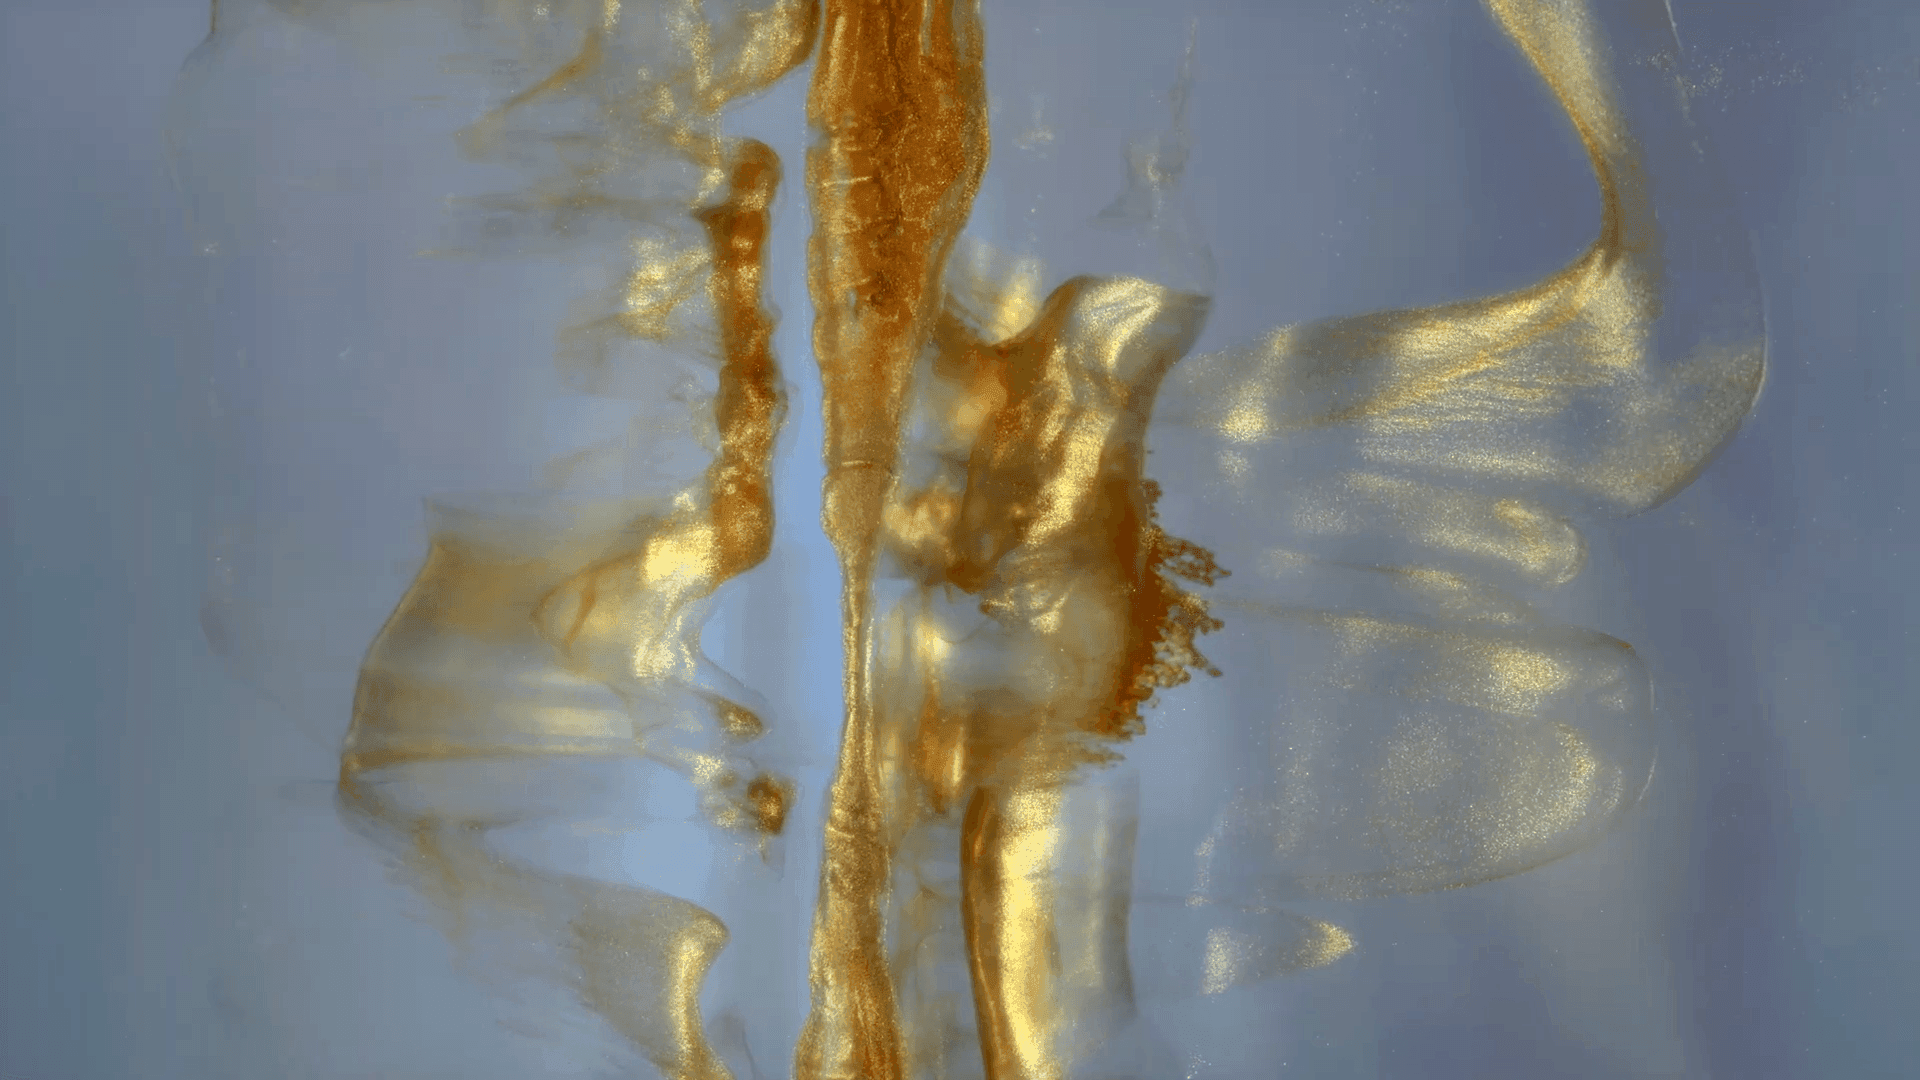


Filmmaker Roman De Giuli returns to his roots with this short fluid-filled film inspired by the color gold. He combines paint, ink, powders, and particles in a mix of micro- and macroscale photography. As always, the results are a mesmerizing plethora of fluid phenomena: Marangoni flows, turbulence, vorticity, viscous fingering and so much more. (Video and image credit: R. De Giuli)
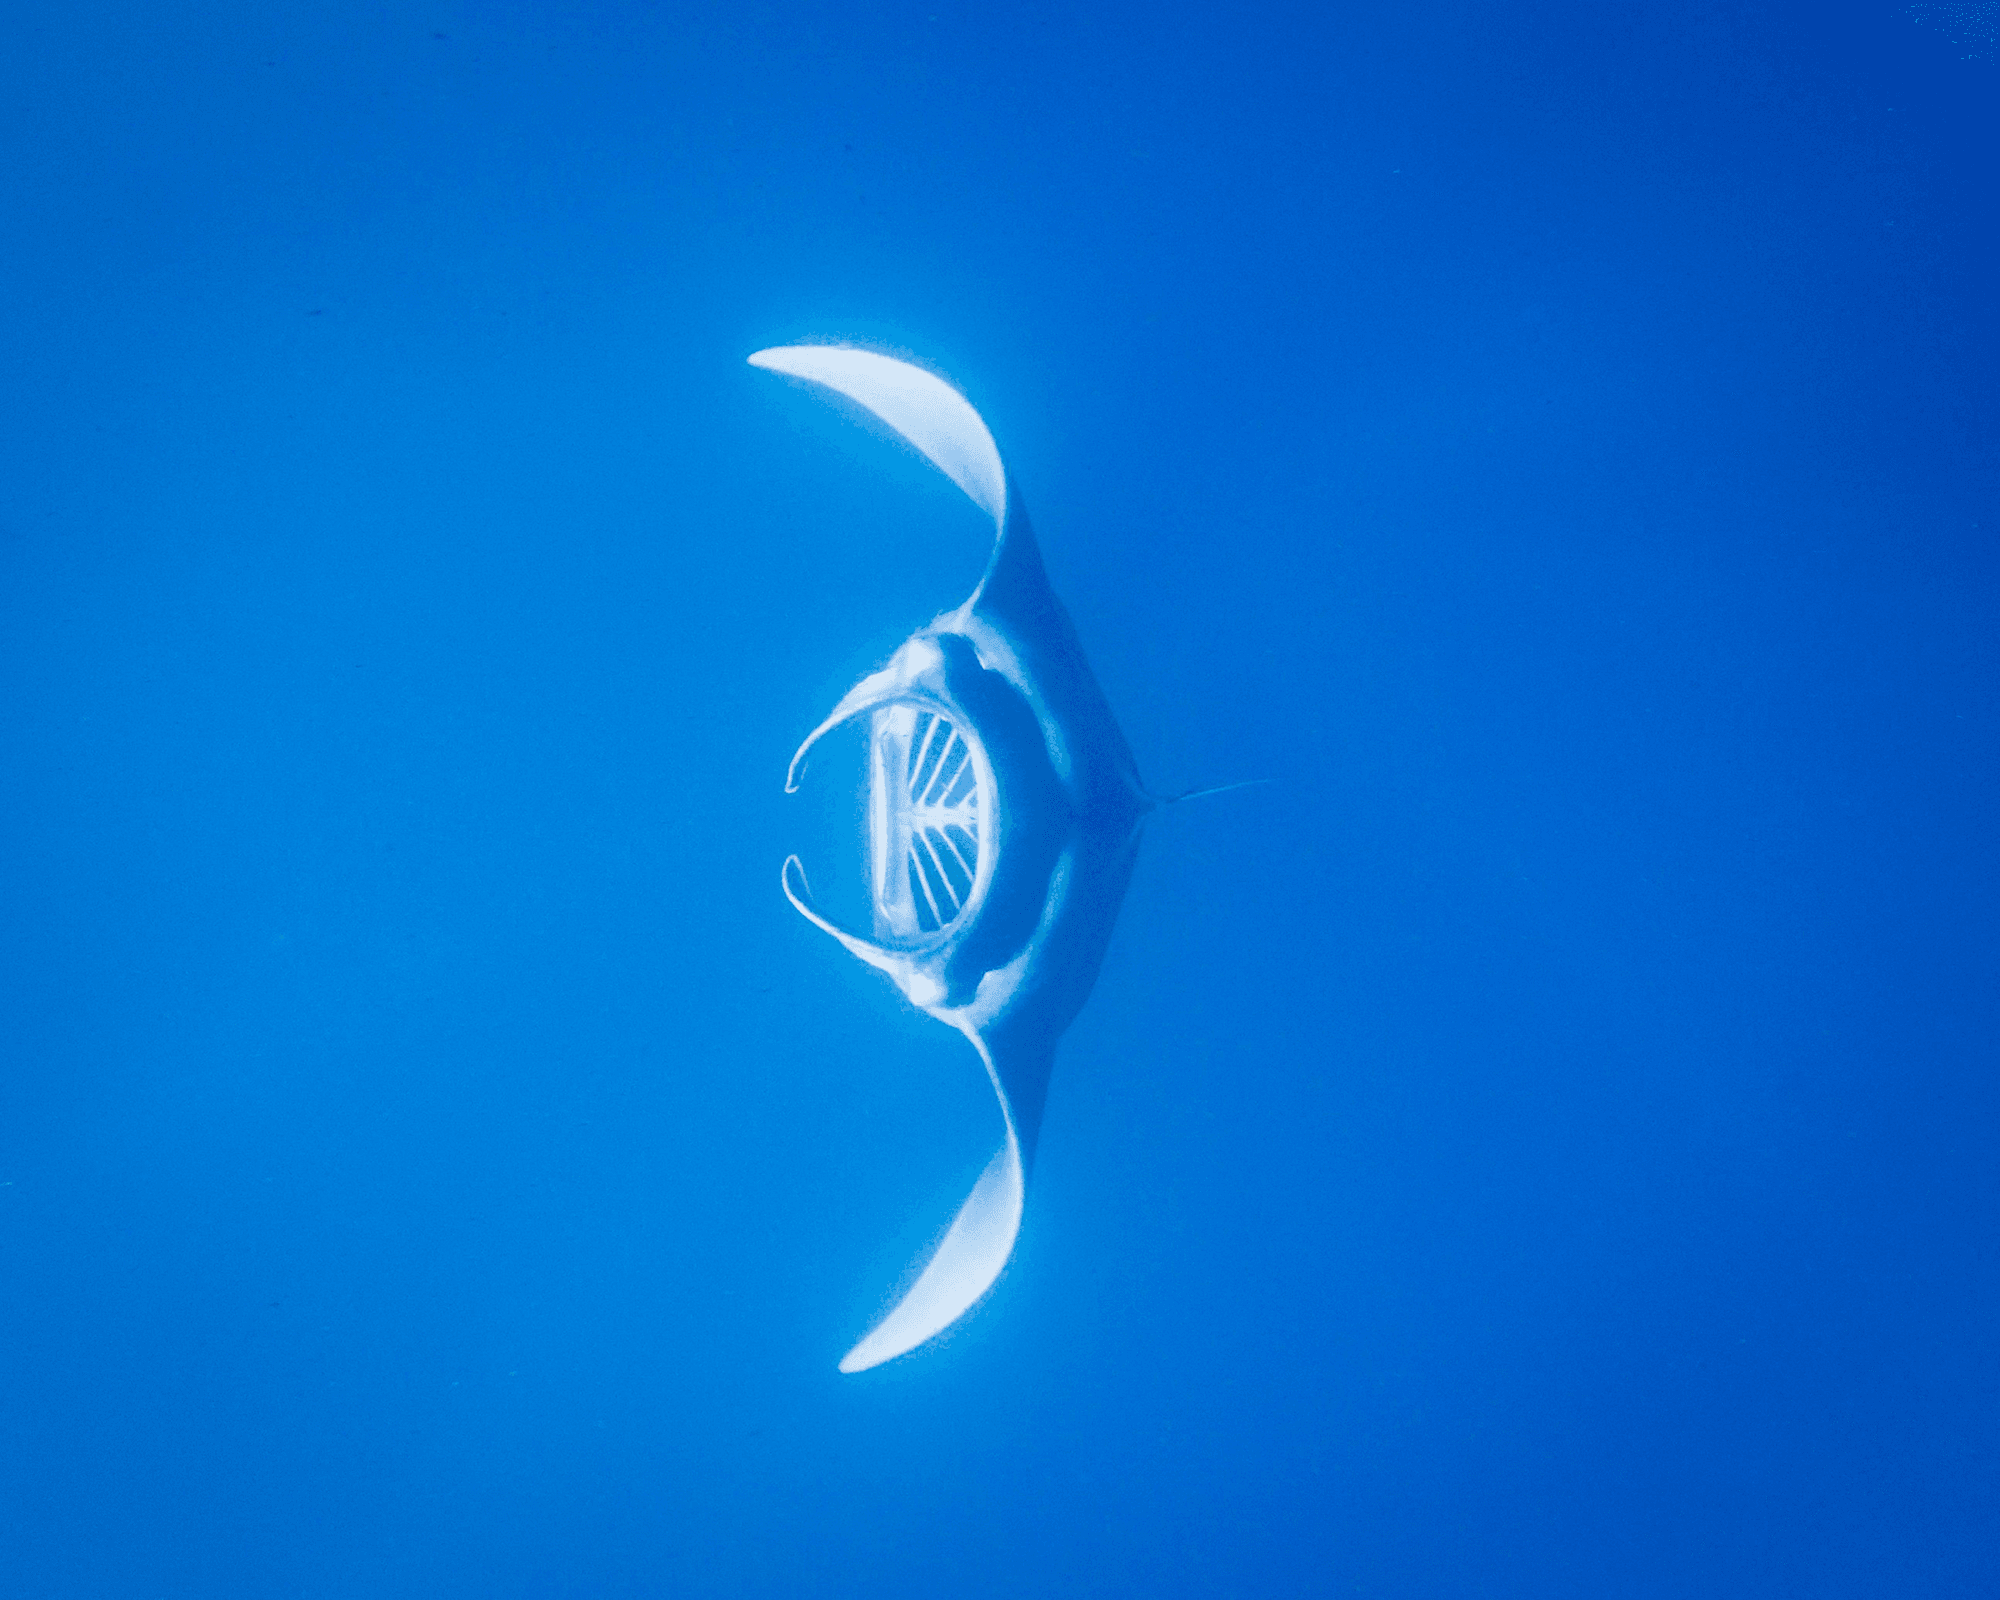
Filtering Like a Manta Ray
As manta rays swim, they’re constantly doing two important — but not necessarily compatible — things: getting oxygen to breathe and collecting plankton to eat. That requires some expert filtering to send food particles toward their stomach and oxygen-rich water to their gills. Manta rays do this with a built-in filter that resembles an industrial crossflow filter. Researchers built a filter inspired by a manta ray’s geometry, and found that it has three different flow states, based on the flow speed. At low speeds, flow moves freely down the filter’s channels; in a manta, this would carry both water and particles toward the gills. At medium speeds, vortices start to form at the entrance to the filter channels. This sends large particles downstream (toward a manta’s digestive system) while water passes down the channels. At even greater speeds, each channel entrance develops a vortex. That allows water to pass down the filter channels but keeps particles out. (Image credit: manta – N. Weldingh, filter – X. Mao et al.; research credit: X. Mao et al.; via Ars Technica)
Depending on the flow speed, a manta-inspired filter can allow both water and particles in or filter particles out of the water. Fediverse Reactions
-
Climate Change and the Equatorial Cold Tongue
A cold region of Pacific waters stretches westward along the equator from the coast of Ecuador. Known as the equatorial cold tongue, this region exists because trade winds push surface waters away from the equator and allow colder, deeper waters to surface. Previous climate models have predicted warming for this region, but instead we’ve observed cooling — or at least a resistance to warming. Now researchers using decades of data and new simulations report that the observed cooling trend is, in fact, a result of human-caused climate changes. Like the cold tongue itself, this new cooling comes from wind patterns that change ocean mixing.
As pleasant as a cooling streak sounds, this trend has unfortunate consequences elsewhere. Scientists have found that this cooling has a direct effect on drought in East Africa and southwestern North America. (Image credit: J. Shoer; via APS News)
Fediverse Reactions
-
Drops on the Edge
 surface and a (red-dyed) wet surface. The portion of the drop hitting the red film forms a purplish corona splash.")


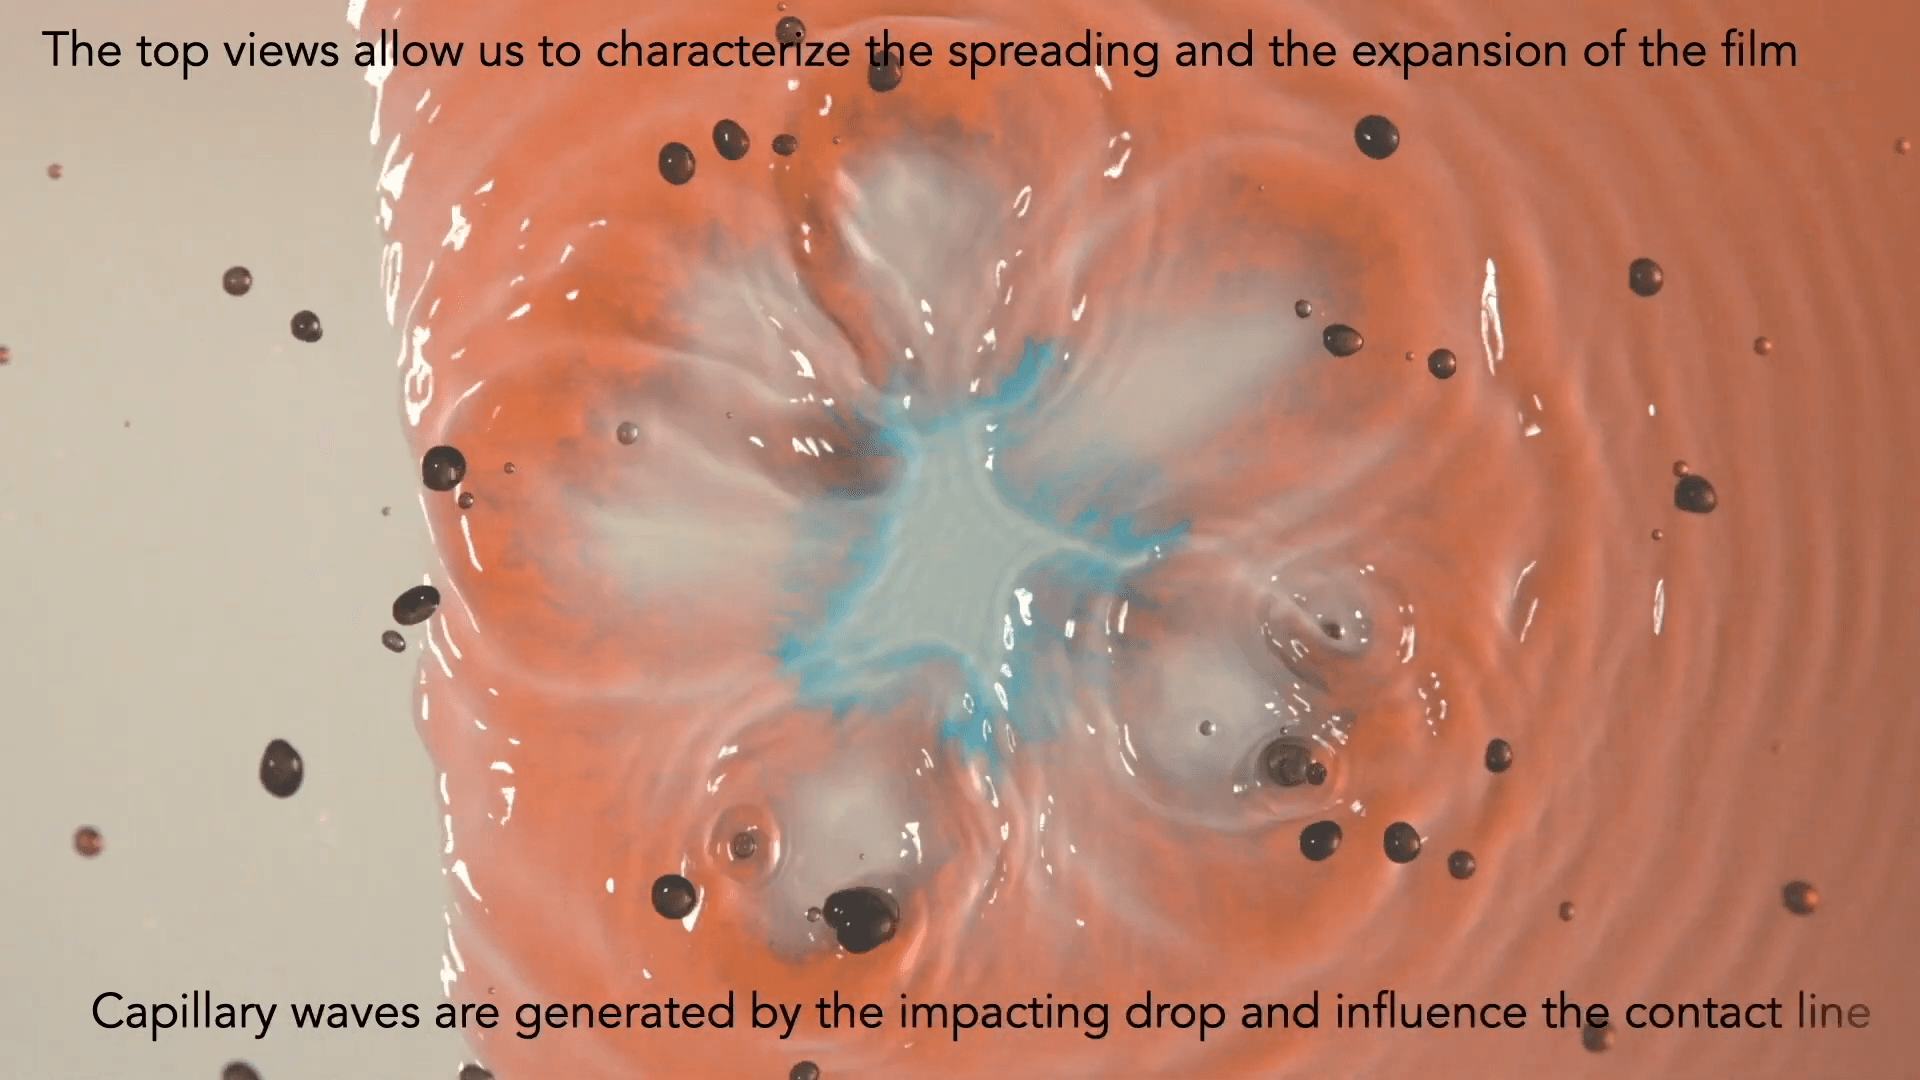
Drops impacting a dry hydrophilic surface flatten into a film. Drops that impact a wet film throw up a crown-shaped splash. But what happens when a drop hits the edge of a wet surface? That’s the situation explored in this video, where blue-dyed drops interact with a red-dyed film. From every angle, the impact is complex — sending up partial crown splashes, generating capillary waves that shift the contact line, and chaotically mixing the drop and film’s liquids. (Video and image credit: A. Sauret et al.)
“Dispersion”


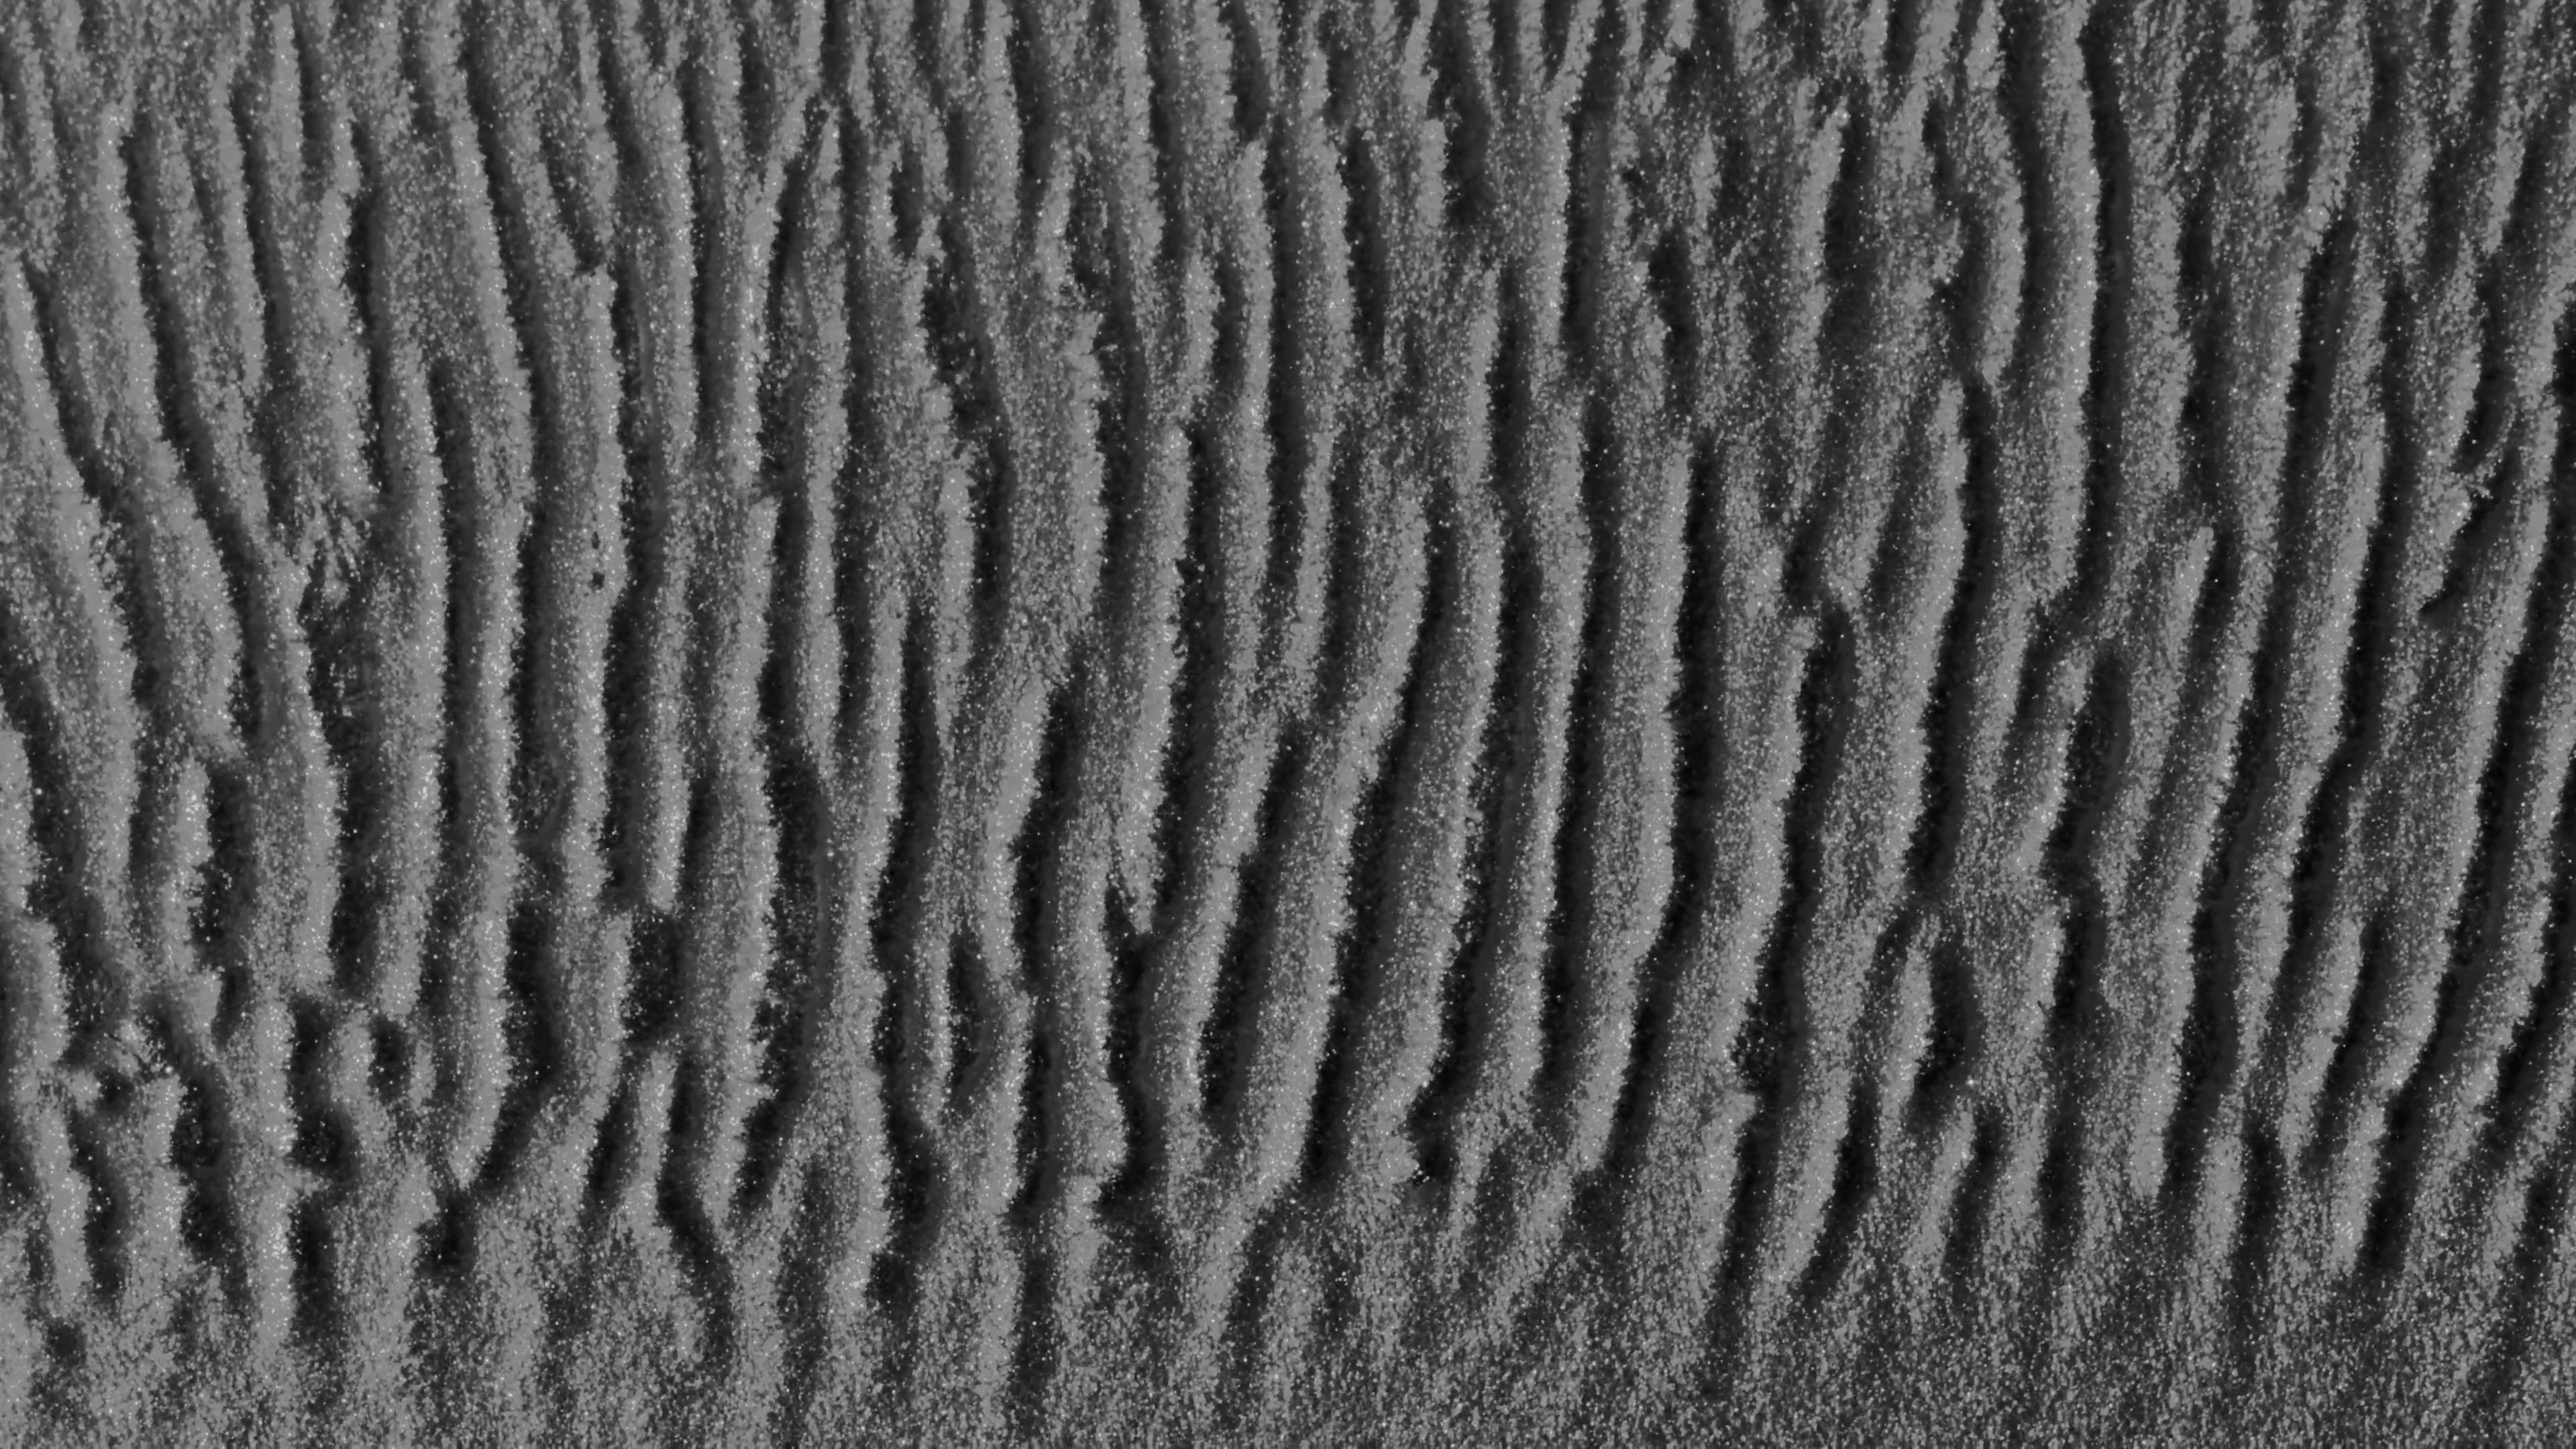


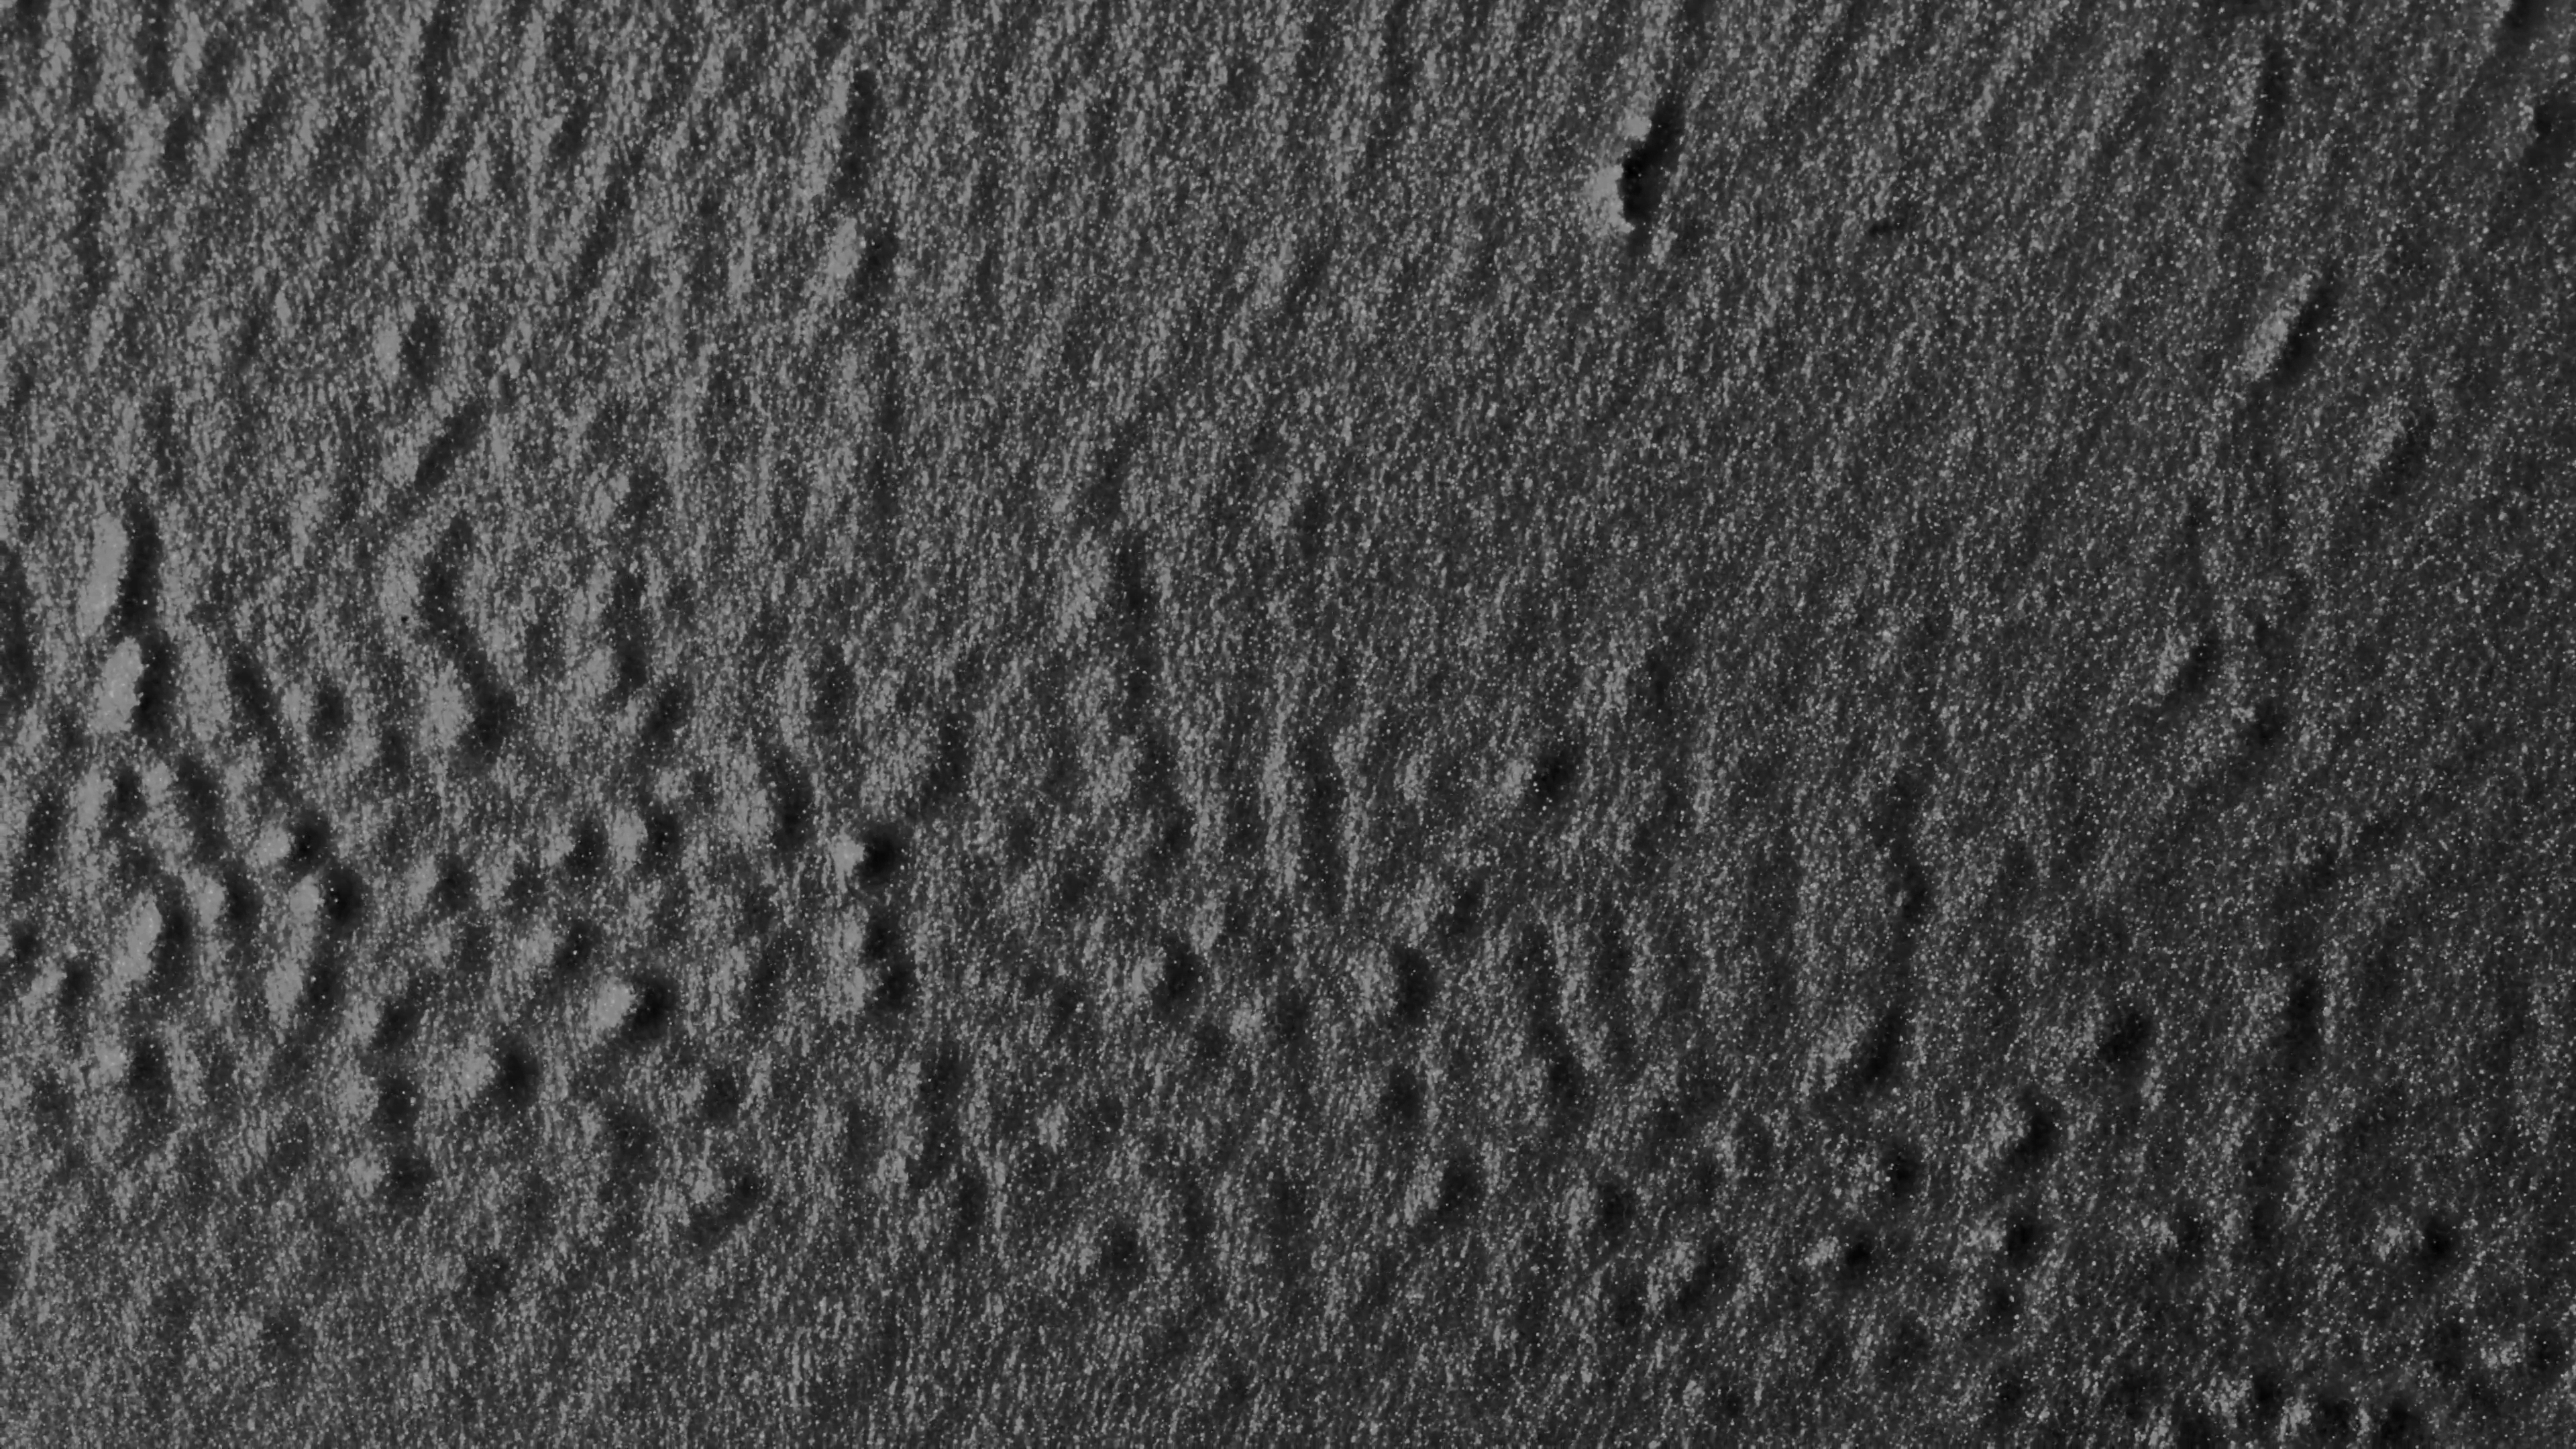
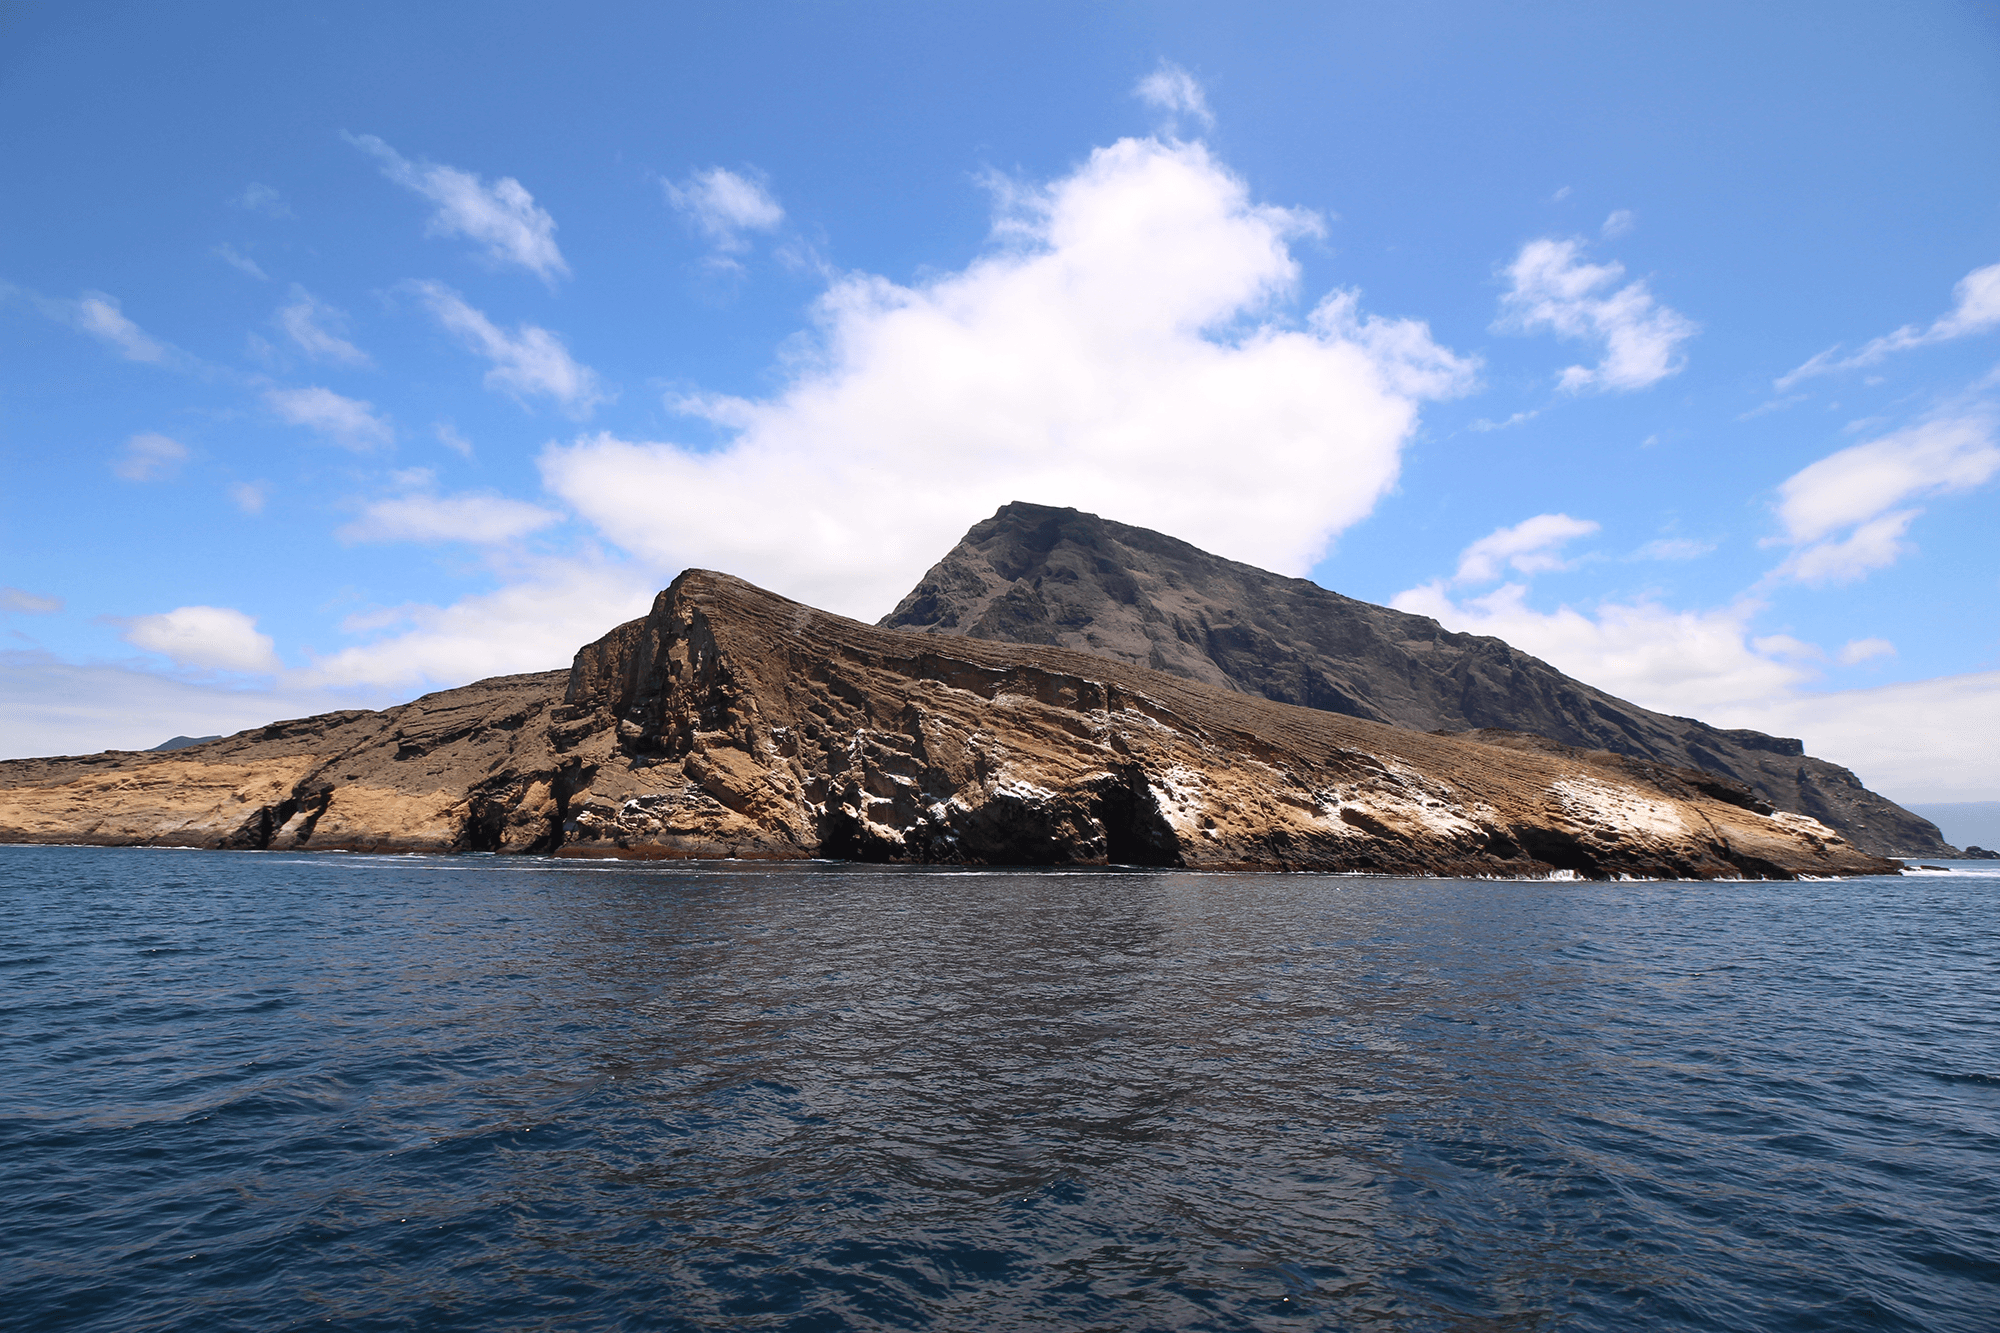
In “Dispersion,” particles spread under the influence of an unseen fluid. Like Roman de Giuli’s work, filmmaker Susi Sie creates macro images that look like ice floes, deserts, and river deltas viewed from above. This similarity of patterns at both large and small scales is a specialty of fluid physics. Just as artists use it to mimic larger flows, scientists use it to study planet-scale problems in the lab. (Video and image credit: S. Sie et al.)
Fediverse Reactions
-

Inside an Alien Atmosphere
Studying the physics of planetary atmospheres is challenging, not least because we only have a handful of examples to work from in our own solar system. So it’s exciting that researchers have unveiled our first look at the 3D structure of an exoplanet‘s atmosphere.
Using ground-based observations, researchers studied WASP-121b, also known as Tylos, an ultra-hot Jupiter that circles its star in only 30 Earth hours. One face of the planet always faces its star while the other faces into space. The team found that the exoplanet has a flow deep in the atmosphere that carries iron from the hot daytime side to the colder night side. Higher up, the atmosphere boasts a super-fast jet-stream that doubles in speed (from an estimated 13 kilometers per second to 26 kilometers per second) as it crosses from the morning terminator to the evening. As one researcher observed, the planet’s everyday winds make Earth’s worst hurricanes look tame. (Image credit: ESO/M. Kornmesser; research credit: J. Seidel et al.; via Gizmodo)
Fediverse Reactions
-

Atmospheric Rivers Raise Temperatures
Atmospheric rivers are narrow streams of moisture-rich air running from tropical regions to mid- or polar latitudes. Though relatively short-lived, they are capable of carrying — and depositing — more water than the largest rivers. But researchers have found that their impact is not measured in water content alone. Instead, a survey of 43 years’ worth of data shows that atmospheric rivers also bring unusually warm temperatures. In some cases, the authors found surface temperatures near an atmospheric river climbed to as high as 15 degrees Celsius above the typical. On average, temperatures were about 5 degrees Celsius higher than expected for the region’s climate.
Several factors raise those temperatures — like the heat released when rising vapor meets cooler air and condenses into liquid — but the biggest effect came from carrying warm tropical temperatures to (usually) cooler regions. (Image credit: L. Dauphin/NASA; research credit: S. Scholz and J. Lora; via Physics Today)
Fediverse Reactions
-
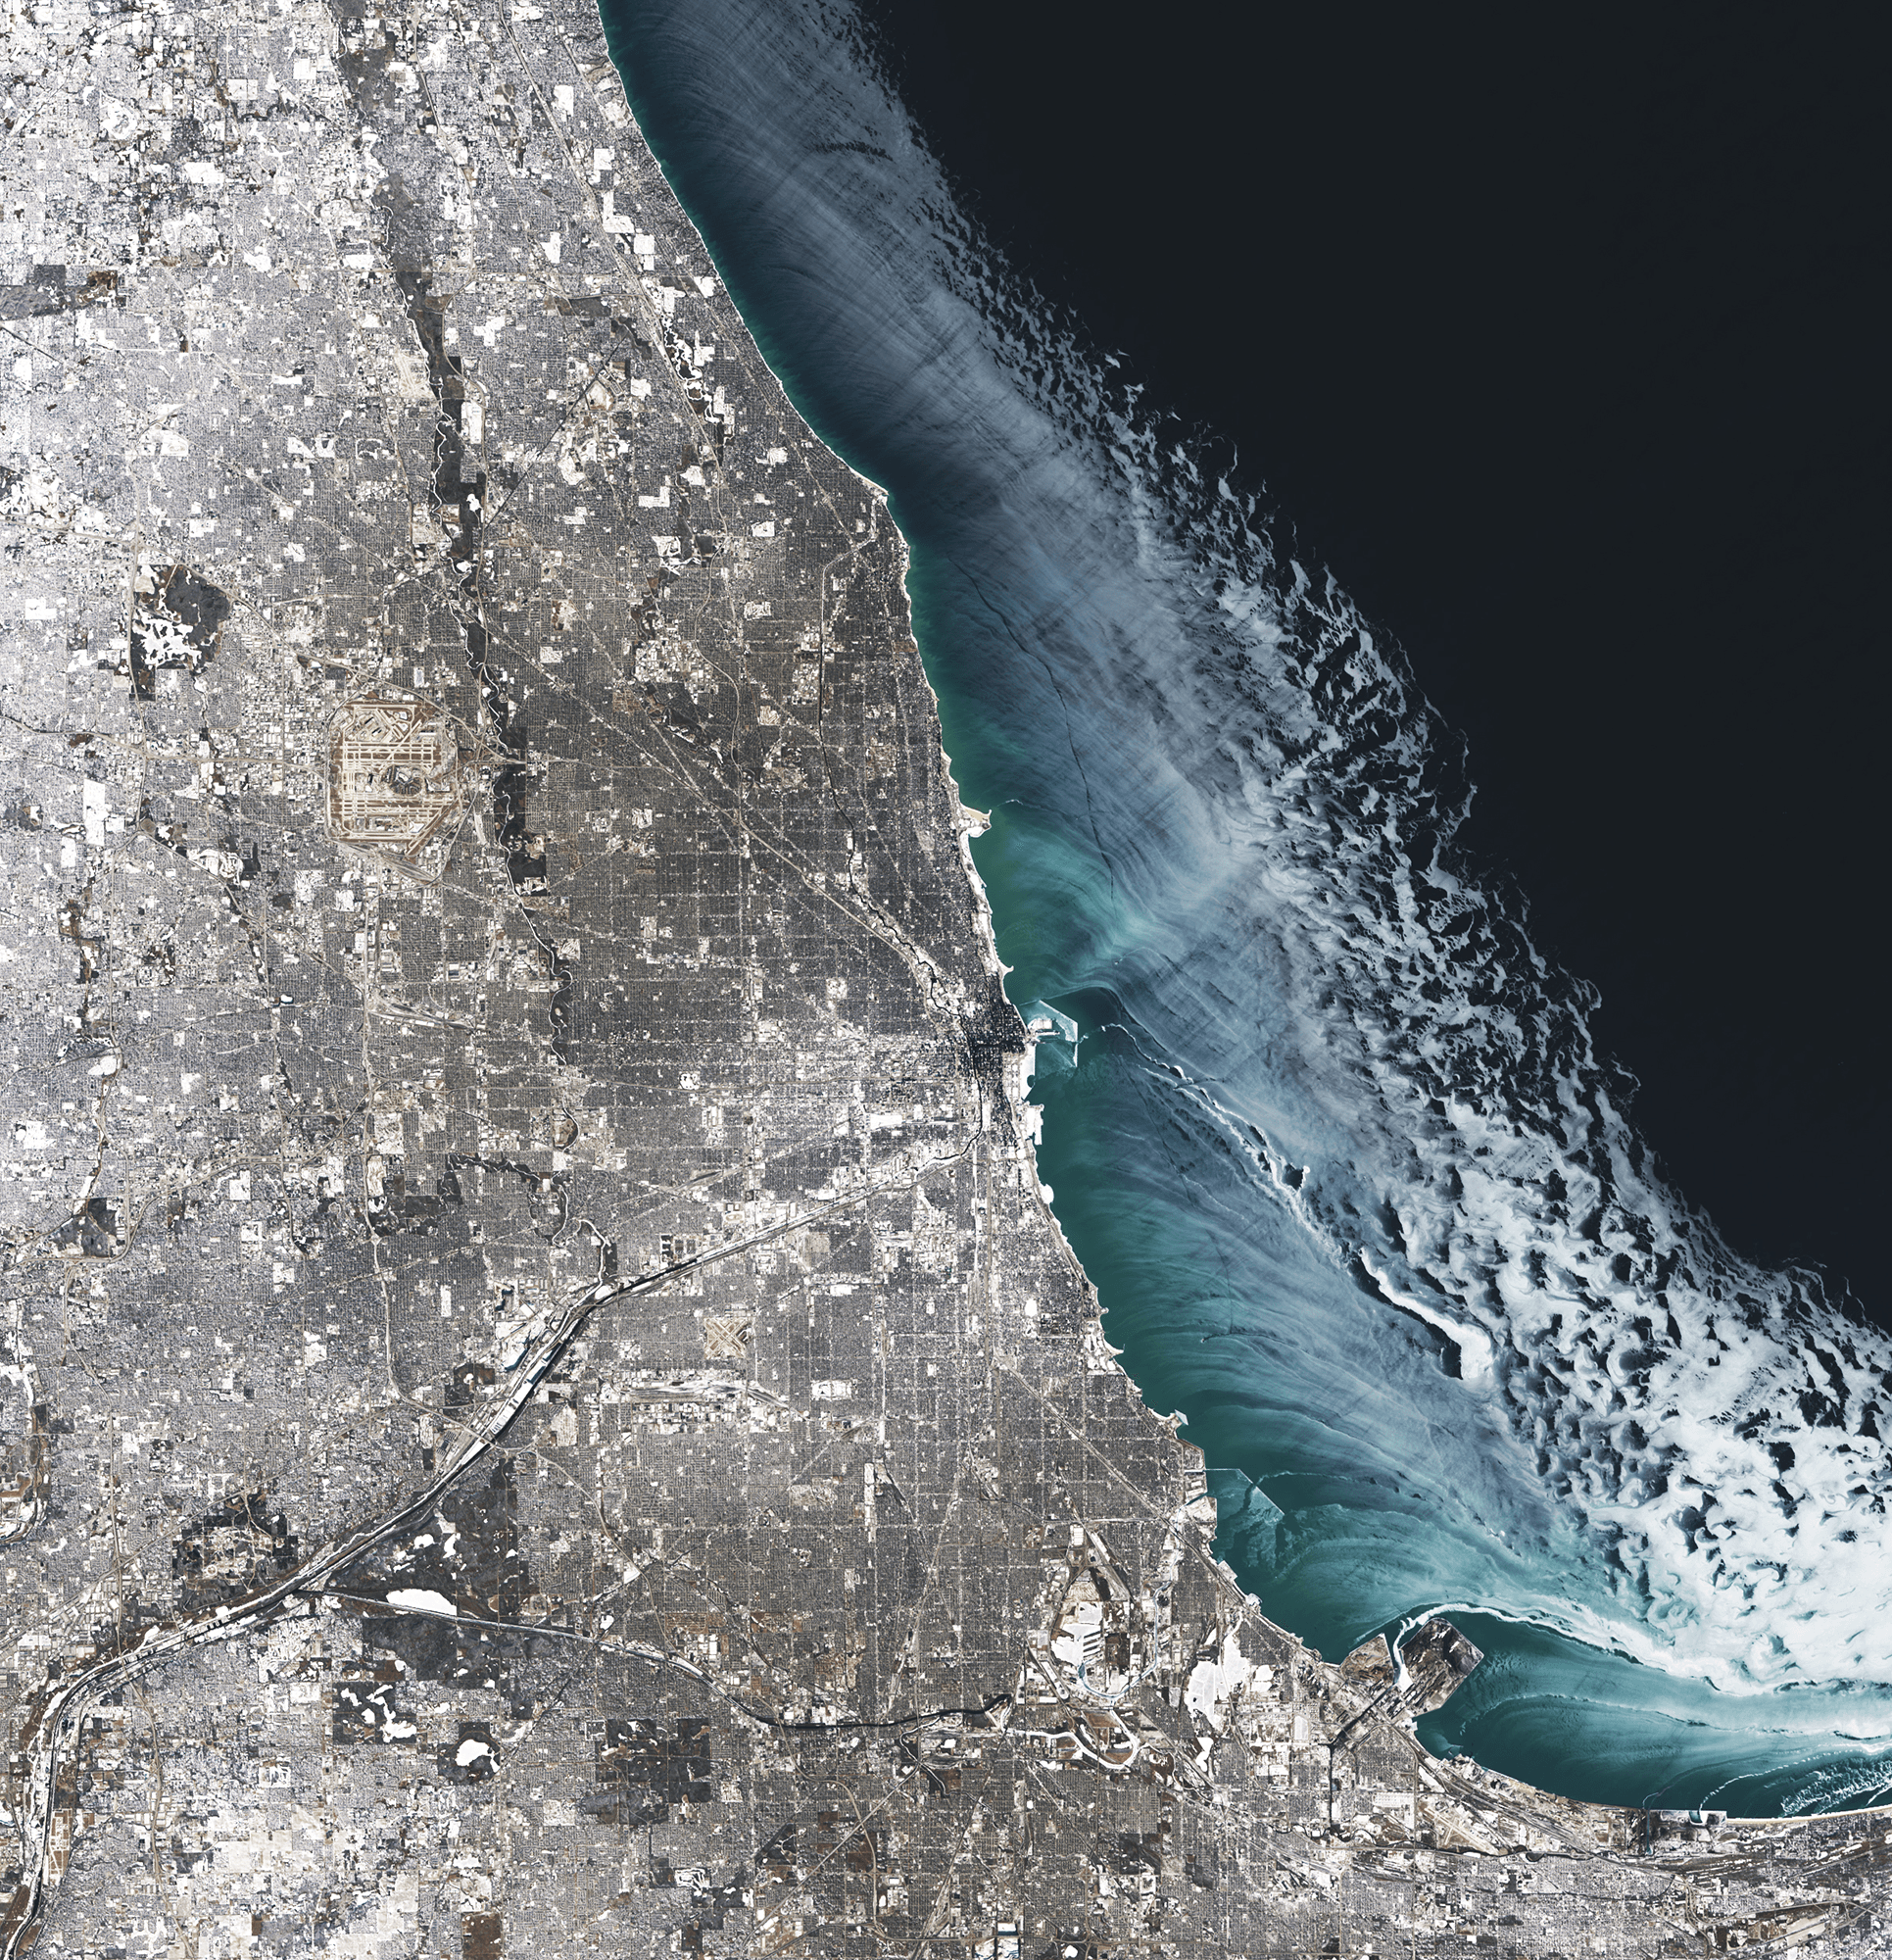
Winter in Chicago
Fresh winter snow blankets Chicago in this satellite image. Over on Lake Michigan, ice dots the coastline out to about 20 kilometers from shore. Darker regions near land mark thinner ice being pushed outward by the wind. Further out, the ice appears white and may be thicker thanks to wind-driven ice piling up. (Image credit: M. Garrison; via NASA Earth Observatory)
Fediverse Reactions
-