
Rub your hands on the handles of a Chinese resonance bowl and you can generate a spray of tiny droplets. The key to this, as the name suggests, is vibration. Rubbing the handles vibrates the bowl, causing small oscillations in the bowl’s shape that are too small for us to see. But those vibrations do produce noticeable ripples on the water in the bowl. When you hit the right frequency and amplitude, those vibrations disturb the water enough that the up-and-down vibration at the surface actually ejects water droplets. The vibration of the bowl affects water near the wall most strongly, which is why that part of the bowl has the strongest reaction. It takes even larger amplitude vibrations to get droplets jumping in the middle of the bowl, but you can see that happening in this video of a Tibetan singing bowl. (Image/video credit: Crazy Russian Hacker, source)
Search results for: “art”
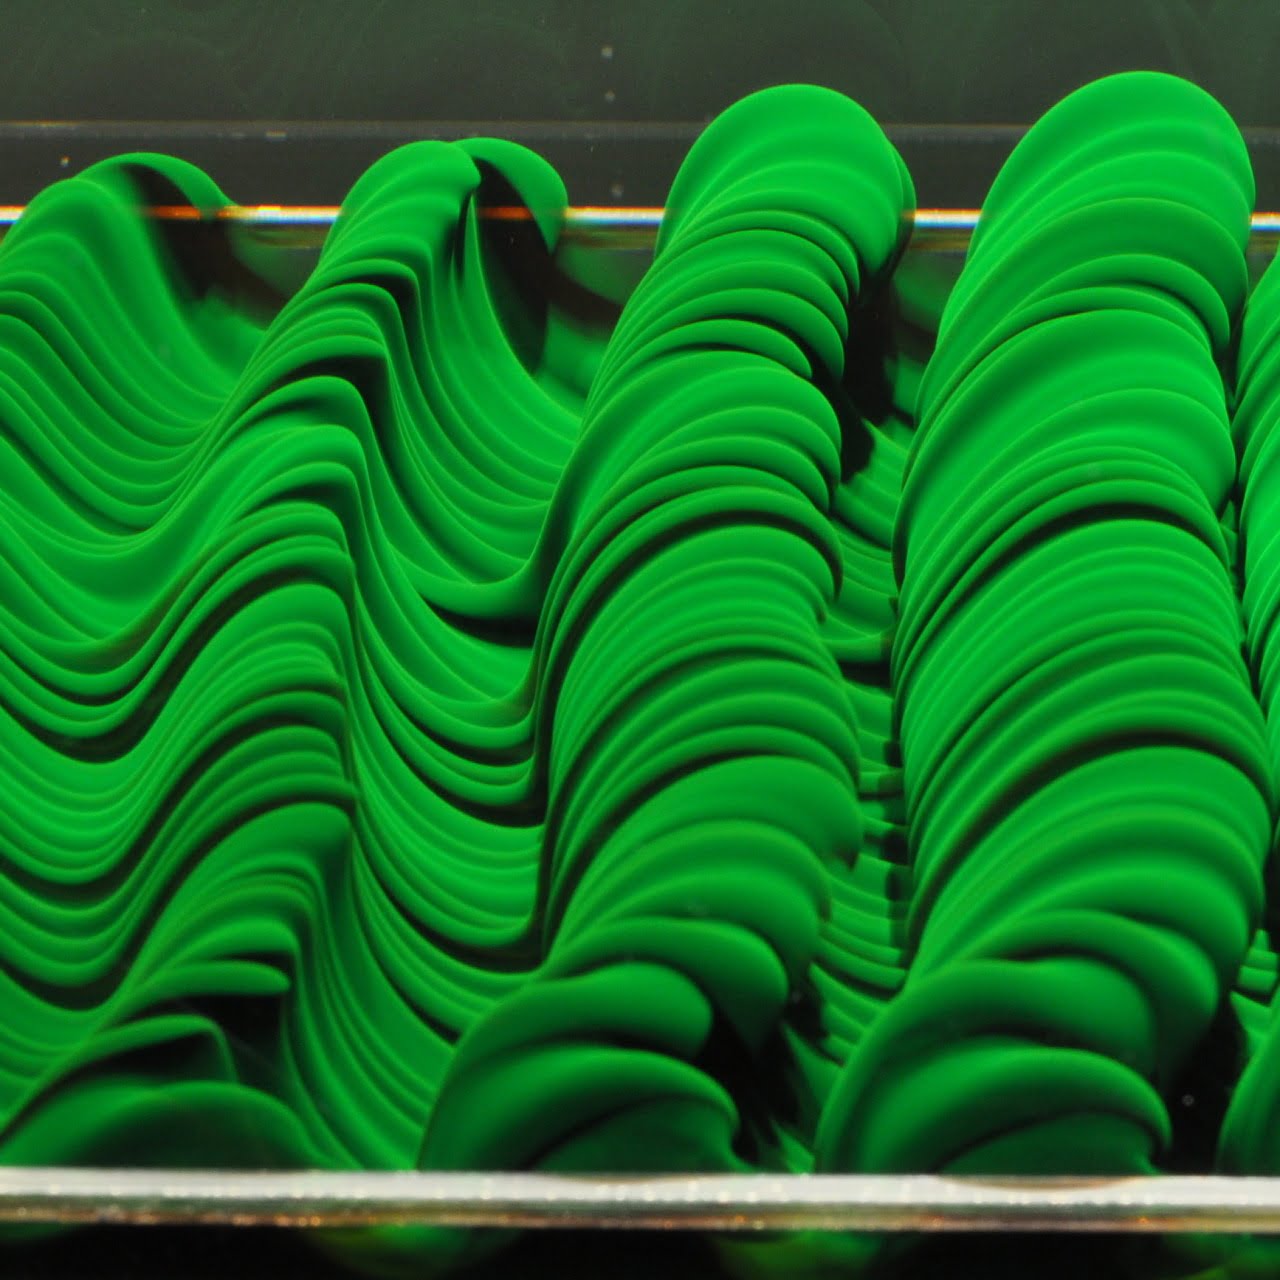
Rayleigh-Taylor Waves
Here on Earth, placing a denser fluid over a lighter one creates an unstable equilibrium. Thanks to gravity, the heavier, denser fluid wants to sink and the lighter fluid wants to rise. Any small disturbance will kick this into action, just like a tiny nudge can send a ball rolling down the hill. For the fluid, that nudge manifests as waviness in the interface between the two fluids. That waviness will quickly grow into billows like those shown above as the Rayleigh-Taylor instability takes over and the heavy (clear) fluid trades places with the lighter (green) fluid. You’ve probably witnessed this effect yourself when pouring milk into iced coffee. To see it in action, check out the video of this experiment or my FYFD video on the Rayleigh-Taylor instability. (Image credit: M. Davies Wykes)

Sublimation
Sublimation is a transition directly from a solid phase to a gaseous one. Given typical Earth atmospheric conditions, one of the most commonly observed examples of sublimation is that of solid carbon dioxide, a.k.a. dry ice. Submerging dry ice in water both speeds up the sublimation–since water is a better conductor of heat than air–and creates ethereal fog that’s a combination of the expanding carbon dioxide and condensate from the water. This gorgeous video from Wryfield Lab lets you admire the process close-up. As the dry ice sublimates, watch for the ice crystals that grow on its surface. This is deposition–the opposite of sublimation–and comes from water vapor freezing onto the dry ice. (Video credit: Wryfield Lab; via Gizmodo)
A warning for those who want to try this at home: only do this in well-ventilated spaces. The shift from solid to gas requires a huge increase in volume. Carbon dioxide is denser than air, so it does stay low to the ground, but you can still suffocate yourself (or children or pets) if you do this in an enclosed space.
A Day in the Life of a Fluid Dynamicist
Today I’m sharing one of my favorite videos from last year’s Gallery of Fluid Motion. It’s a short film entitled “A Day in the Life of a Fluid Dynamicist.” Although some parts of it probably only apply to fluid dynamicists (Navier-Stokes equations, anyone?) a lot of the activities depicted are common to everyone. The film does a nice job of highlighting some of the many examples of fluid dynamics that we come across in our daily lives. As a film by scientists made for scientists, though, you may find some of the terminology obscure. Never fear! This week on FYFD, I’ll be breaking down some of the film’s segments, explaining what they mean, and showing you just how much fluid dynamics you experience every day! (Video credit: S. Reckinger et al.)

Vortices in the Wind
Heard Island, a remote patch of rock in the southwestern Indian Ocean, peeks its head above the marine cloud layer. The volcanic island disrupts the atmosphere enough to generate a von Karman vortex street, a line of alternating vortices shedding from either side of the island. Usually these vortices would march in a straight line downstream from their source. But here strong winds from the south have blown a bunch of its vortices northward, creating an unusual kink in the island’s wake. (Image credit: J. Schmaltz/LANCE EOSDIS Rapid Response; via NASA Earth Observatory)
Paper Marbling
Fluid dynamics and art have gone hand-in-hand for centuries. In this video, artist Garip Ay demonstrates one of the coolest fluids-based art techniques: paper marbling. In this technique, artists float ink or paints on a liquid surface, manipulate the colors as desired–in this case to recreate Van Gogh’s “Starry Night”–and then float a piece of paper atop the surface to transfer the image. Multiple cultures around the world developed marbling techniques, dating all the way back to the Middle Ages. Ay is an expert in ebru, a Turkish form of the art. For more of Ay’s art, check out his website and YouTube channel. (Video credit: G. Ay; via Gizmodo)
Bubble Tricks
[original media no longer available]
Everyone remembers playing with soap bubbles as a child, but most of us probably never became as adept with them as magician Denis Lock. In this video, Lock shows off some of the clever things one can do with surface tension and thin films. My favorite demo starts at 1:25, when he constructs a spinning vortex inside a bubble. He starts with one big bubble and adds a smaller, smoke-filled one beneath it. Then, using a straw, he blows off-center into the large bubble. This sets up some vorticity inside the bubble. When he breaks the film between the two bubbles, the smoke mixes into the already-swirling air in the larger bubble. Then he pokes a hole in the top of the bubble. Air starts rushing out the deflating bubble. As the air flows toward the center of the bubble, it spins faster because of the conservation of angular momentum and a miniature vortex takes shape. (Video credit: D. Lock/Tonight at the London Palladium/ via J. Hertzberg)
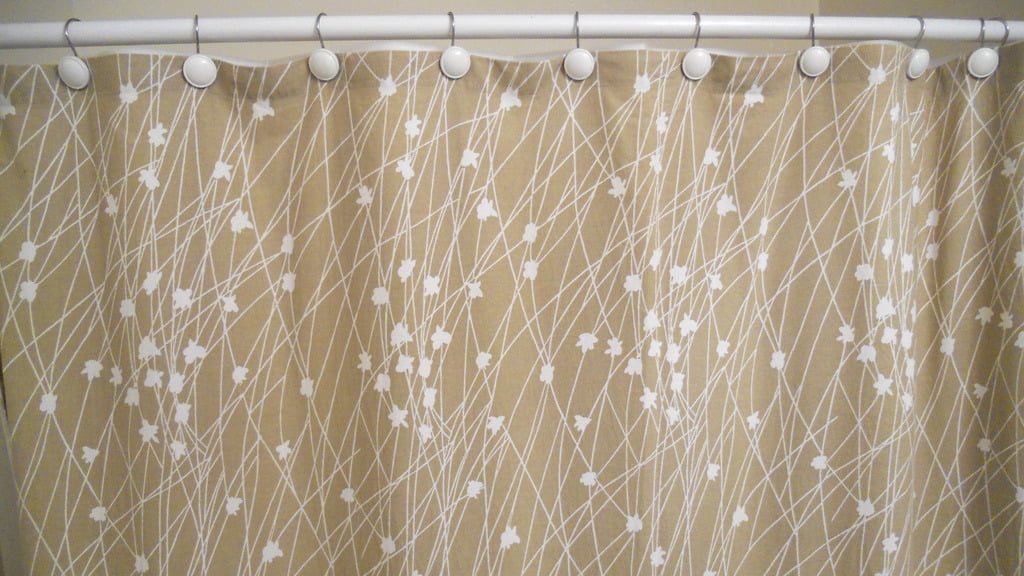
Reader Question: Shower Curtains
Reader thansy asks:
Why do the bottoms of shower curtains drift in toward the water coming from the shower head?
We all know that moment. You’re minding your own business, scrubbing away, and all of a sudden, the shower curtain billows up and grabs you. Scientists have debated the cause of this behavior for years. Some argued that the curtain billowed due to hot air rising from the shower. Others claimed the fast-moving spray caused lift that pulled the curtain up. But fifteen years ago, one scientist tackled the problem computationally. He performed a numerical simulation of a shower head spraying into a bath and found that this spray of droplets creates a weak horizontal vortex in the shower.

This shower vortex has a low-pressure core at the middle, which is thought to provide the suction that causes the shower curtain to billow. The scientist, David Schmidt, was awarded the 2001 Ig Nobel Prize for his work. (Image credits: N. Paix, D. Schmidt; research credit: D. Schmidt)
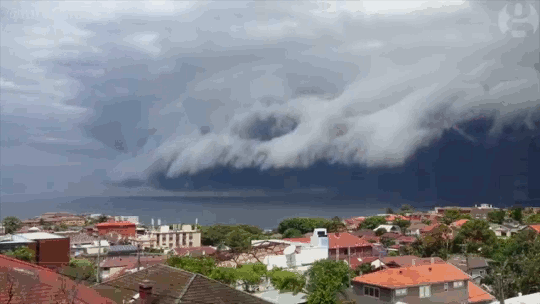
Shelf Cloud

Sydney, Australia was treated to a spectacular meteorological show over the weekend when an impressive shelf cloud swept over the city. These timelapses show the dramatic leading edge of the incoming thunderstorm. Notice how the cloud streams upward along the shelf. The storm is driven by this updraft of warm moist air, which rises until it is capped by the troposphere. At this point, the air spreads, creating an anvil-like shape, and cools. The moisture drawn up at the storm’s front will condense, freeze, and fall as rain or hail. When the updraft weakens, the storm will be dominated by the downdraft of the falling precipitation and eventually peter out. (Image credit: W. Reed and H. Vann, source; via J. Hertzberg)

Drawing Up Dew


Desert plants have evolved to efficiently collect and capture whatever water they can. Each leaf of the moss Syntrichia caninervis ends in a hairlike fiber called an awn (seen in white in the top image). Tiny as they are, awns are vital to the moss’s water collection, correlating to more than 20% of their dew collection. Extremely tiny grooves on the surface of the awn provide nucleation sites where dew condensed from fog collects. Once a droplet forms on the awn, it grows larger as more fog condenses (middle image). When the droplet grows large enough, the conical shape of the awn will cause surface tension to draw the droplets along the awn and toward the leaf (bottom image).
(Credits: Syntrichia caninervis moss image – M. Lüth; videos and research – Z. Pan et al., Supplementary Videos 3 and 4; h/t to T. Truscott)