A cylinder standing upright in a flow creates a complicated system of vortices and recirculation. In the photo above, the flow is left to right. The cylinder itself is somewhat hard to see but is located in the center of the image; we see it from above. The colored streaks of dye show the flow path around the cylinder. In yellow, we see a spiraling vortex that forms just ahead of the cylinder and stretches downstream on either side. Because of its shape, this is called a horseshoe vortex. Its sense of rotation is such that it tends to pick up loose material in front of the cylinder; in other words, it can erode that area. This is often seen around the pilings of bridge supports and must be accounted for in designs. You also see the effects of this horseshoe vortex digging out material at the base of trees after snowfalls in areas with a dominant wind direction, and here’s an example with a snow roller. (Image credit: H. Werlé; via eFluids)
Category: Phenomena

Burning a Rocket Underwater
In a recent video, Warped Perception filmed a model rocket engine firing underwater. Firstly, it’s no surprise that the engine would still operate underwater (after its wax waterproofing). The solid propellant inside the engine is a mixture of fuel and oxidizer, so it has all the oxygen it needs. Fluid dynamically speaking, though, this high-speed footage is just gorgeous.
Ignition starts at about 3:22 with some cavitation as the exhaust gases start flowing. Notice how that initial bubble dimples the surface when it rises (3:48). At the same time, the expanding exhaust on the right side of the tank is forcing the water level higher on that side, triggering an overflow starting at about 3:55. At this point, the splashes start to obscure the engine somewhat, but that’s okay. Watch that sheet of liquid; it develops a thicker rim edge and starts forming ligaments around 4:10. Thanks to surface tension and the Plateau-Rayleigh instability, those ligaments start breaking into droplets (4:20). A couple seconds later, holes form in the liquid sheet, triggering a larger breakdown. By 4:45, you can see smoke-filled bubbles getting swept along by the splash, and larger holes are nucleating in that sheet.

The second set of fireworks comes around 5:42, when the parachute ejection charge triggers. That second explosive triggers a big cavitation bubble and shock wave that utterly destroys the tank. If you look closely, you can see the cavitation bubble collapse and rebound as the pressure tries to adjust, but by that point, the tank is already falling. Really spectacular stuff! (Video and image credit: Warped Perception)

Impressionist Gibraltar
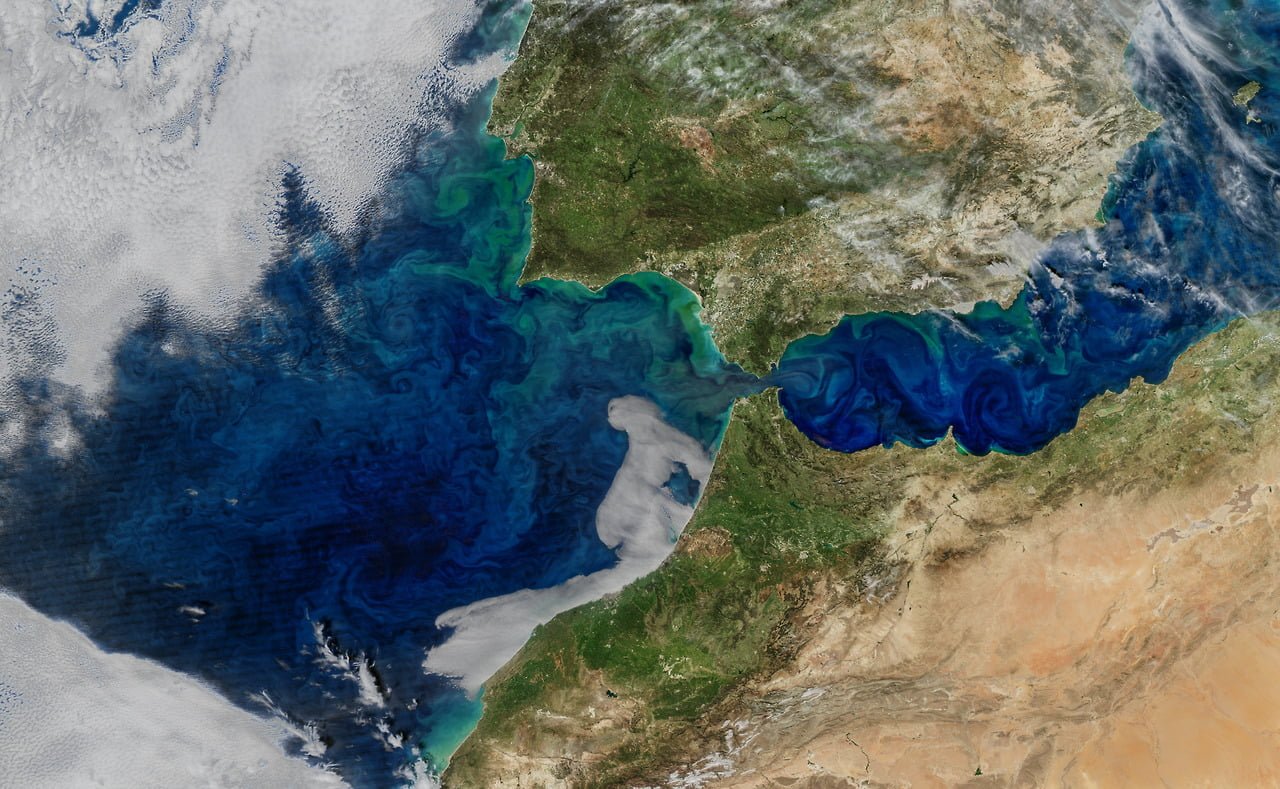
Swirls of phytoplankton make this satellite image of Gibraltar look like an Impressionist painting. The photo is a composite of data from several instruments, with colors enhanced to highlight features of the phytoplankton blooms. The tiny plankton act as tracer particles that reveal some of the complex flow between the North Atlantic and the Mediterranean. Although narrow, the Strait at Gibraltar has deep and complex terrain that was formed during a breach flood event millions of years ago. Water flowing through that terrain sets up enormous and complicated waves well beneath the ocean surface. These drive some of the turbulence that we see here as the blue swirls east of the Strait. (Image credit: NASA/N. Kurig; via NASA Earth Observatory)
Kelvin-Helmholtz Instability
Sixty Symbols has a great new video explaining the laboratory set-up for demoing a Kelvin-Helmholtz instability. You can see a close-up from the demo above. Here the pink liquid is fresh water and the blue is slightly denser salt water. When the tank holding them is tipped, the lighter fresh water flows upward while the salt water flows down. This creates a big velocity gradient and lots of shear at the interface between them. The situation is unstable, meaning that any slight waviness that forms between the two layers will grow (exponentially, in this case). Note that for several long seconds, it seems like nothing is happening. That’s when any perturbations in the system are too small for us to see. But because the instability causes those perturbations to grow at an exponential rate, we see the interface go from a slight waviness to a complete mess in only a couple of seconds. The Kelvin-Helmholtz instability is incredibly common in nature, appearing in clouds, ocean waves, other planets’ atmospheres, and even in galaxy clusters! (Image and video credit: Sixty Symbols)

How Smoke Rings Work
Vortices are a ubiquitous part of life, whether they’re draining down your bathtub or propelling underwater robots. In the latest video from the Lib Lab project, you can learn about how vortex rings form, what makes them last so long, and even make a vortex generator of your own. I can personally attest that vortex cannons are good for hours of entertainment, no matter your age. They’re even more fun with friends, as the Oregon State drumline demonstrates in the video. Want even more vortex fun? Check out leapfrogging vortices, vortex rings colliding head-on, and a giant 3 meter wide vortex cannon in action. (Video and image credit: Lib Lab)

Hagfish Crash
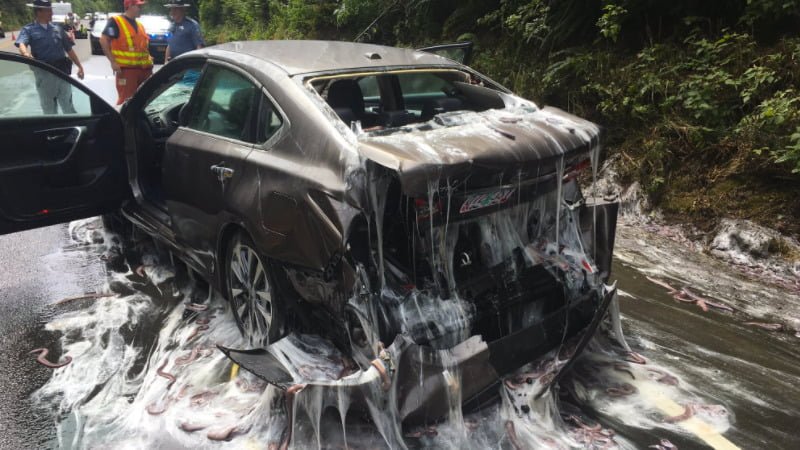
Last week a flatbed truck in Oregon overturned and released 3400 kilograms of live hagfish on the highway and nearby cars. Hagfish are eel-like fish known for their impressive slime production. When threatened, the hagfish produce mucins that, when combined with water, form an extremely viscoelastic mucus. As it’s stretched, the mucus thickens and becomes more viscous. Normally, hagfish use this property to clog the gills of fish trying to eat them. The slime is weak, however, to shearing; hagfish actually tie themselves in knots to slide the slime off when there’s too much of it. The Oregon Department of Transportation managed to clear the road of mucus (and hagfish) using bulldozers and fire hoses, but it did take them several hours. For more photos and videos from the incident, check out Gizmodo and the Oregon State Police Twitter feed. (Image credit: Oregon State Police; via Gizmodo)

The Winds of Mars
The Martian atmosphere is scant compared to Earth’s, but its winds still sculpt and change the surface regularly. The average atmospheric pressure on Mars is only 0.6% of Earth’s, and the density is similarly low at 1.7% of Earth’s. Despite this thinness, Martian winds are still substantial enough to shift sands on a daily basis, as shown above. These two images were taken one Martian day apart, showing how sand ripples moved and how the Curiosity rover’s tracks can be quickly obscured. Part of the reason Mars’ scant atmosphere is still so good at moving sand is that Martian gravity is roughly one-third of ours; if the sand is lighter, it doesn’t take as much force to move! (Image credit: NASA/JPL-CALTECH/MSSS)
How Hummingbirds Drink

Hummingbirds are incredible acrobatic fliers, capable of hovering for more than 30 seconds at a time, even in windy conditions. Their feeding habits are equally impressive. Many species of hummingbirds have a forked tongue, each half of which curls over like a partial straw. As the bird extends its tongue, its beak compresses the space inside the tongue’s curls. Once in the nectar, both halves of the tongue re-expand, pulling liquid in along the full length of the tongue. For the birds, this is a much faster technique than simply sucking the nectar up like a straw. Hummingbirds can lick nectar more than ten times a second this way. For more gorgeous imagery of hummingbirds, be sure to check out National Geographic’s full feature. (Image credit: A. Varma, source; via Aarthi S.)

Slipping Through a Soap Film
A droplet falling at high speed can pass through a soap film without breaking it. On impact, the drop stretches the soap film and ultimately only passes through by getting coated with a thin shell of soap film fluid. That liquid shell is separated from the original droplet by an extremely thin air layer. This air layer isn’t typically visible, but we know that it’s there from what happens when that soap-film-shelled droplet later impacts a liquid pool. As seen above, the droplet sits on the surface until the soap film shell coalesces with the pool. This sucks the drop under, but the drop itself does not coalesce. Instead it becomes an antibubble – a submerged liquid drop surrounded by a shell of air. (Image credit: J. Zou et al., source)

Cycling Skinsuits and Vortex Generators


It didn’t take long for an aerodynamic controversy to crop up in this year’s Tour de France. At the 14km individual time trial, riders from Team Sky wore custom Castelli skinsuits with integrated dot-like patterns on their upper arms (shown above). By the next day, a sports scientist with a competing team cried foul play, claiming that these fabrics could have given Team Sky as much as 25 seconds’ advantage over other riders. The Sky team finished with 4 out of the top 10 places on the time trial, and their leader, three-time Tour winner Chris Froome, finished some 35 seconds ahead of his expected competitors for the yellow jersey.
Vortex generators explained
So how could a few dots make a measurable difference? These protrusions are vortex generators meant to modify flow around a cyclist. Humans are not aerodynamic and what typically happens when air flows over a cyclist’s arms is shown in the flow visualization above: the air follows the curve of the arm part way, then it separates from the body, leaving a region of recirculation that increases drag. Vortex generators can help prevent or delay that drag-inducing flow separation by adding extra energy and turbulence to the air near the arm’s surface. Because turbulent boundary layers can follow a curve longer before separating, this helps reduce the drag by reducing the recirculation zone.
About that time savings
Aerodynamically speaking, those vortex generators can make a difference, but the question is, how much? In his complaint, Grappe cites a 2016 paper by L. Brownlie et al. that wind-tunnel tested different vortex generator patterns for use in running apparel. The speeds tested included those relevant to cycling. The specific numbers Grappe quotes aren’t directly relevant, however:
As noted above, race garments that contain VG provide reductions in Fd of between 3.7 and 6.8% compared to equivalent
advanced race apparel developed for the 2012 London Olympics which in turn provided substantially lower drag than
conventional race apparel.the effectiveness of 5, 10 and 15 cm wide strips of VG applied to each flank of a sleeveless singlet revealed that the 5 cm wide
strips provided between 3.1 and 7.1% less Fd than the 10 cm wide strips and between 1.9 and 4.3% less Fd than the 15 cm wide
strips.Here Brownlie et al. are specifically describing the savings for running apparel, which uses vortex generators in very different places than you would on a cyclist. Note the second quote even refers to a sleeveless singlet, so the vortex generators measured are definitely not in the same place as these skinsuits!
The bottom line
I fully expect that vortex generators give a marginal aerodynamic edge, which is why Sky and other teams have already been using them in competition. But I hesitate to declare that the savings is as high as 5-7%, and I have no way to verify Grappe’s subsequent claims that this translates to 18-25 seconds in the time trial. Those are numbers he gives without citing what model is being used to translate drag gains into time.
In the end, what is needed is clarification of the rules. As they stand, one rule seems to allow the skinsuits because the vortex generators are integrated into the fabric, whereas another states clothing is forbidden “to influence the performances of a rider such as reducing air resistance”. Those two stances seems contradictory, and, for now, the race officials’ verdict to allow the suits stands.
If you want to learn more about aerodynamics and cycling, be sure to check out my latest FYFD video. (Image credits: B. Tessier/Reuters; Getty Images; L. Brownlie et al. 2009; h/t to W. Küper)