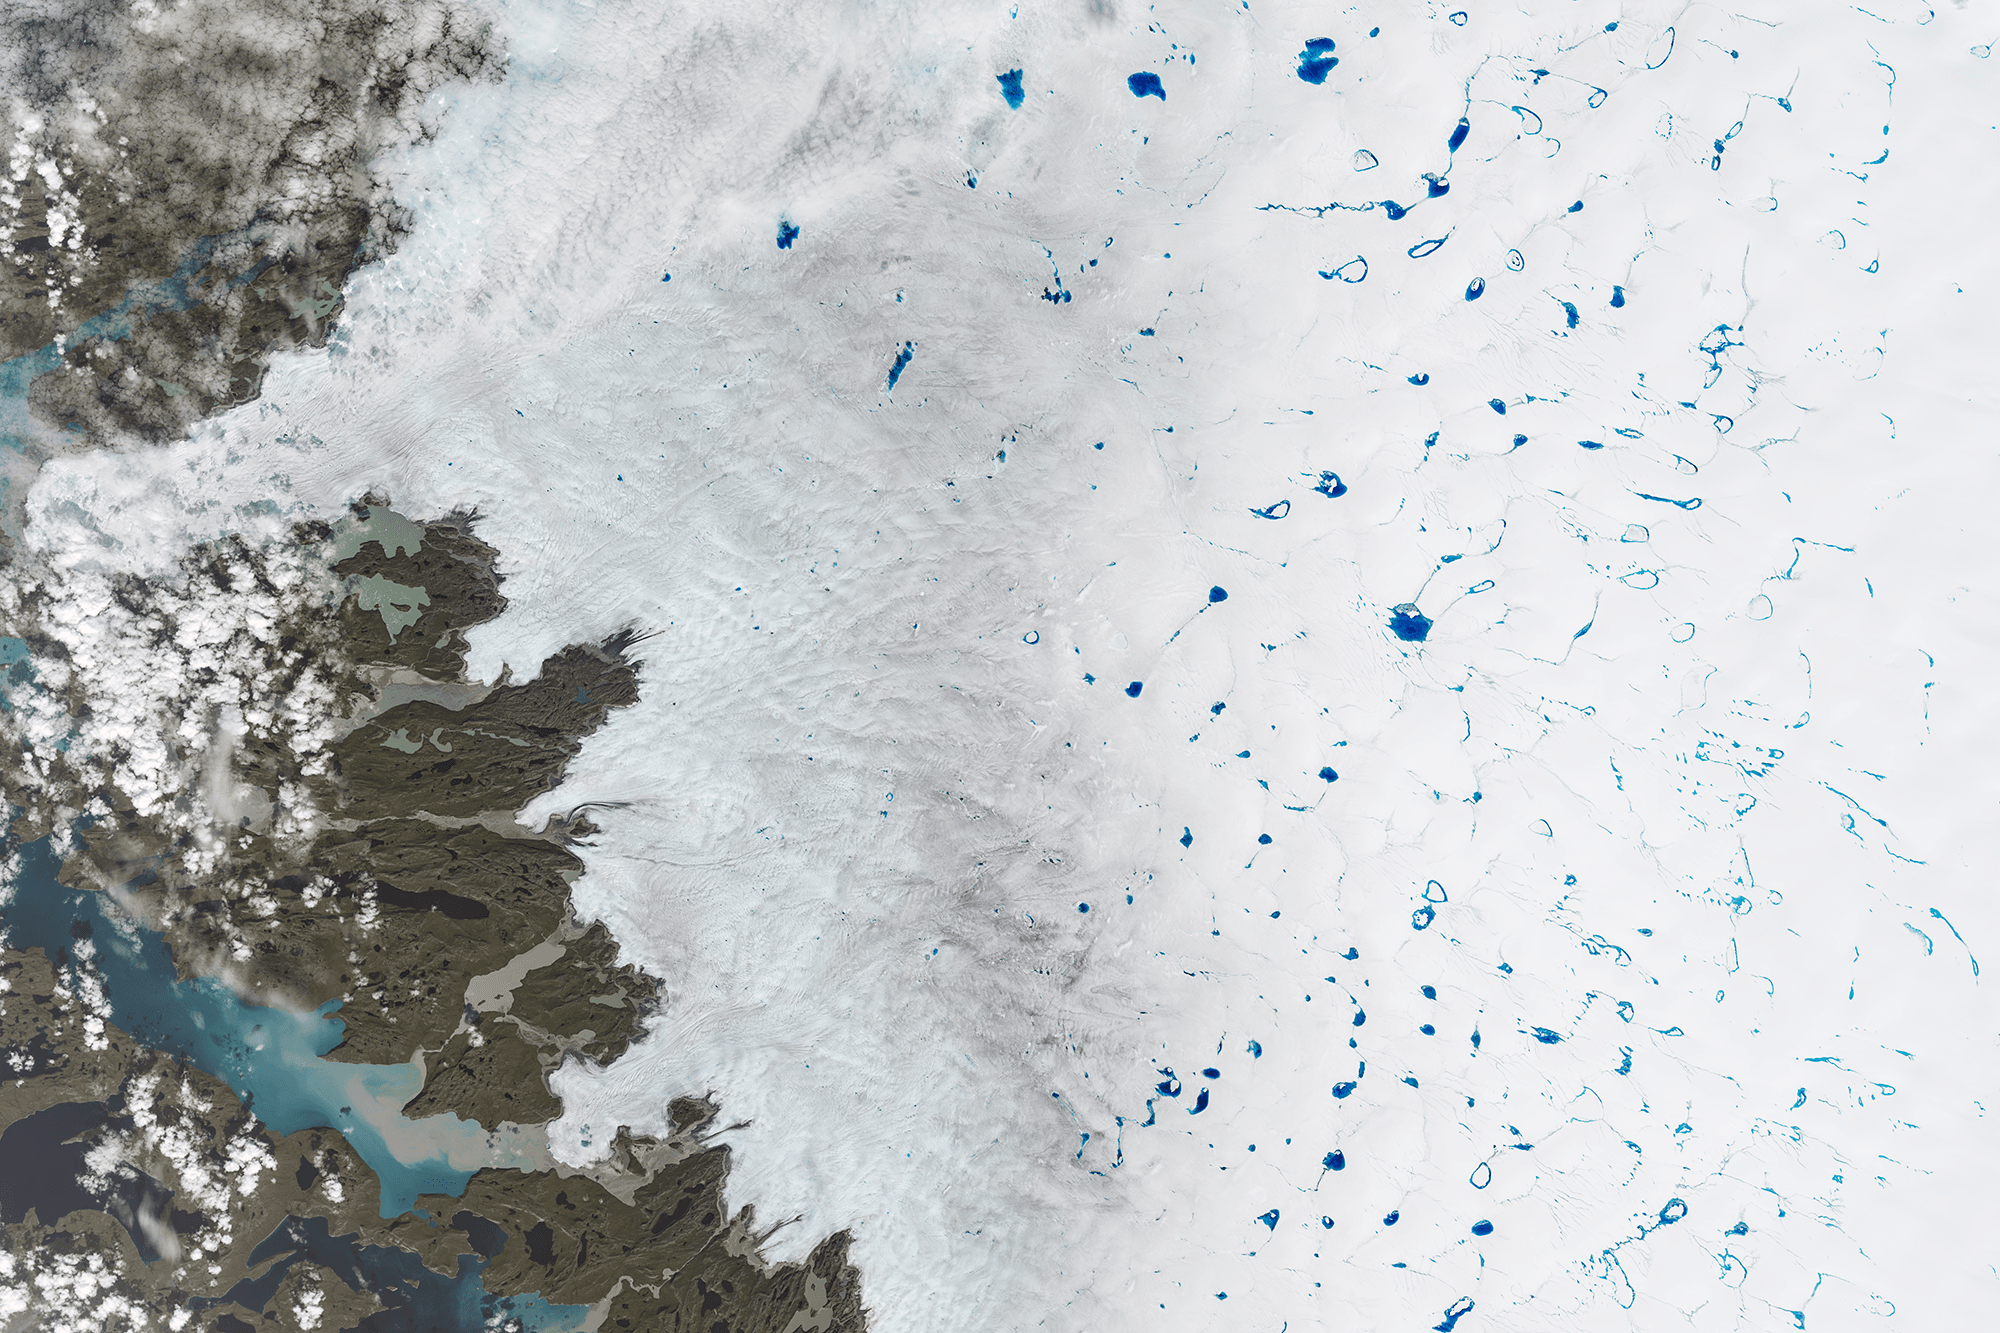
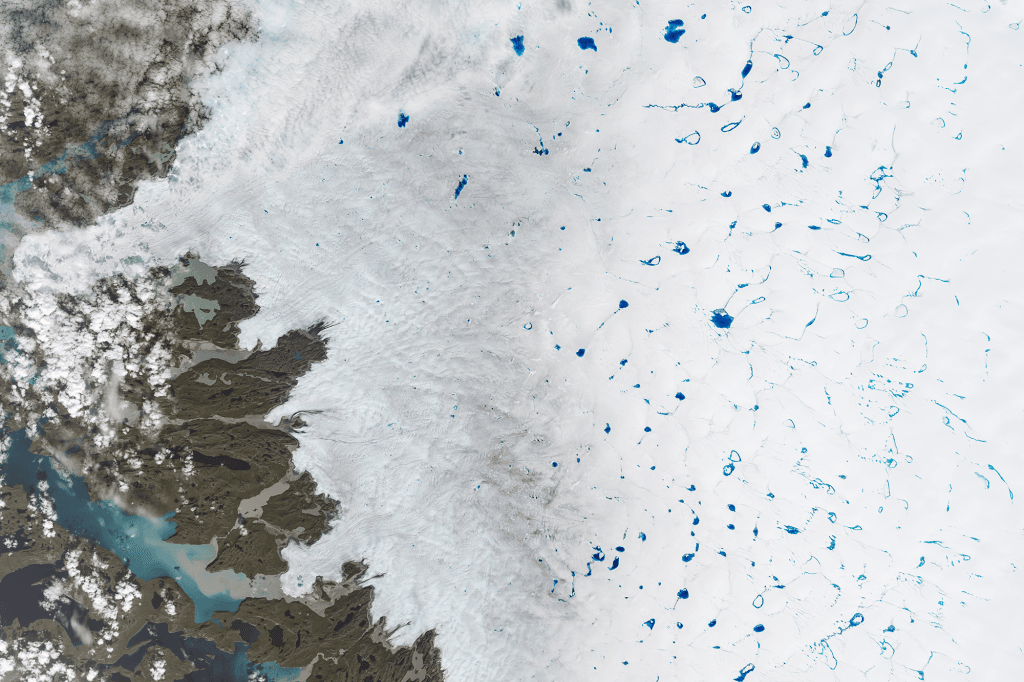
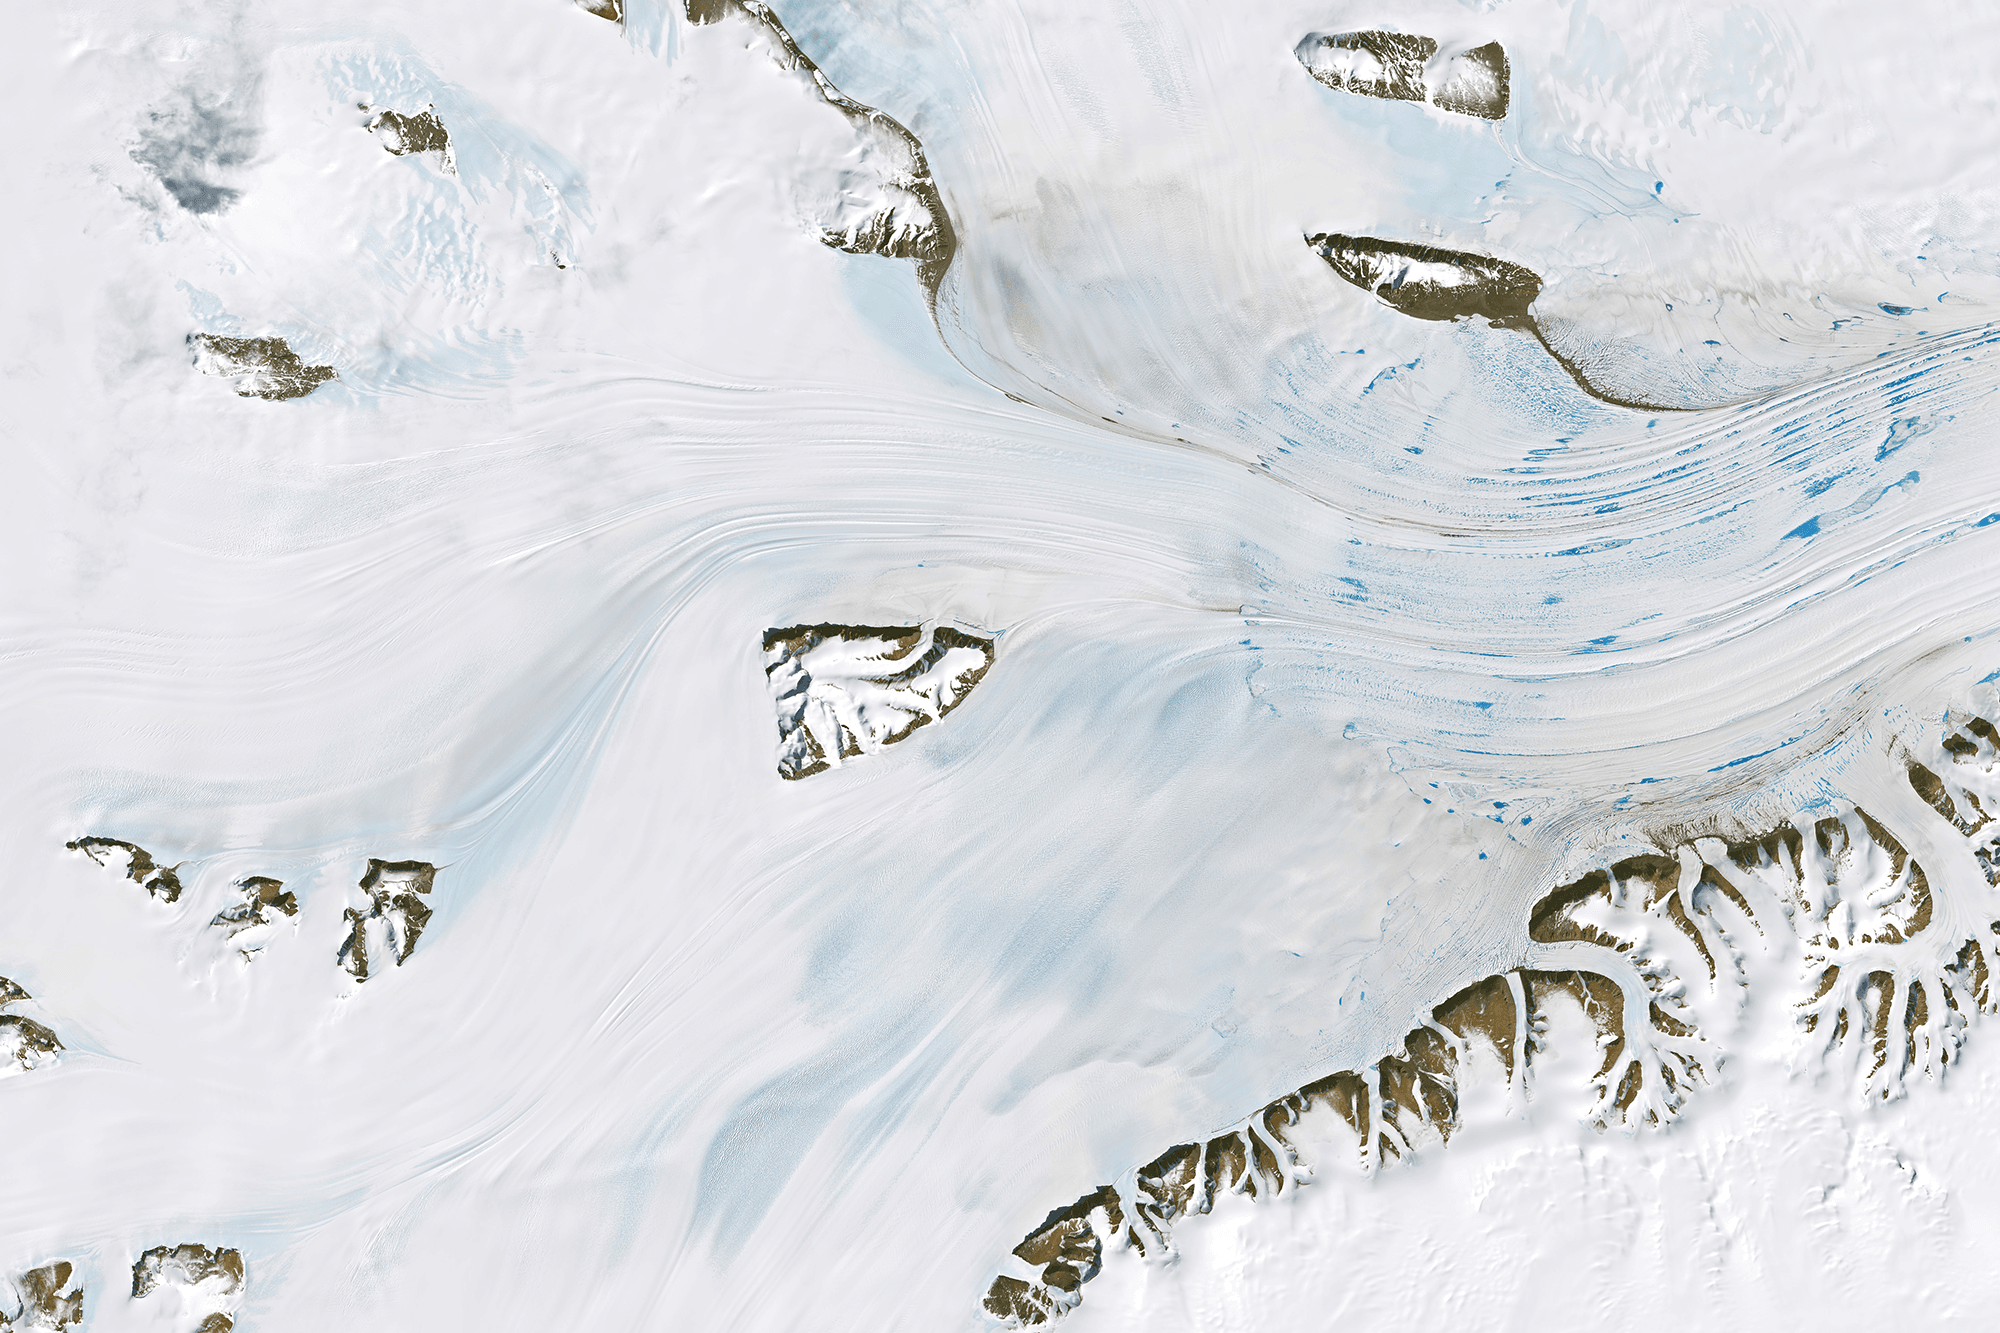
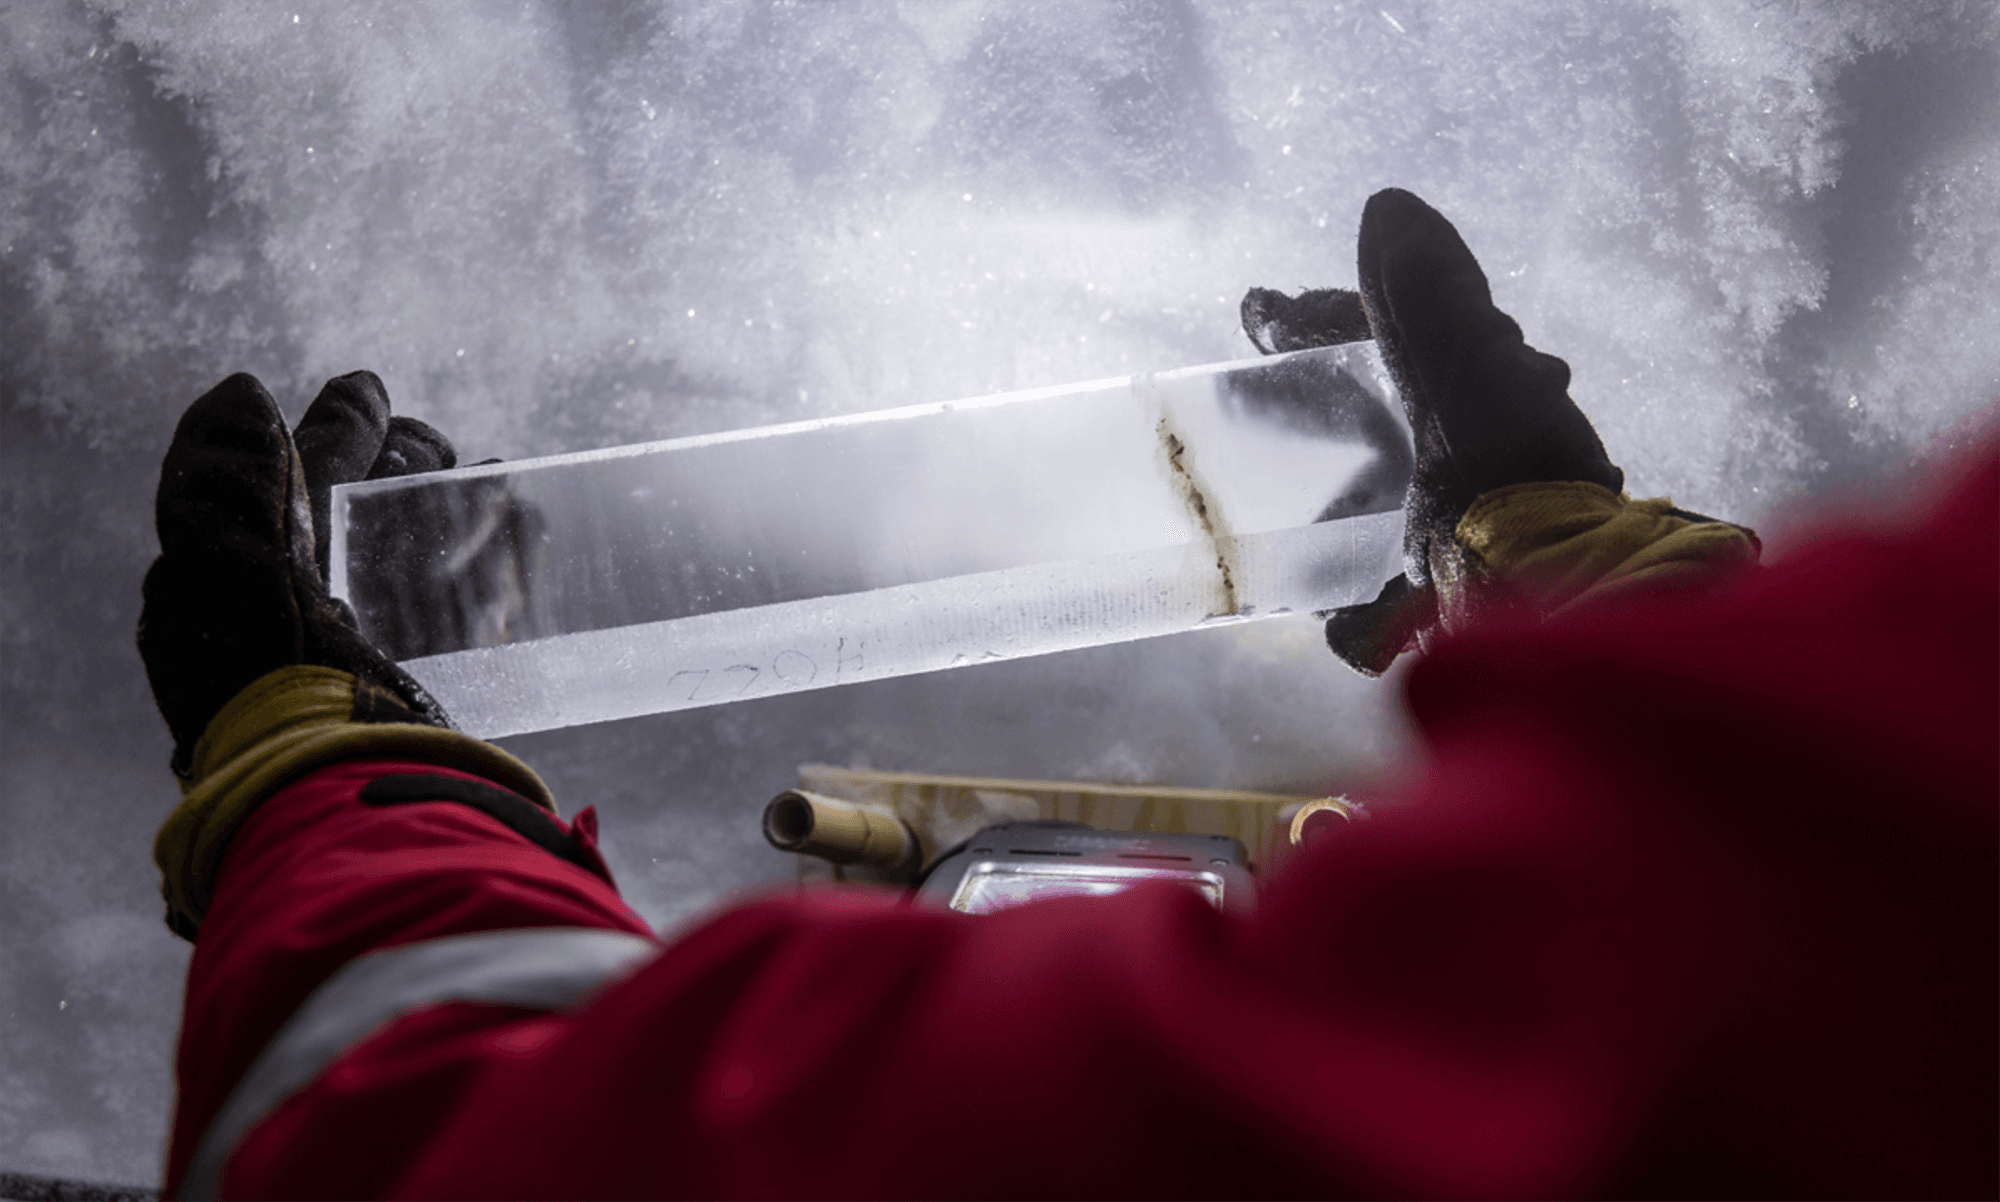
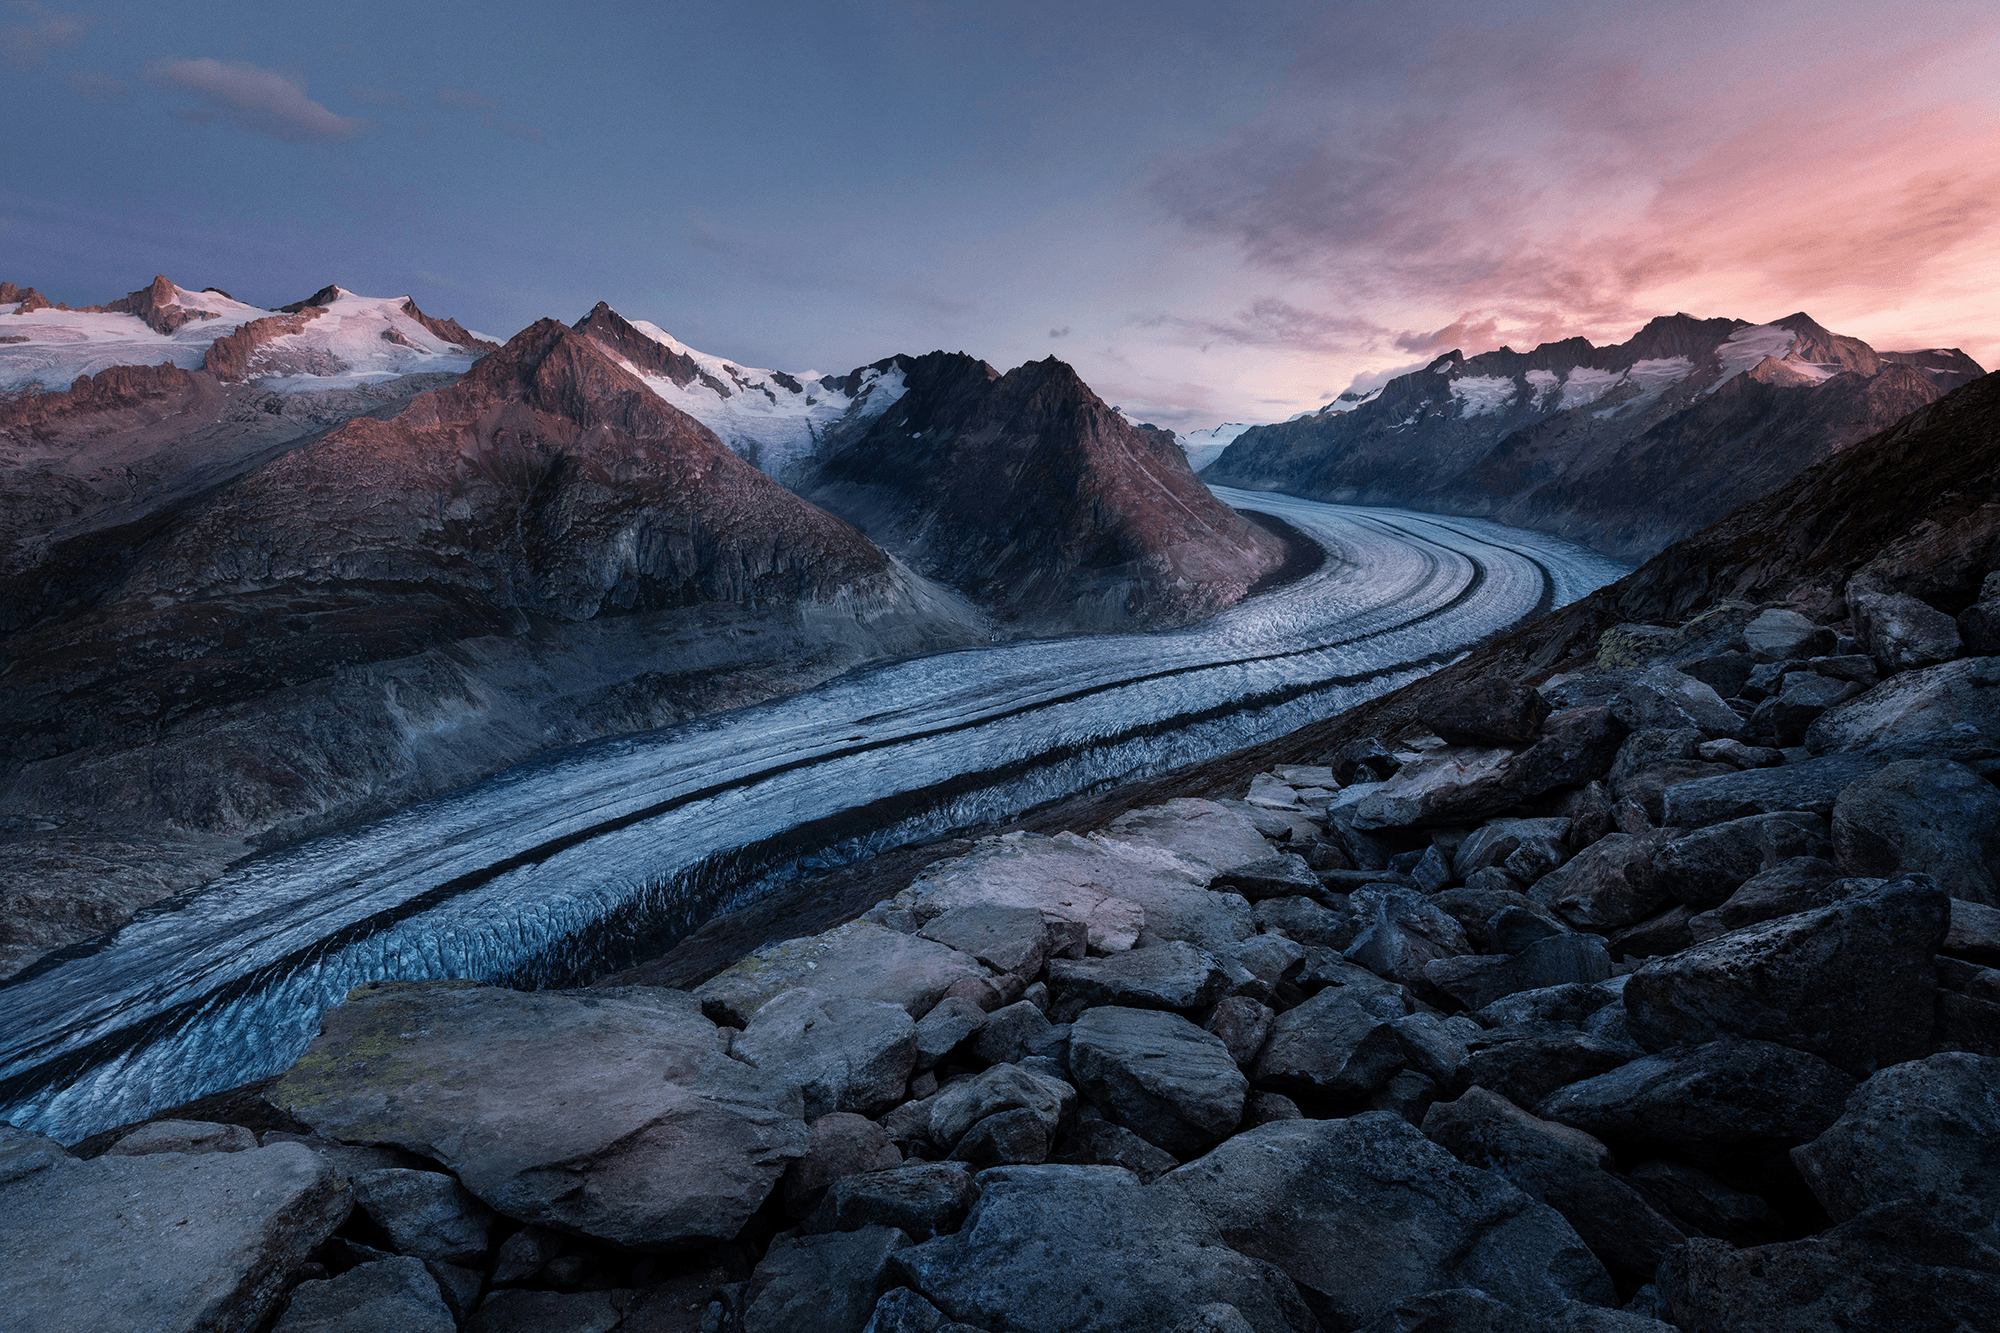
Glacier-fed rivers are often rich in colorful sediments. Here, photographer Jan Erik Waider shows us Iceland’s glacial rivers flowing primarily in shades of blue. While the wave action and diffraction in these videos is great, the real star is the turbulent mixing where turbid and clearer waters meet. Watch those boundaries, and you’ll see shear from flows moving at different speeds which feeds the ragged, Kelvin-Helmholtz-unstable edge between colors. (Video and image credit: J. Waider; via Laughing Squid)
Tag: glacier

Geoengineering Trials Must Consider Unintended Costs
As the implications of climate change grow more dire, interest in geoengineering–trying to technologically counter or mitigate climate change–grows. For example, some have suggested that barriers near tidewater glaciers could restrict the inflow of warmer water, potentially slowing the rate at which a glacier melts. But there are several problems with such plans, as researchers point out.
Firstly, there’s the technical feasibility: could we even build such barriers? In many cases, geoengineering concepts are beyond our current technology levels. Burying rocks to increase a natural sill across a fjord might be feasible, but it’s unclear whether this would actually slow melting, in part because our knowledge of melt physics is woefully lacking.
But unintended consequences may be the biggest problem with these schemes. Researchers used existing observations and models of Greenland’s Ilulissat Icefjord, where a natural sill already restricts inflow and outflow from the fjord, to study downstream implications. Right now, the fjord’s discharge pulls nutrients from the deep Atlantic up to the surface, where a thriving fish population supports one of the country’s largest inshore fisheries. As the researchers point out, restricting the fjord’s discharge would almost certainly hurt the fishing industry, at little to no benefit in stopping sea level rise.
Because our environment and society are so complex and interconnected, it’s critical that scientists and policymakers carefully consider the potential impacts of any geoengineering project–even a relatively localized one. (Research and image credit: M. Hopwood et al.; via Eos)

Glacier Timelines

Over the past 150 years, Switzerland’s glaciers have retreated up the alpine slopes, eaten away by warming temperatures induced by industrialization. But such changes can be difficult for people to visualize, so artist Fabian Oefner set out to make these changes more comprehensible. These photographs — showing the Rhone and Trift glaciers — are the result. Oefner took the glacial extent records dating back into the 1800s and programmed them into a drone. Lit by LED, the drone flew each year’s profile over the mountainside, with Oefner capturing the path through long-exposure photography. When all the paths are combined, viewers can see the glacier’s history written on its very slopes. The effect is, fittingly, ghost-like. We see a glimpse of the glacier as it was, laid over its current remains. (Image credit: F. Oefner; video credit: Google Arts and Culture)

Ponding on the Ice Shelf
Glaciers flow together and march out to sea along the Amery Ice Shelf in this satellite image of Antarctica. Three glaciers — flowing from the top, left, and bottom of the image — meet just to the right of center and pass from the continental bedrock onto the ice-covered ocean. The ice shelf is recognizable by its plethora of meltwater ponds, which appear as bright blue areas. Each austral summer, meltwater gathers in low-lying regions on the ice, potentially destabilizing the ice shelf through fracture and drainage. This region near the ice shelf’s grounding line is particularly prone to ponding. Regions further afield (right, beyond the image) are colder and drier, often allowing meltwater to refreeze. (Image credit: W. Liang; via NASA Earth Observatory)

“Visions in Ice”
The glittering blue interior of an ice cave sparkles in this award-winning image by photographer Yasmin Namini. The cave is underneath Iceland’s Vatnajokull Glacier. Notice the deep scallops carved into the lower wall. This shape is common in melting and dissolution processes. It is unavoidable for flat surfaces exposed to a melting/dissolving flow. (Image credit: Y. Namini/WNPA; via Colossal)

Slipping Ice Streams
The Northeast Greenland Ice Stream provides about 12% of the island’s annual ice discharge, and so far, models cannot accurately capture just how quickly the ice moves. Researchers deployed a fiber-optic cable into a borehole and set explosive charges on the ice to capture images of its interior through seismology. But in the process, they measured seismic events that didn’t correspond to the team’s charges.
Instead, the researchers identified the signals as small, cascading icequakes that were undetectable from the surface. The quakes were signs of ice locally sticking and slipping — a failure mode that current models don’t capture. Moreover, the team was able to isolate each event to distinct layers of the ice, all of which corresponded to ice strata affected by volcanic ash (note the dark streak in the ice core image above). Whenever a volcanic eruption spread ash on the ice, it created a weaker layer. Even after hundreds more meters of ice have formed atop these weaker layers, the ice still breaks first in those layers, which may account for the ice stream’s higher-than-predicted flow. (Image credit: L. Warzecha/LWimages; research credit: A. Fichtner et al.; via Eos)

Tracking Meltwater Through Flex
Greenland’s ice sheet holds enough water to raise global sea levels by several meters. Each year meltwater from the sheet percolates through the ice, filling hidden pools and crevasses on its way to draining into the sea. Monitoring this journey directly is virtually impossible; too much goes on deep below the surface and the ice sheet is a precarious place for scientists to operate. So, instead, they’re monitoring the bedrock nearby.
Researchers used a network of Global Navigation Satellite System (GNSS) stations like the one above to track how the ground shifted and flexed as meltwater collected and moved. They found that the bedrock moved as much as 5 millimeters during the height of the summer melt. How quickly the ground relaxed back to its normal state depended on where the water went and how quickly it moved. Their results indicate that the water’s journey is not a short one: meltwater spends months collecting in subterranean pools on its way to the ocean — something that current climate models don’t account for. Overall, the team’s results indicate that there’s much more hidden meltwater than models predict and it spends a few months under the ice on its way to the sea. (Image credit: T. Nylen; research credit: J. Ran et al.; via Eos)

Glacial Tributaries
Just as rivers have tributaries that feed their flow, small glaciers can flow as tributaries into larger ones. This astronaut photo shows Siachen Glacier and four of its tributaries coming together and continuing to flow from the top to the bottom of the image. The dark parallel lines running through the glaciers are moraines, where rocks and debris are carried along by the ice. Those seen here are medial moraines left by the joining of tributaries. When glaciers retreat, moraines are often left behind, strewn with sediment that ranges from the fine powder of glacial flour all the way to enormous boulders. (Image credit: NASA; via NASA Earth Observatory)

“Colors of Glacial Rivers”
As glaciers flow, they grind down rock, creating fine sediment that dyes waterways a milky color. In Jan Erik Waider’s aerial film, we get a bird’s eye view of the result, watching pockets of sediment move downstream in pulsating waves and swirls. Along the coast, ocean waves pass over the internal ones, creating a mesmerizing crisscrossed wavescape. You can also compare Waider’s aerial footage to Roman De Giuli’s tabletop-scale films and be amazed by their similarities. (Image and video credit: J. Waider; via Colossal)

Slushy Snow Affects Antarctic Ice Melt
More than a tenth of Antarctica’s ice projects out over the sea; this ice shelf preserves glacial ice that would otherwise fall into the Southern Ocean and raise global sea levels. But austral summers eat away at the ice, leaving meltwater collected in ponds (visible above in bright blue) and in harder-to-spot slush. Researchers taught a machine-learning algorithm to identify slush and ponds in satellite images, then used the algorithm to analyze nine years’ worth of imagery.
The group found that slush makes up about 57% of the overall meltwater. It is also darker than pure snow, absorbing more sunlight and leading to more melting. Many climate models currently neglect slush, and the authors warn that, without it, models will underestimate how much the ice is melting and predict that the ice is more stable than it truly is. (Image credit: Copernicus Sentinel/R. Dell; research credit: R. Dell et al.; via Physics Today)


