Ice build-up is a major hazard on airplane wings and control surfaces, but ice can accrete on internal engine components, too. When this happens, the turbofan jet engine can lose power. Such incidents have been observed in high-altitude flight even when pilots observed little to no inclement weather. Researchers think this ice accretion may occur when the plane flies through a cloud of tiny ice crystals. These ice crystals get ingested into the engine, where they hit the warmer internal surfaces and melt. Over the course of the flight, the engine components cool off due to this influx of ice and water. Eventually, ice begins to form and grow inside the engine, ultimately resulting in power loss. Researchers have recreated such ice cloud conditions in a facility at NASA Glenn Research Center and tested a full-scale jet engine for ice accretion. They aim to gather the data necessary to improve commercial engine capabilities under ice ingestion. (Video credit: NASA Glenn Research Center)
Category: Phenomena

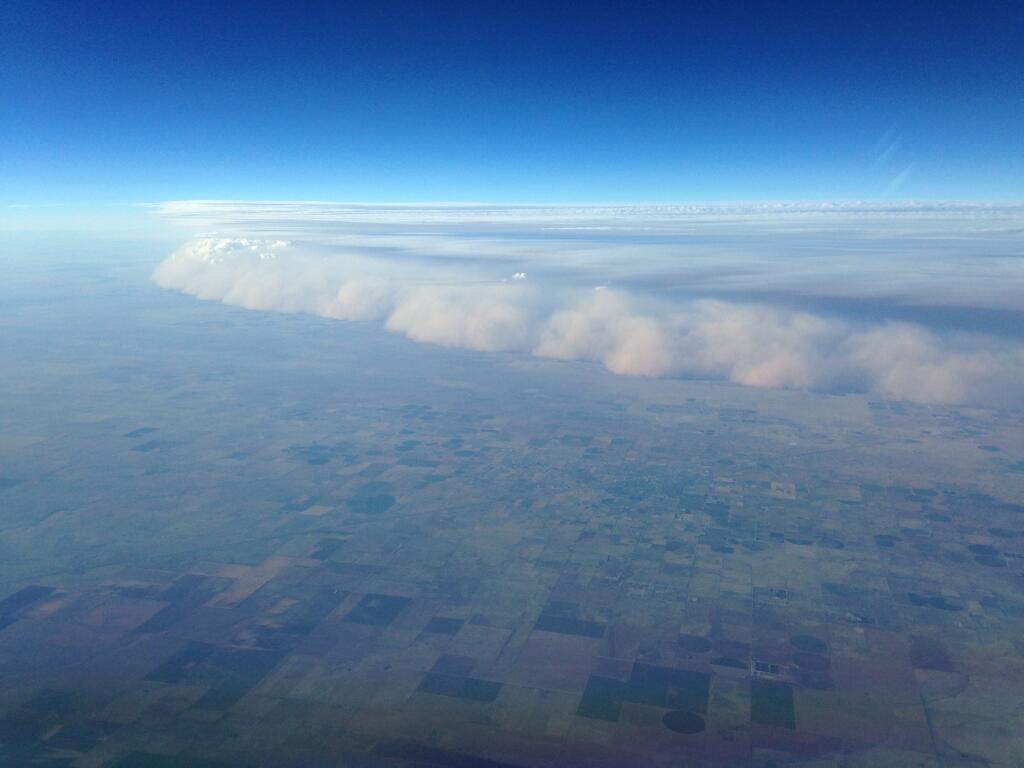
Dust Storm in Texas
This aerial photo shows the leading edge of a haboob–an intense dust storm–sweeping across Texas last week. Although dust can be stirred up under many circumstances, haboobs are a specific meteorological phenomenon with winds as high as 100 kph and towering clouds of dust kilometers high. This particular storm swept through five US states last week along an incoming cold front. The winds accompanying the cold front swept up silt, dirt, and dust from the drought-ridden Southwest and carried it along to envelope towns and cities along the way. Although the term is Arabic in origin, haboobs occur throughout the world, typically at the leading edge of a cold front or thunderstorm. (Photo credit: R. Scott)

Flowing Uphill
Science Friday takes an inside look at self-propelled Leidenfrost droplets like those we’ve featured previously. The Leidenfrost effect takes place when a liquid comes in contact with a surface much, much hotter than its boiling point. Part of the liquid is vaporized, creating a thin gas layer that both insulates the remaining liquid and causes it to move with very little friction. Over a flat surface, this underlying vapor will spread in any direction. But by covering the surface with ratchets, it’s possible to direct the vapor in a particular direction, which propels the droplet in the opposite direction. Check out the video and our previous posts for more! (Video credit: Science Friday; via io9 and submitted by Urs)
Greening the River
Every year Chicago dyes its river green in honor of St. Patrick’s Day. This timelapse video shows this year’s dyeing, including several passes from a boat distributing the green dye. The color is remarkably slow to diffuse. The boat’s passage does little to affect the motion of the dye already in the river. This is because the boat mainly disturbs the surface and most of the color comes from dye spread throughout the water. It’s like if you tried to stir milk into your coffee just by tapping the surface with your spoon. Instead, the slower, large-scale turbulent motion of the river distributes the dye. For more St. Patrick’s Day physics, be sure to check out Guinness physics and why tapping a beer makes it foam. (Video credit: P. Tsai; submitted by Bobby E.)
Vortex Ring Tricks
Vortex rings are wonderful at maintaining coherent vorticity while moving over significant distances. If you stand several meters from a foam cup and try blowing to knock it over, it’s not likely to budge. But move the air impulsively with a vortex cannon, and you can knock it over from the opposite side of the room. The same principle works underwater with added visual effect. Here an impulsive burst of air exhaled by the diver forms a bubble ring with vorticity strong enough to knock over a stack of rocks. It may look like a superpower, but this is science! Dolphins and whales are also known to play with this trick. For the non-scuba-divers among you, it’s also possible to learn to do it in a swimming pool. (Video credit: DjDeutchTv; h/t to coolsciencegifs)
Australian Fire Tornado
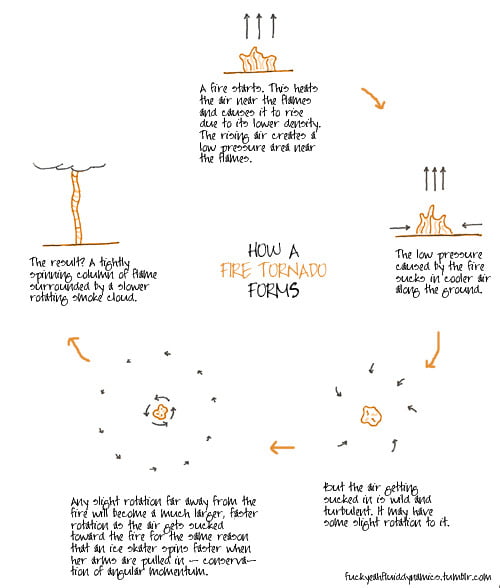
The fire tornado is one of nature’s most impressive and terrifying examples of fluid dynamics. Although they are relatively common phenomena, it’s rare to get such a clear glimpse of them since they usually occur in the midst of giant wildfires. The fire tornado is driven by a combination of updraft from the fire and rotation from the surrounding flow. Take a look at how they form:

There are artificial fire tornadoes as well, including homemade ones. That said, please do not try this at home without full safety measures and extreme caution. In general, watching YouTube videos is a much safer way to enjoy this phenomenon. (Video credit: C. Tangey; h/t to Flow Visualization)

Glacier Flows
These astronaut photos show Patagonian glaciers as seen from space. Glaciers form over many years when snow accumulates in larger amounts than it melts or sublimates. Over time the snow collects and is compacted into a dense ice which slowly flows downslope due to gravity. Many of the dark streaks in the photos are moraines, sediment formations deposited by the movement of the ice. Lateral moraines often line the edges of a glacier, and when two or more glaciers flow together, like in the lower left corner of both photos, the lateral moraines of each of the glaciers combine to form a medial moraine running through the combined glacial flow. (Photo credits: M. Hopkins and K. Wakata)
Hawk in Flight
For a little more than century, mankind has taken flight in fixed-wing aircraft. But other species have flown for much longer using flapping techniques, the details of which humans are still unraveling. To really appreciate flapping flight, it helps to have high-speed video, like this beautiful footage of a goshawk attacking a water balloon. The motion of the hawk’s wings is far more complex than the simple up and down flapping we imitate as children. On the downstroke, the wings and tail stretch to their fullest, providing as large an area as possible for lift. During steady flight, the bird flaps while almost horizontal for minimal drag, but as it approaches its target, it rears back, allowing the downstroke to both lift and slow the bird. In the upstroke, the bird needs to avoid generating negative lift by pushing air upward. To do this, it pulls its wings in and simultaneously rotates them back and up. Its tail feathers are also pulled in but to a lesser extent. Leaving them partially spread probably maintains some positive lift and provides stability. At the end of the upstroke, the hawk’s wings are ready to stretch again, and so the cycle continues. (Video credit: Earth Unplugged/BBC; h/t to io9)
When Turbulence Is Desirable
One of the common themes in aerodynamics, especially in sports applications, is that tripping the flow to turbulence can decrease drag compared to maintaining laminar flow. This seems counterintuitive, but only because part of the story is missing. When a fluid flows around a complex shape, there are actually three options: laminar, turbulent, or separated flow. An object’s shape creates pressure forces on the surrounding fluid flow, in some cases causing an increasing, or unfavorable, pressure gradient. When this occurs, fluid, especially the slower-moving fluid near a surface, can struggle to continue flowing in the streamwise flow direction. Consider the video above, in which the flow moves from left to right. Near the surface a turbulent boundary layer is visible, where fluid motion is significantly slower and more random. Occasionally the flow even reverses direction and billows up off the surface. This is separation. Unlike laminar boundary layers, turbulent boundary layers can better resist and recover from flow separation. This is ultimately what makes them preferable when dealing with the aerodynamics of complex objects. (Video credit: A. Hoque)

Cylinder Wakes
A simple cylinder in a steady flow creates a beautiful wake pattern known as a von Karman vortex street. The image above shows several examples of this pattern. Flow is from bottom to top, and the Reynolds number is increasing from left to right. In the experiment, this increasing Reynolds number corresponds to increasing the flow velocity because the cylinder size, fluid, and temperature were all fixed. As the Reynolds number first increases, the cylinder begins to shed vortices. The vortices alternate the side of the cylinder from which they are shed as well as alternating in their sense of rotation (clockwise or counterclockwise). Further increasing the Reynolds number increases the complexity of the wake, with more and more vortices being shed. The vortex street is a beautiful example of how fluid behavior is similar across a range of scales from the laboratory to our planet’s atmosphere. (Image credit: Z. Trávníček et. al)