Water droplets cling to spine-covered plant life in this series from photographer Tom Leighton. The hairs are hydrophobic — notice how spherical the drops appear. Many plants make parts of their leaves and stems hydrophobic in order to redirect water toward their roots, where it can be taken in. Others use hair-like awns to collect and draw in dew that supplements their water capture. (Image credit: T. Leighton; via Colossal)
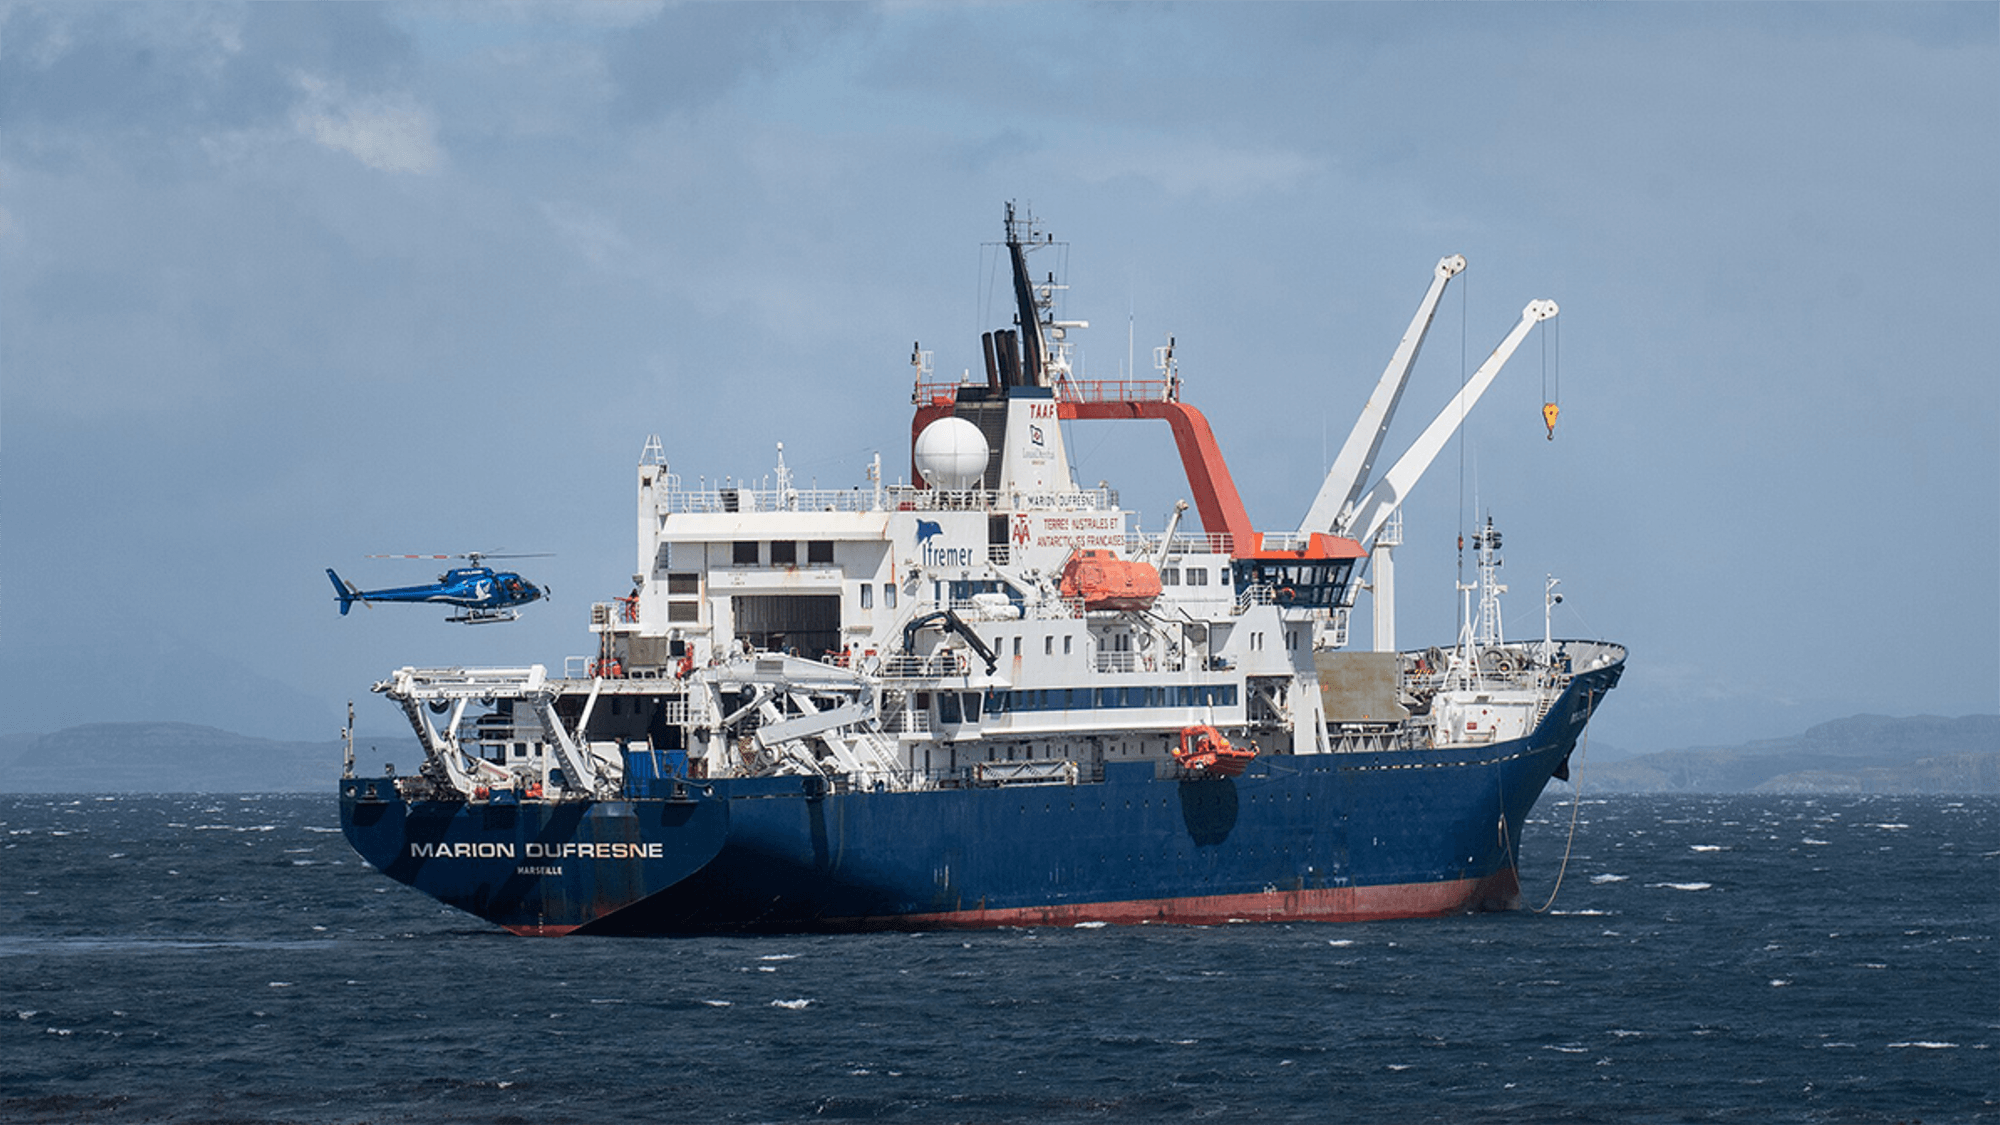
The Mozambique Channel boasts some of the world’s most turbulent waters, driven by eddies hundreds of kilometers wide. Eddies of this size — known as mesoscale — determine regional flows that influence local biodiversity, sediment mixing, and how plastic pollution moves. To better understand the region, scientists measured a mesoscale dipole from a research vessel.
Illustration of flows in the Mozambique Channel. The anticyclonic ring in dark blue rotates counterclockwise and consists of largely uniform water (labeled Ring: R1). To the south, in green, a cyclonic eddy rotates in a clockwise sense (labeled Cyclone: C1). This area is chlorophyll-rich and has varying salinity levels. Between the two is a filament of chlorophyll-rich water being drawn from the near-shore region (labeled Filament: F1).
The dipole consisted of a large anticyclonic ring (shown in dark blue) that rotated counterclockwise and a smaller cyclonic eddy (shown in green) that rotated clockwise. Between these eddies lay a central jet moving up to 130 centimeters per second that drew material out from the shoreline. In the anticyclonic ring, researchers found largely uniform waters with little chlorophyll. The cyclonic eddy, in contrast, was high in chlorophyll and had large variations in salinity. Those smaller-scale variations, they found, helped to drive vertical motions of up to 40 meters per day.
In situ measurements like these help scientists understand how energy flows through different scales in the ocean and how that energy helps transport nutrients, sediment, and pollution regionally. Such measurements also help us to refine ocean models that enable us to predict this transport and how regions will change as climate patterns shift. (Image credit: ship – A. Lamielle/Wikimedia Commons, eddies – P. Penven et al.; research credit: P. Penven et al.; via Eos)
Kirigami is a paper art that combines folding and cutting to create elaborate shapes. Here, researchers use cuts in thin sheets of plastic and explore how the sheets transform in a flow. Depending on the configuration of cuts, the sheets can stretch dramatically in the flow, creating complex, dynamic, and beautiful wakes. I feel like there must be some applications out there that would benefit from kirigami-induced mixing. (Video and image credit: A. Carleton and Y. Modarres-Sadeghi)
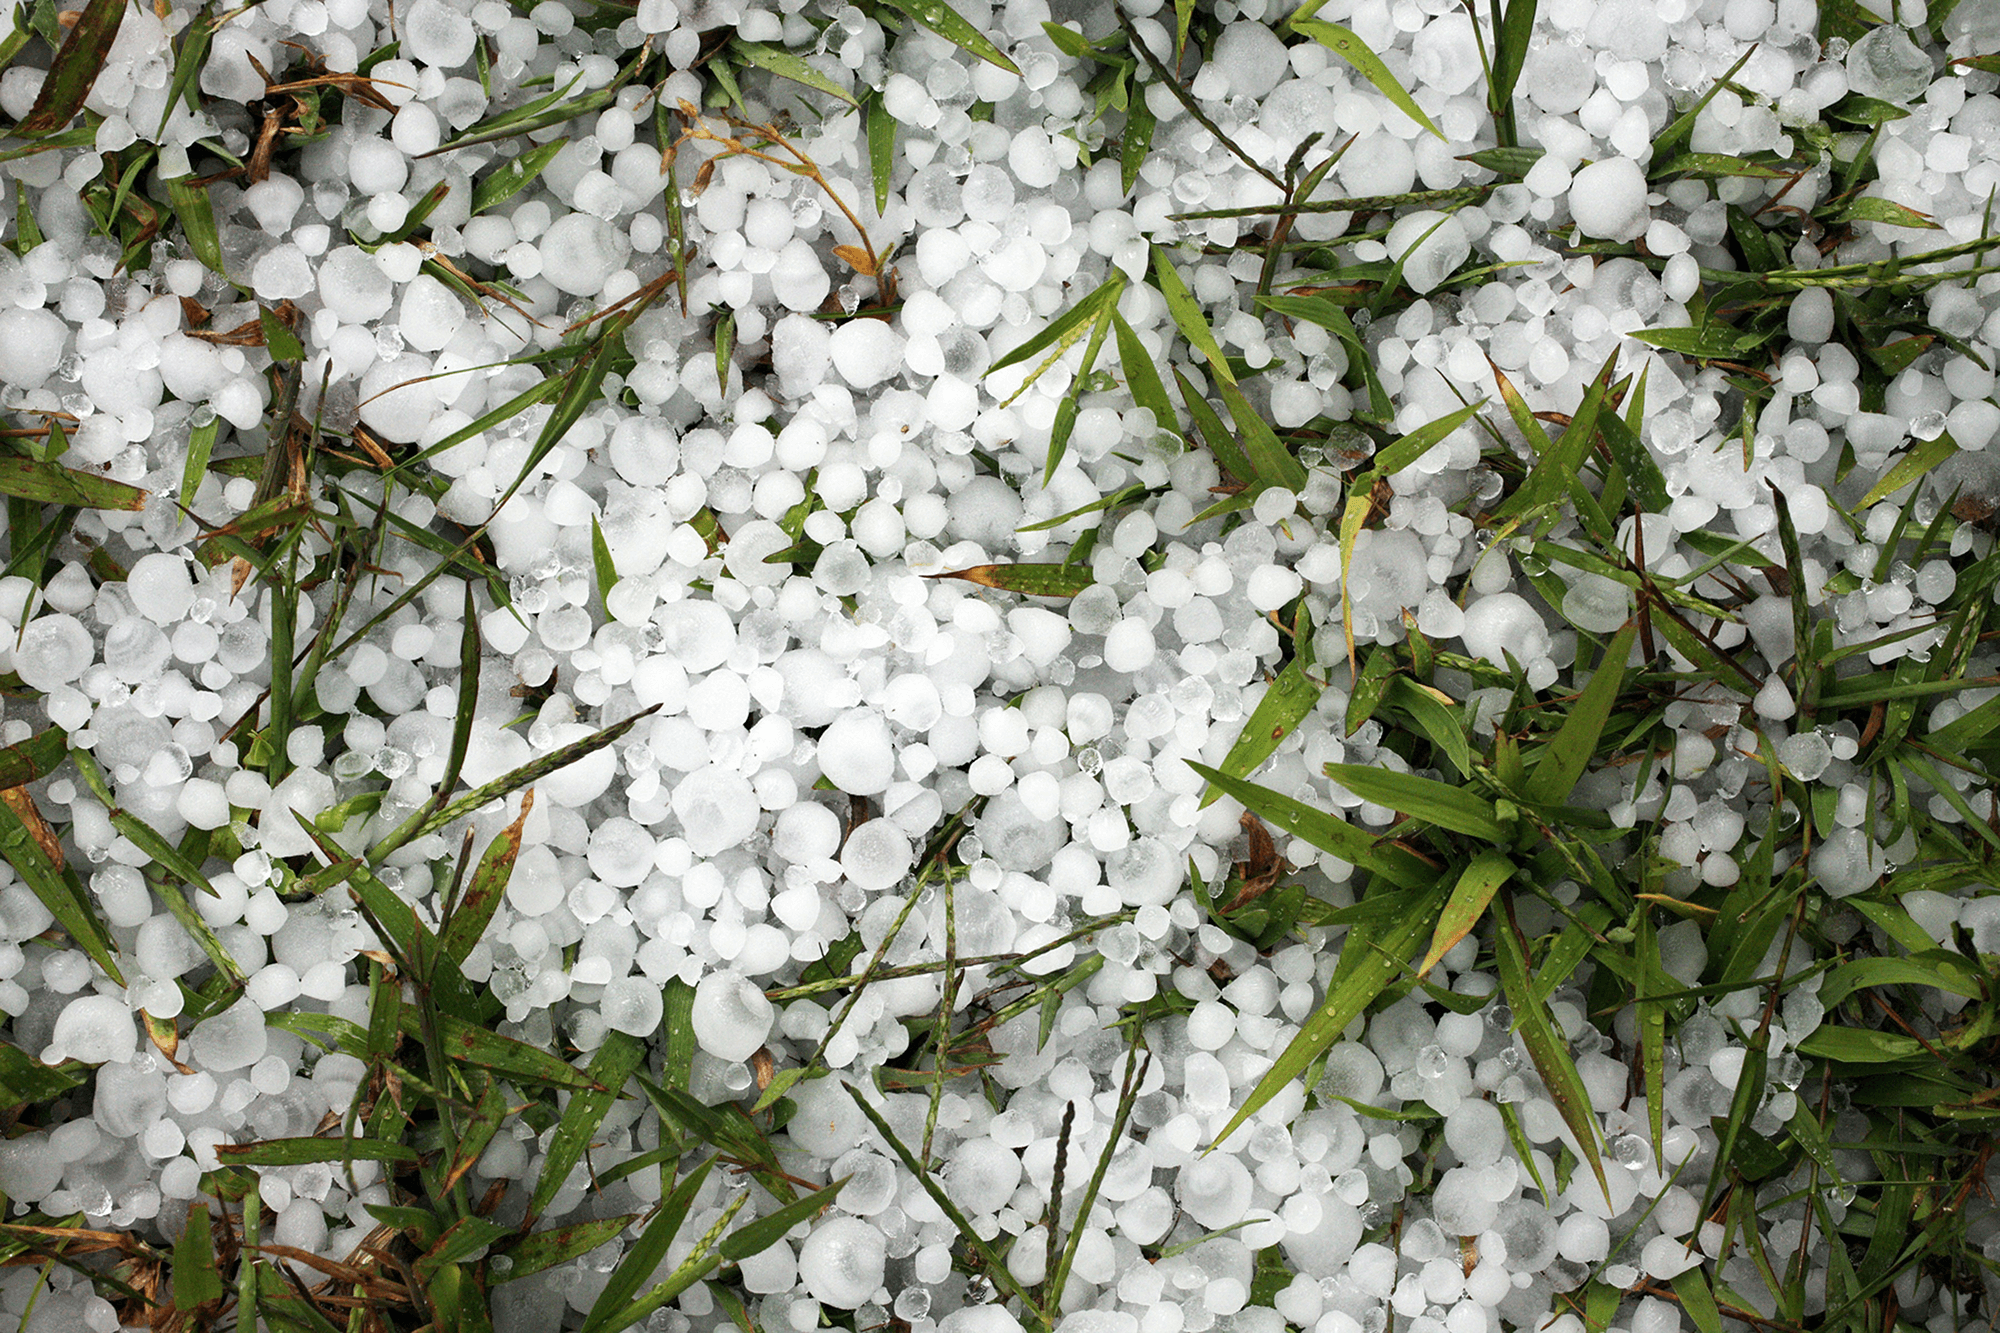
Conventional wisdom suggests that hailstones form over the course of repeated trips up and down through a storm, but a new study suggests that formation method is less common than assumed. Researchers studied the isotope signatures in the layers of 27 hailstones to work out each stone’s formation history. They found that most hailstones (N = 16) grew without any reversal in direction. Another 7 only saw a single period when upwinds lifted them, and only 1 of the hailstones had cycled down-and-up more than once. They did find, however, that hailstones larger than 25mm (1 inch) in diameter had at least one period of growth during lifting.
So smaller hailstones likely don’t cycle up and down in a storm, but the largest (and most destructive) hailstones will climb at least once before their final descent. (Image credit: D. Trinks; research credit: X. Lin et al.; via Gizmodo)
Dams are critical pieces of infrastructure, but, as Grady shows in this Practical Engineering video, they are destined to be temporary. The reason is that they naturally fill with sediment over time. Rivers carry a combination of water and sediment; the latter is critical to healthy shorelines and stable ecology. But while sediment gets carried along by a fast-flowing river, slower flow rates allow sediment to fall out of suspension, as demonstrated in Grady’s tabletop flume. As his river transitions to a deeper, slower-flowing reservoir, sand falls out of the flow, building up colorful strata. The sand and water even create dynamic feedback loops, as seen with the dunes that form in his timelapse and march toward the dam.
Any long-term plan for a dam has to deal with this inevitable build-up of sediment, and, unfortunately, it’s not a simple or cheap problem to address, as discussed in the video. (Video and image credit: Practical Engineering)
Artist Roman De Giuli excels at creating what appear to be vast landscapes carved by moving water. In reality, these pieces are small-scale flows, created on paper. Now, De Giuli takes us behind the scenes to see how he creates these masterpieces — layering, washing, burning, and repeating to build up the paperscape that eventually hosts the flows we see recorded. The work is meticulous and slow, and the results are incredible. De Giuli’s videos never fail to transport me to a calmer, more pristine version of our world. I can’t wait to see the new series! (Video and image credit: R. De Giuli)
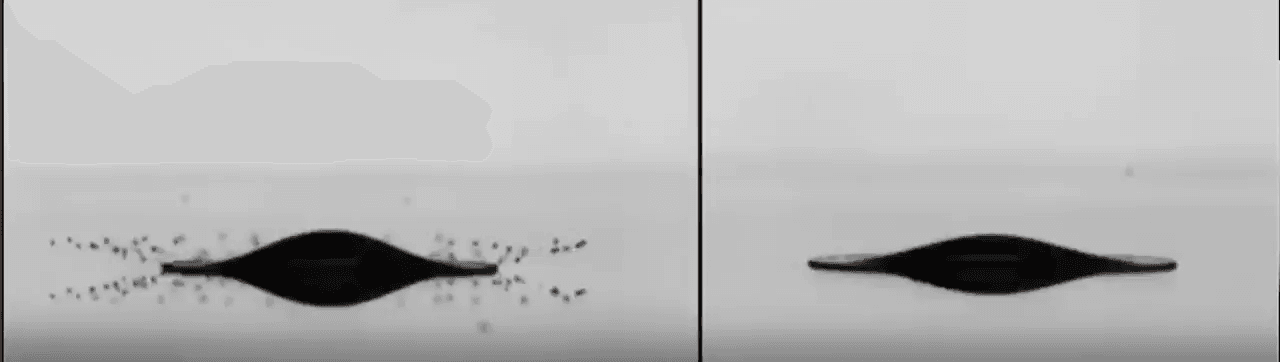
When a droplet falls on a surface, it spreads itself horizontally into a thin lamella. Sometimes — depending on factors like viscosity, impact speed, and air pressure — that drop splashes, breaking up along its edge into myriad smaller droplets. But a new study finds that a small electrical charge is enough to suppress a drop’s splash, as seen below.
The drop’s electrical charge builds up along the drop’s surface, providing an attraction that acts somewhat like surface tension. As a result, charged drops don’t lift off the surface as much and they spread less overall; both factors inhibit splashing.* The effect could increase our control of droplets in ink jet printing, allowing for higher resolution printing. (Image and research credit: F. Yu et al.; via APS News)
*Note that this only works for non-conductive surfaces. If the surface is electrically conductive, the charge simply dissipates, allowing the splash to occur as normal.
Sand is a critical component of many built environments. As most of us learn (via sand castle), adding just the right amount of water allows sand to be quite strong. But with too little water — or too much — sand is prone to collapse. For those of us outside the construction industry, we’re most likely to run into this problem on the beach while digging holes in the sand. In this Practical Engineering video, Grady explains the forces that stabilize and destabilize piled sand and where the dangers of excavation lie. (Video and image credit: Practical Engineering)
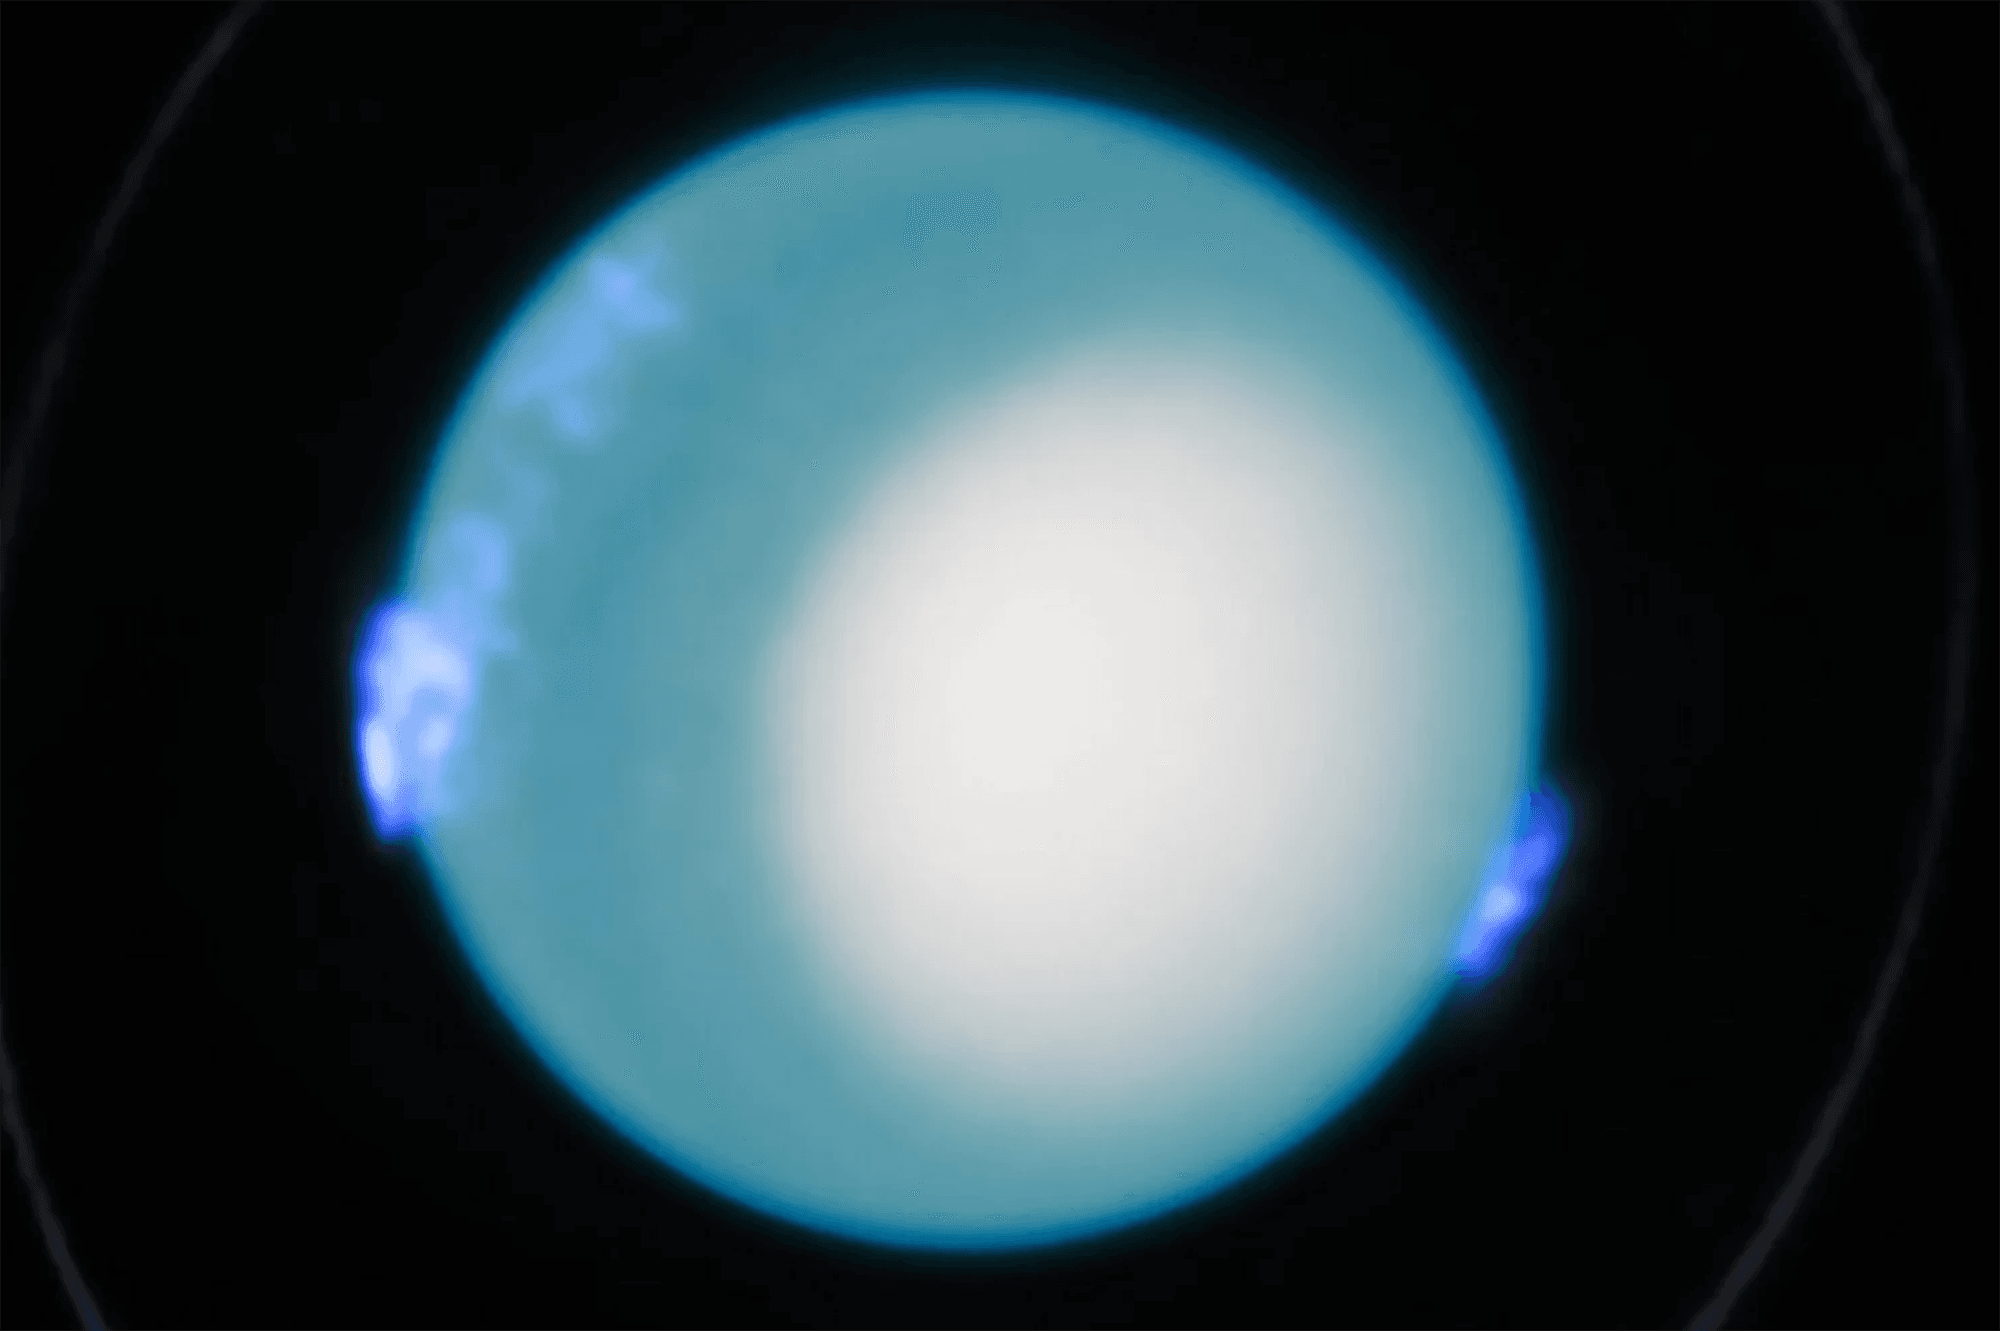
Uranus is one of our solar system’s oddest planets. An ice giant, it spins on its side. We originally estimated its rate of rotation using measurements from Voyager 2, the only spacecraft to have visited the planet. But that measurement was so imprecise that within two years, astronomers could no longer use it to predict where the planet’s poles were. Now a new study, drawing on over a decade of Hubble observations of Uranus’s auroras, has pinned down the planet’s rotation rate far more precisely: 17 hours, 14 minutes, and 52 seconds. While that’s within the original measurement’s 36-second margin of error, the new measurement has a margin of error of only 0.036 seconds. In addition to helping plan a theoretical future Uranus mission, this more accurate rotation rate allows researchers to reexamine decades of data, now with certainty about the planet’s orientation at the time of the observation. (Image credit: ESA/Hubble, NASA, L. Lamy, L. Sromovsky; research credit: L. Lamy et al.; via Gizmodo)
In an ongoing tradition, let’s take another look at some Star Wars-inspired aerodynamics. This year it’s the TIE fighter’s turn. Here, researchers simulate the spacecraft trying to escape Yavin 4’s atmosphere at Mach 1.15. The research poster’s blue contours show pressure contours, with darker colors connoting higher pressures. The bright low pressure region immediately behind the craft suggests a difficult, high-drag ascent and a turbulent, subsonic wake despite the craft’s supersonic velocity. (Image credit: A. Martinez-Sanchez et al.)