We live in a world of fluids. We breathe them, move through them, and have them move in us. “FLOW” is a celebration of that pervasive motion, animated from hand-drawn artwork. It features fluid dynamics from our daily lives — a candle’s flame, breaking waves, pedestrian traffic — all the way to astronomical scales far beyond typical human experience — the rotation and collision of galaxies. It’s a beautiful reminder that flows are always surrounding us, linking our lives from the small to the unbelievably large. (Video credit: MIT LineStorm Animation Consortium; submitted by Pell O.)
Year: 2023

A Bubble’s Path
Centuries ago, Leonardo da Vinci noticed something peculiar about bubbles rising through water. Small bubbles followed a straight path, but slightly larger ones swung back and forth or corkscrewed upward. The mechanism behind this behavior has been a matter of debate ever since, but the authors of a recent study believe they’ve nailed down the answer.
The forces determining a bubble’s path are remarkably complex, which is why it’s taken so long to figure this out. Viscosity acts as a source of drag on the rising bubble, acting across a thin boundary region surrounding the bubble. That boundary isn’t constant, though; the bubble’s shape changes as the flow pushes on it, and the changing shape of the bubble pushes on the flow, in turn. Capturing those subtle interactions numerically and comparing them to careful experiments was necessary to unravel the mystery.
The team found that bubbles above a critical radius (0.926 millimeters) begin to tilt. That tilt causes a change in the bubble’s shape, which increases the flow along one side. This kicks off the wobbling motion, which carries on because of the continuing changes in the bubble’s shape and the flow around it. (Image credit: A. Grey; research credit: M. Herrada and J. Eggers; via Vice; submitted by @lediva)

Leidenfrost Explosion


When a water drop hits a surface that’s much hotter than its boiling point, part of it will vaporize immediately. Depending on the temperature, this Leidenfrost effect can be a relatively gentle process — or not. Here, the surface is so hot that the entire drop is boiling before it’s even finished spreading from impact. The vapor in contact with the surface is trying to escape, bubbling up so violently that it rips the original droplet into a spray of tiny droplets. (Video and image credit: L. Gledhill)

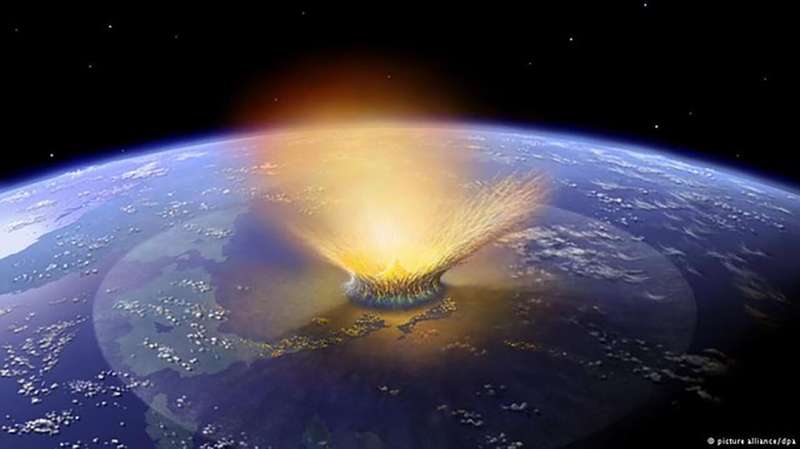
The Chicxulub Impact’s Tsunami
66 million years ago an asteroid struck offshore of what is now Chicxulub near the Yucatán Peninsula in Mexico. The impact and its aftermath are widely credited with a mass extinction that wiped out 75% of plant and animal life on Earth, including non-avian dinosaurs. Since the impact occurred in shallow waters, it also generated a tsunami, one over 30,000 times bigger than any in recorded history.

Snapshot showing the spreading tsunami after the asteroid’s impact. Click on the image to go to NOAA’s website and watch the video. In this simulation, researchers show how that tsunami spread globally. The initial wave was about a mile high but stretched up to about 2.5 miles as it rushed ashore. Worldwide, every shoreline saw flows at 20 cm/s or higher as the wave hit. In the image above, black areas show the landmasses as they existed at the time, with modern borders shown in white outline. To watch the video, click on the image or head to NOAA’s visualization.
You may wonder how scientists can validate a simulation like this one, which so wildly exceeds any recorded event. One way they judged these results is by looking at the sedimentary records of the seafloor. Their results show flows large enough to scour the seafloor and disrupt any sedimentary records in those areas, and, sure enough, those regions hold no records older than the asteroid’s impact. That alignment between the geological record and the simulation’s highest flow areas helps establish confidence in the results. (Image credit: illustration – SWRI/D. Davis, simulation – NOAA; research credit: M. Range et al.; submitted by Kam-Yung Soh)
A Look at Hagfish


Hagfish are the lords of slime. Their viscoelastic protection mechanism is so effective that they’ve hardly changed up their game in the past 300 million years. Instead, at the first sign of trouble, they release a mucus that rapidly expands in salt water. When attacking fish try to pull water into their gills, they get clogged with slime instead, sometimes suffocating and becoming the hagfish’s meal instead. To get out of their slime, hagfish knot themselves and wipe it away, thanks to its shear-thinning properties. (Image and video credit: Deep Look)

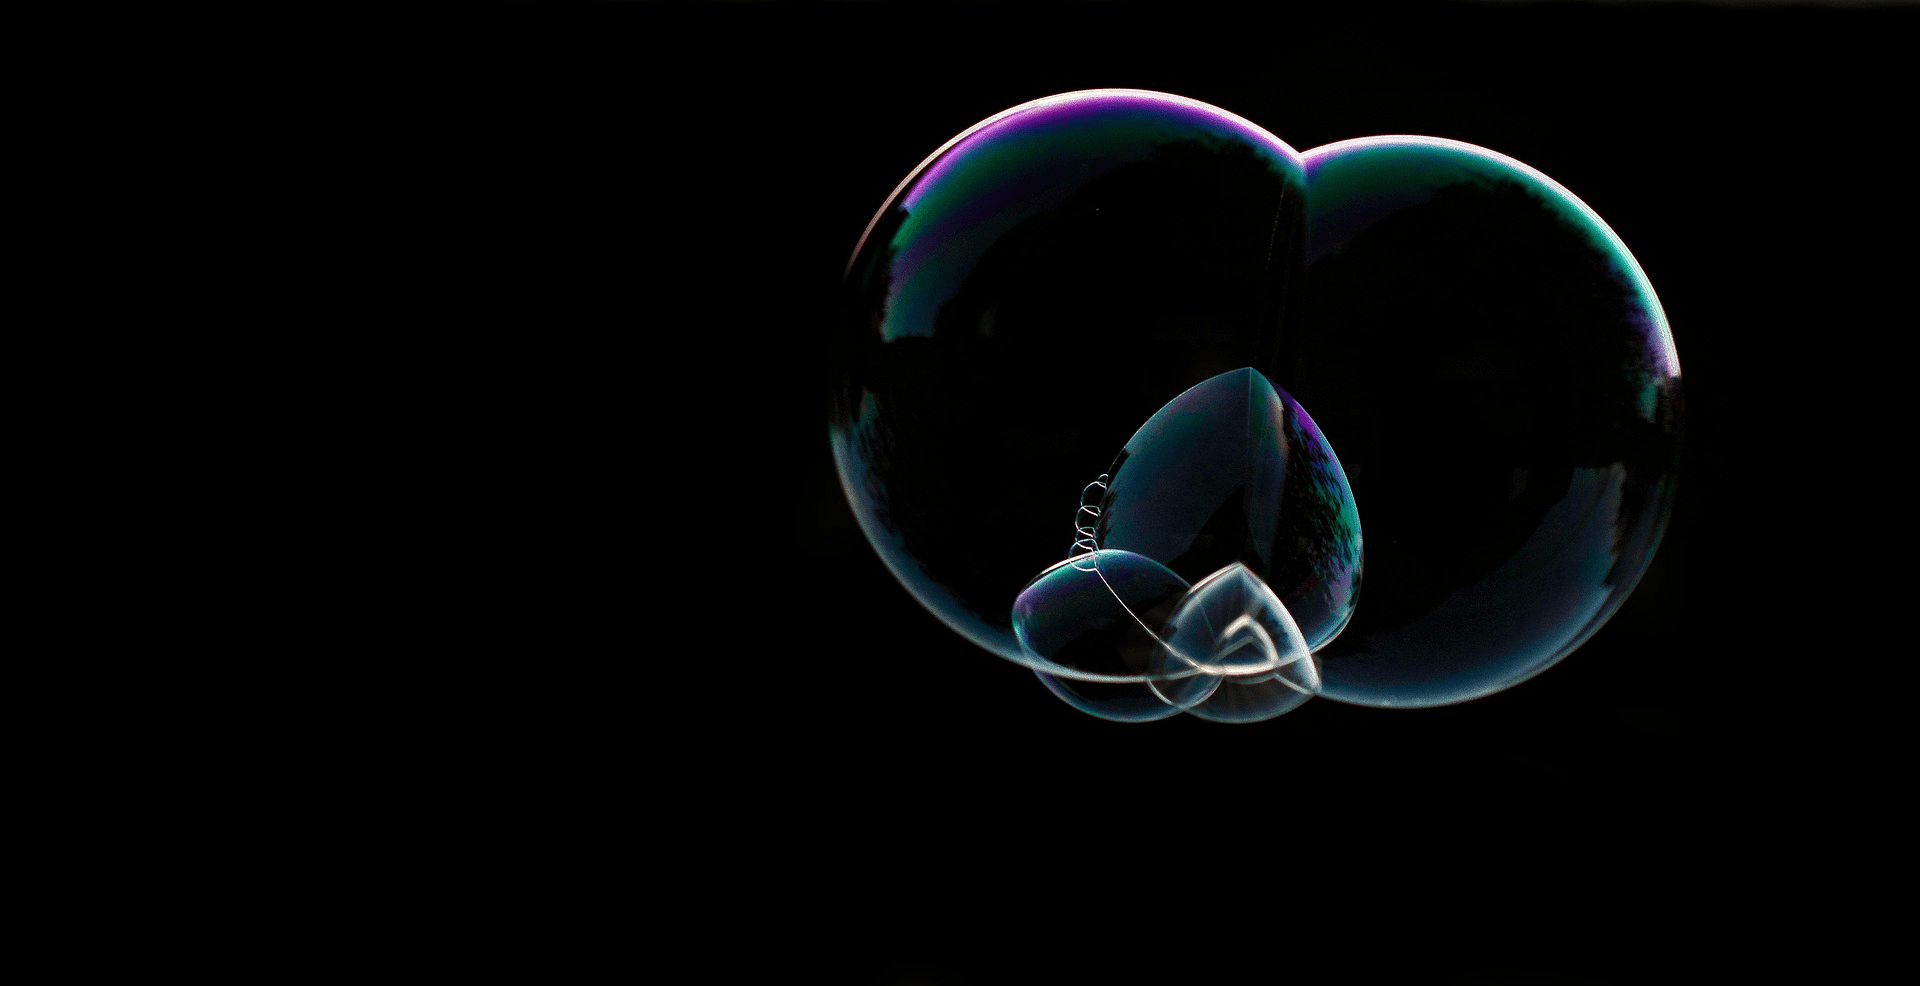
Optimal Bubble Clusters
With a bubble wand, it’s quite easy to create clusters of two or more soap bubbles. These clusters seem to instantly find the lowest energy state, forming a shape that minimizes the cluster’s surface area (including interior walls) for the volume of air they enclose. But mathematicians have struggled for thousands of years to prove that this is actually the case.
In 1995, mathematician John Sullivan had a breakthrough conjecture, at least for some types of bubble clusters. A proof for double bubble clusters quickly followed. But then progress stalled out, with the triple bubble version seemingly out of reach. But now a duo of mathematicians have published proofs for Sullivan’s bubble clusters in triple and quadruple clusters. Learn their story over at Quanta. (Image credit: N. Franz; via Quanta Magazine)
Dandelion Seeds
Each seed on the head of a dandelion has a preferred wind direction, according to new research. Seeds facing the breeze are most likely to release from the head, with those facing other directions holding on tens to hundreds of times harder — until their breeze comes along. To measure the force needed to pluck a dandelion seed, researchers superglued a fine wire to individual seeds and pulled from different directions. This seed-by-seed removal mimics winds from varying angles and allowed the researchers to test the directional dependence of seed release. With seeds poised to release in every direction, the dandelion ensures its successful spread. (Image credit: S. Chaudhry; research credit: J. Shields and C. Roh; via Science News; submitted by Kam-Yung Soh)

Turning the Beach Pink


Lab experiments and numerical simulations can only take us so far; sometimes there’s no substitute for getting out into the field. That’s why a beach in San Diego turned pink this January and February, as researchers released a safe, non-toxic dye into an estuary. The goal is to understand how small freshwater sources mix with colder, saltier ocean waters when they meet in the surf zone. Differences in temperature and salinity both affect the waters’ density and, therefore, how they’ll combine, especially in the face of the turbulent surf. Using drones, distributed sensors, and a specially-outfitted jet ski, the researchers collect data about how the dye (and therefore the estuary’s water) spreads over the 24 hours following each dye release. Check out their experiment’s site to learn more. (Image credits: E. Jepsen/A. Simpson/UC San Diego; via SFGate; submitted by Emily R.)

The Optical Atom
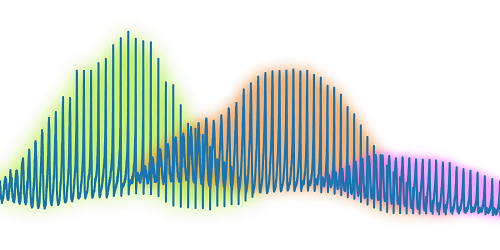
Researchers applied a quantum mechanical technique to study an evaporating drop in extreme detail. The team trapped a spherical water drop and collected the light scattered off it as it evaporated. Using an analytic technique originally developed for an atom, they were able to study changes in the drop down to the nanometric level without relying on numerical simulations to interpret the results. The authors suggest that their method is well-suited to studying the concentration of chemical or biological contaminants on the surface of a drop as it evaporates. (Image credit: droplet – Z. Kaiyv, Fano combs – J. Marmolejo et al.; research credit: J. Marmolejo et al.; via APS Physics)

Illustration of the Fano combs seen by analyzing light scattered from an evaporating drop. 
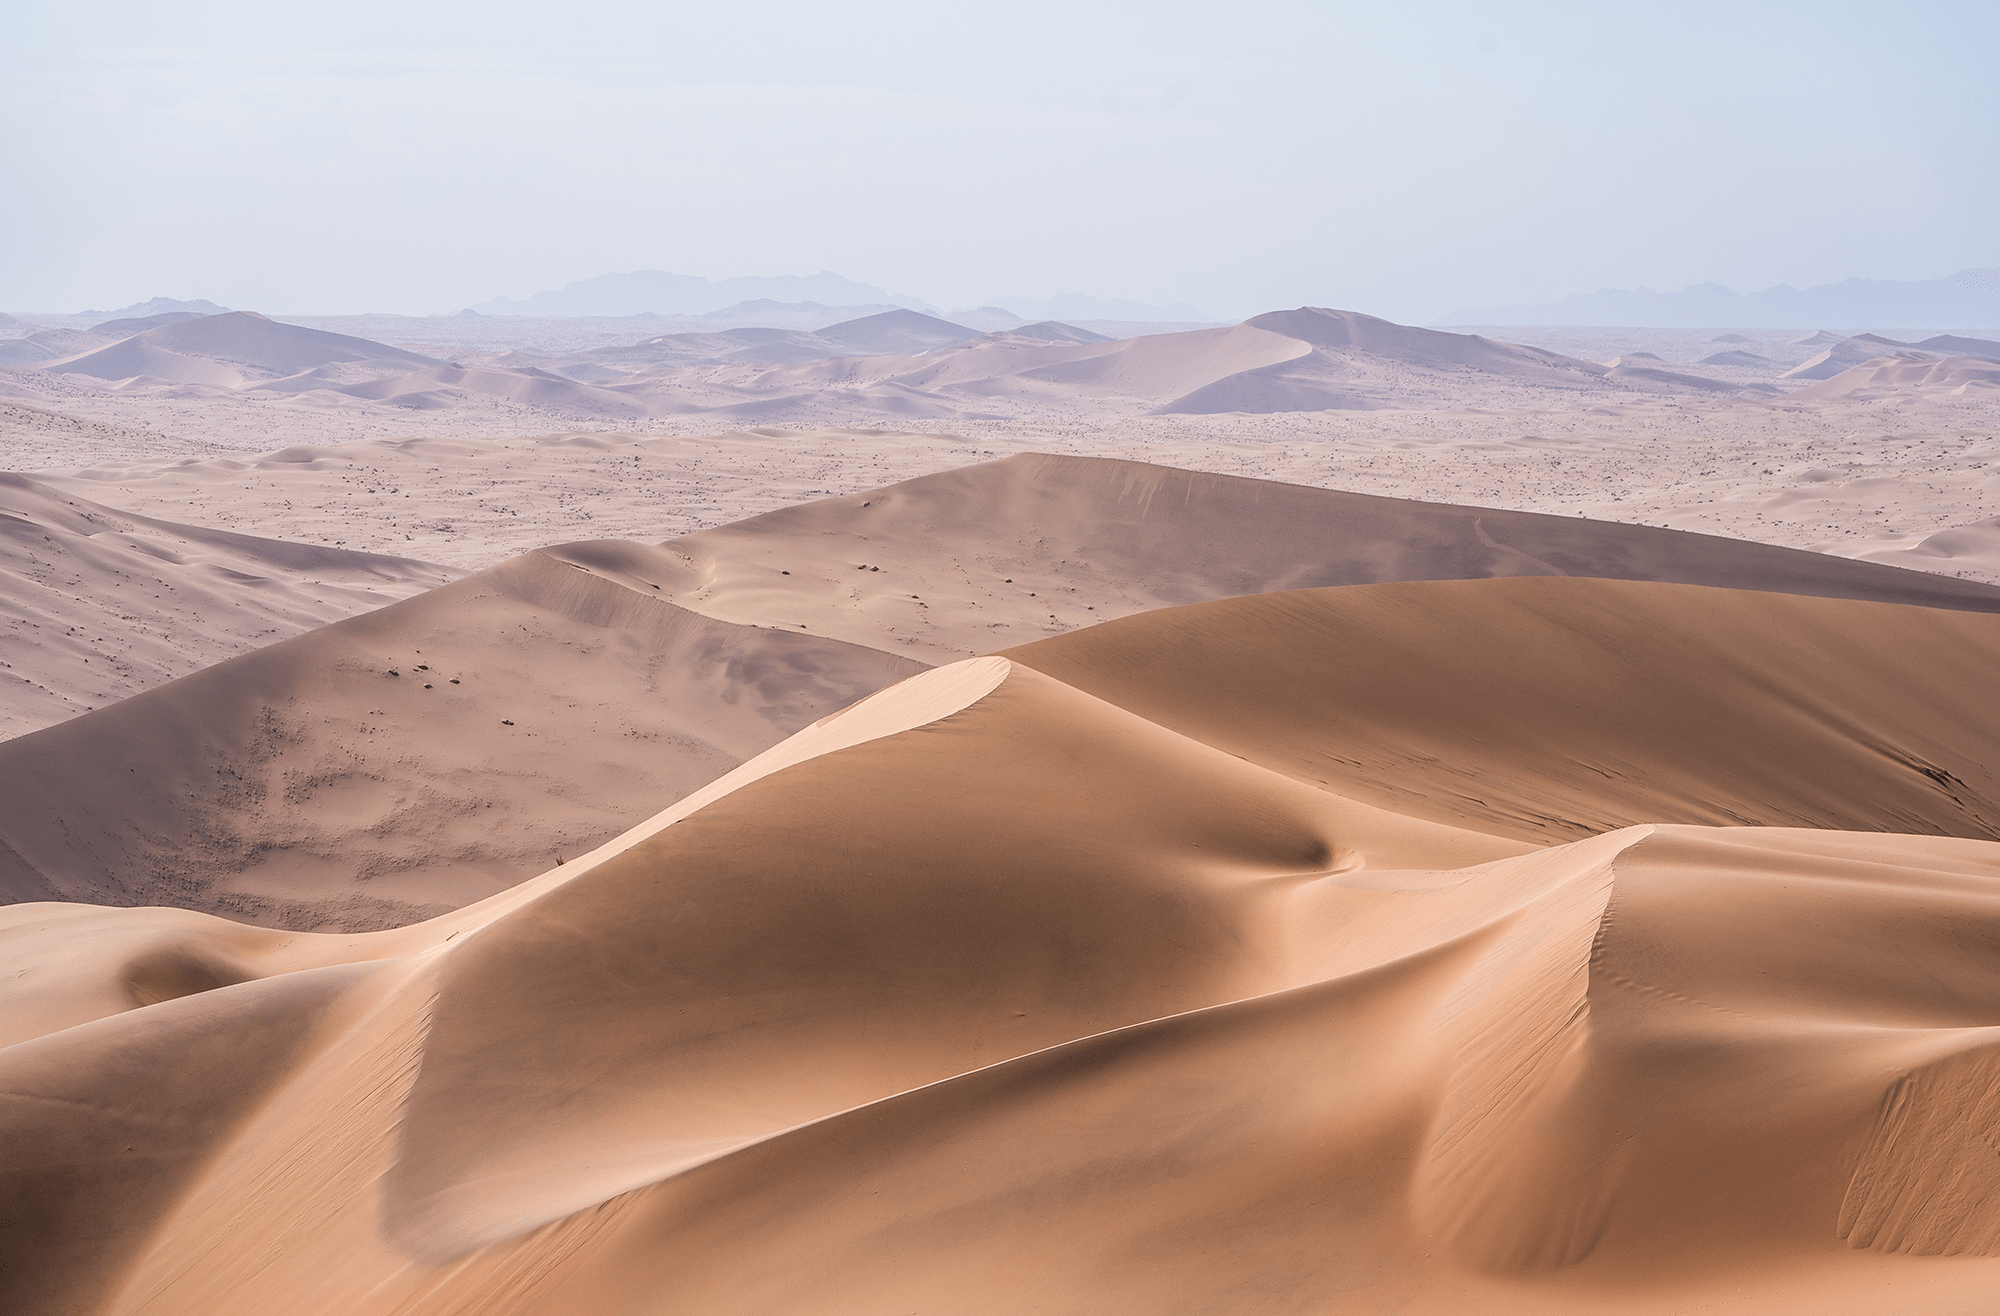
Racing Dunes
The deserts of Namibia are home to some of the fastest and most consistent winds in the world. As a result, they’re also home to some of the fastest-moving dunes on Earth. Dunes are shaped and moved by the wind, which pushes sand up the dune’s windward side and dumps it down the leeward side. As the process repeats, the entire dune moves. The bigger a dune is, the slower it moves.

Animation of Landsat images showing dune movement between April 2013 and April 2022. In this animation, showing dune motion from 2013 to 2022, the largest dunes move about 9 meters per year. In contrast, the smallest dunes move as fast as 83 meters a year! Check out the right side of the image, and you’ll see the dark specks of small dunes racing up and past their bigger brethren. (Image credit: top – E. Böhtlingk, animation – J. Stevens; via NASA Earth Observatory)