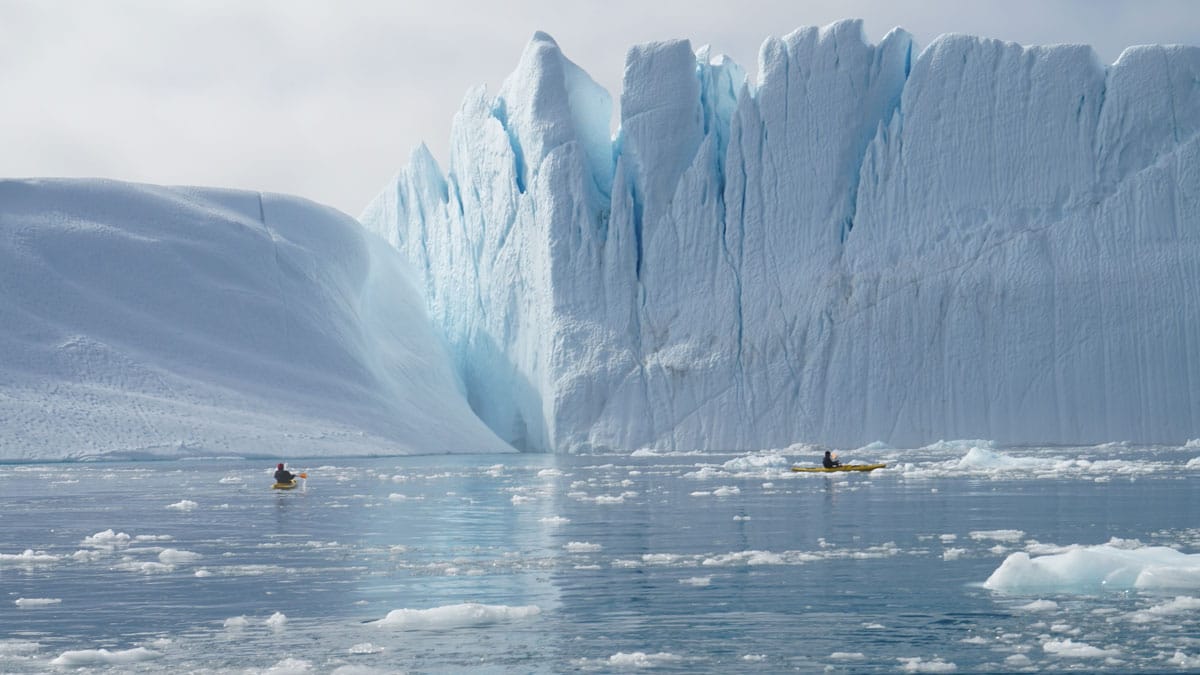
As the implications of climate change grow more dire, interest in geoengineering–trying to technologically counter or mitigate climate change–grows. For example, some have suggested that barriers near tidewater glaciers could restrict the inflow of warmer water, potentially slowing the rate at which a glacier melts. But there are several problems with such plans, as researchers point out.
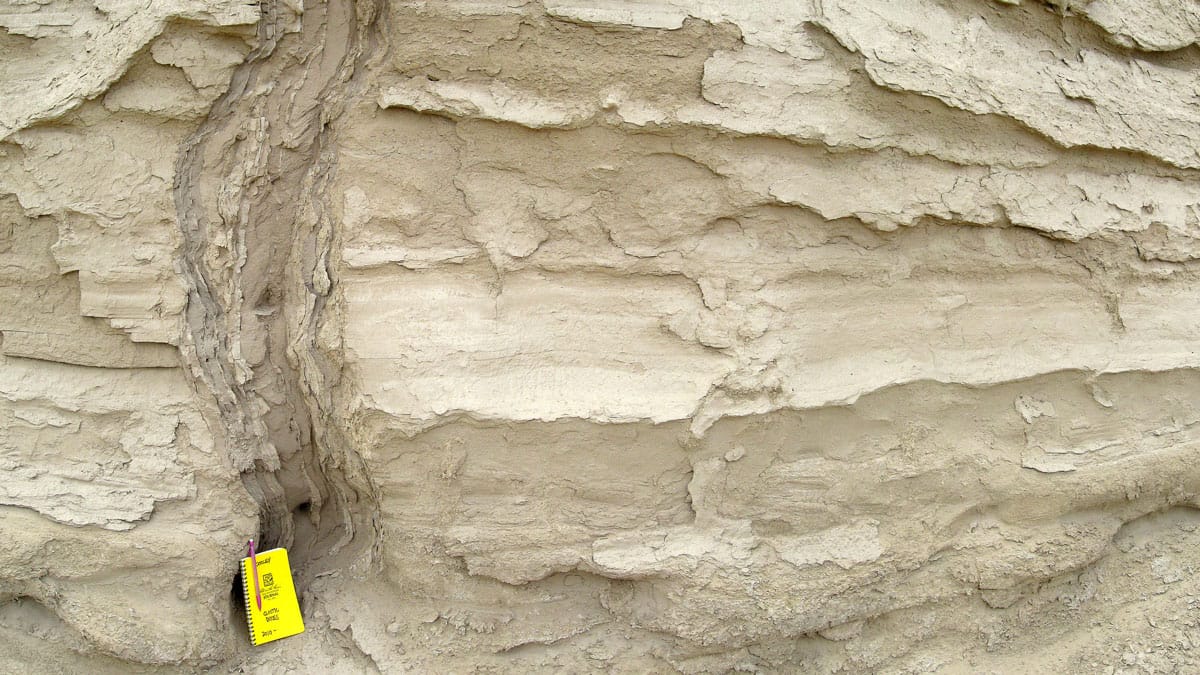
Firstly, there’s the technical feasibility: could we even build such barriers? In many cases, geoengineering concepts are beyond our current technology levels. Burying rocks to increase a natural sill across a fjord might be feasible, but it’s unclear whether this would actually slow melting, in part because our knowledge of melt physics is woefully lacking.
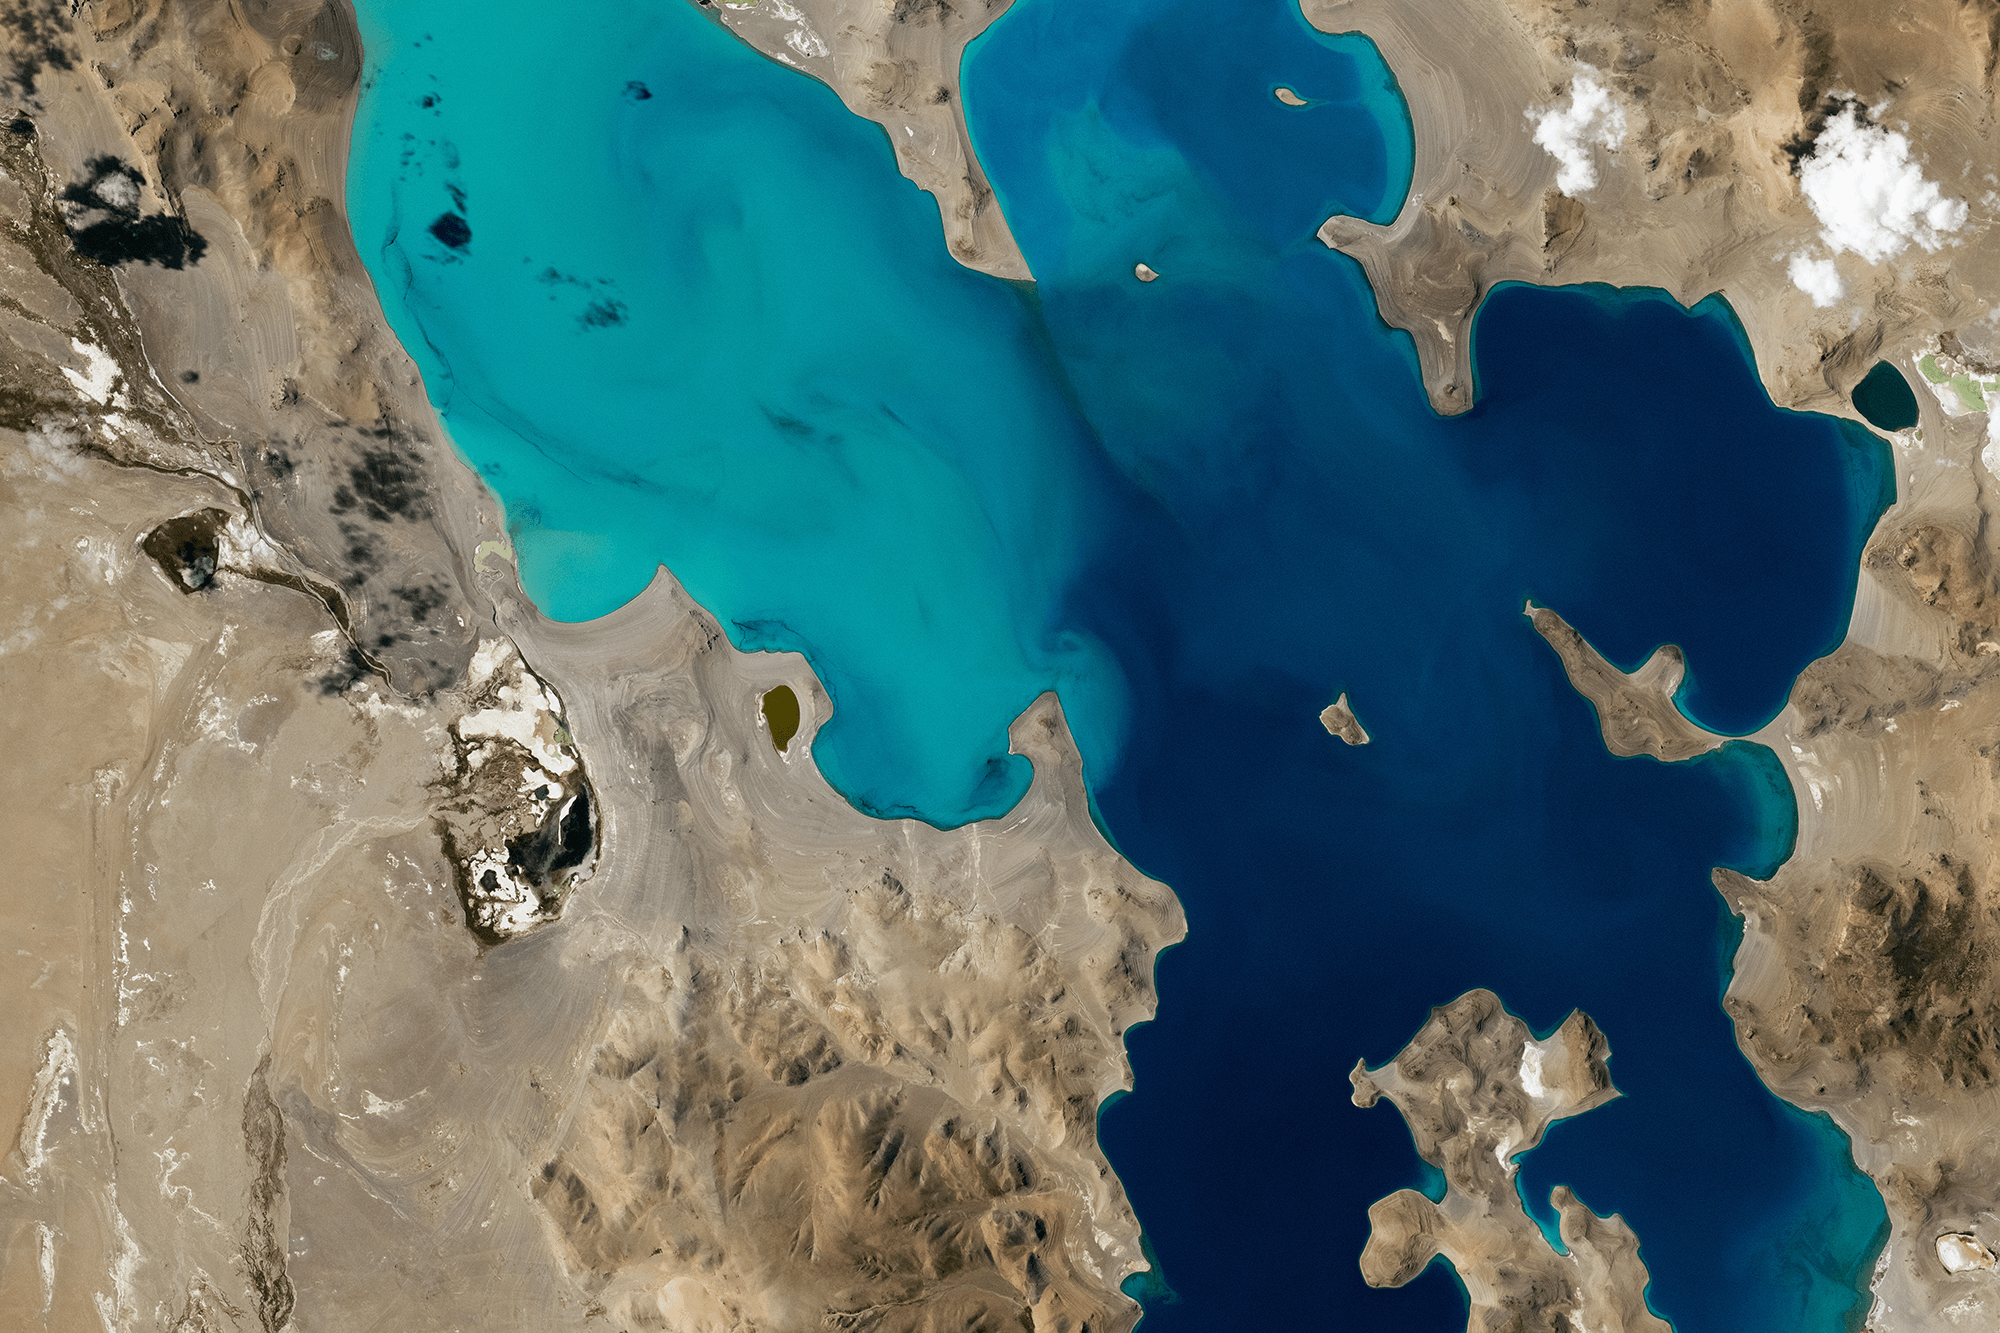
But unintended consequences may be the biggest problem with these schemes. Researchers used existing observations and models of Greenland’s Ilulissat Icefjord, where a natural sill already restricts inflow and outflow from the fjord, to study downstream implications. Right now, the fjord’s discharge pulls nutrients from the deep Atlantic up to the surface, where a thriving fish population supports one of the country’s largest inshore fisheries. As the researchers point out, restricting the fjord’s discharge would almost certainly hurt the fishing industry, at little to no benefit in stopping sea level rise.
Because our environment and society are so complex and interconnected, it’s critical that scientists and policymakers carefully consider the potential impacts of any geoengineering project–even a relatively localized one. (Research and image credit: M. Hopwood et al.; via Eos)