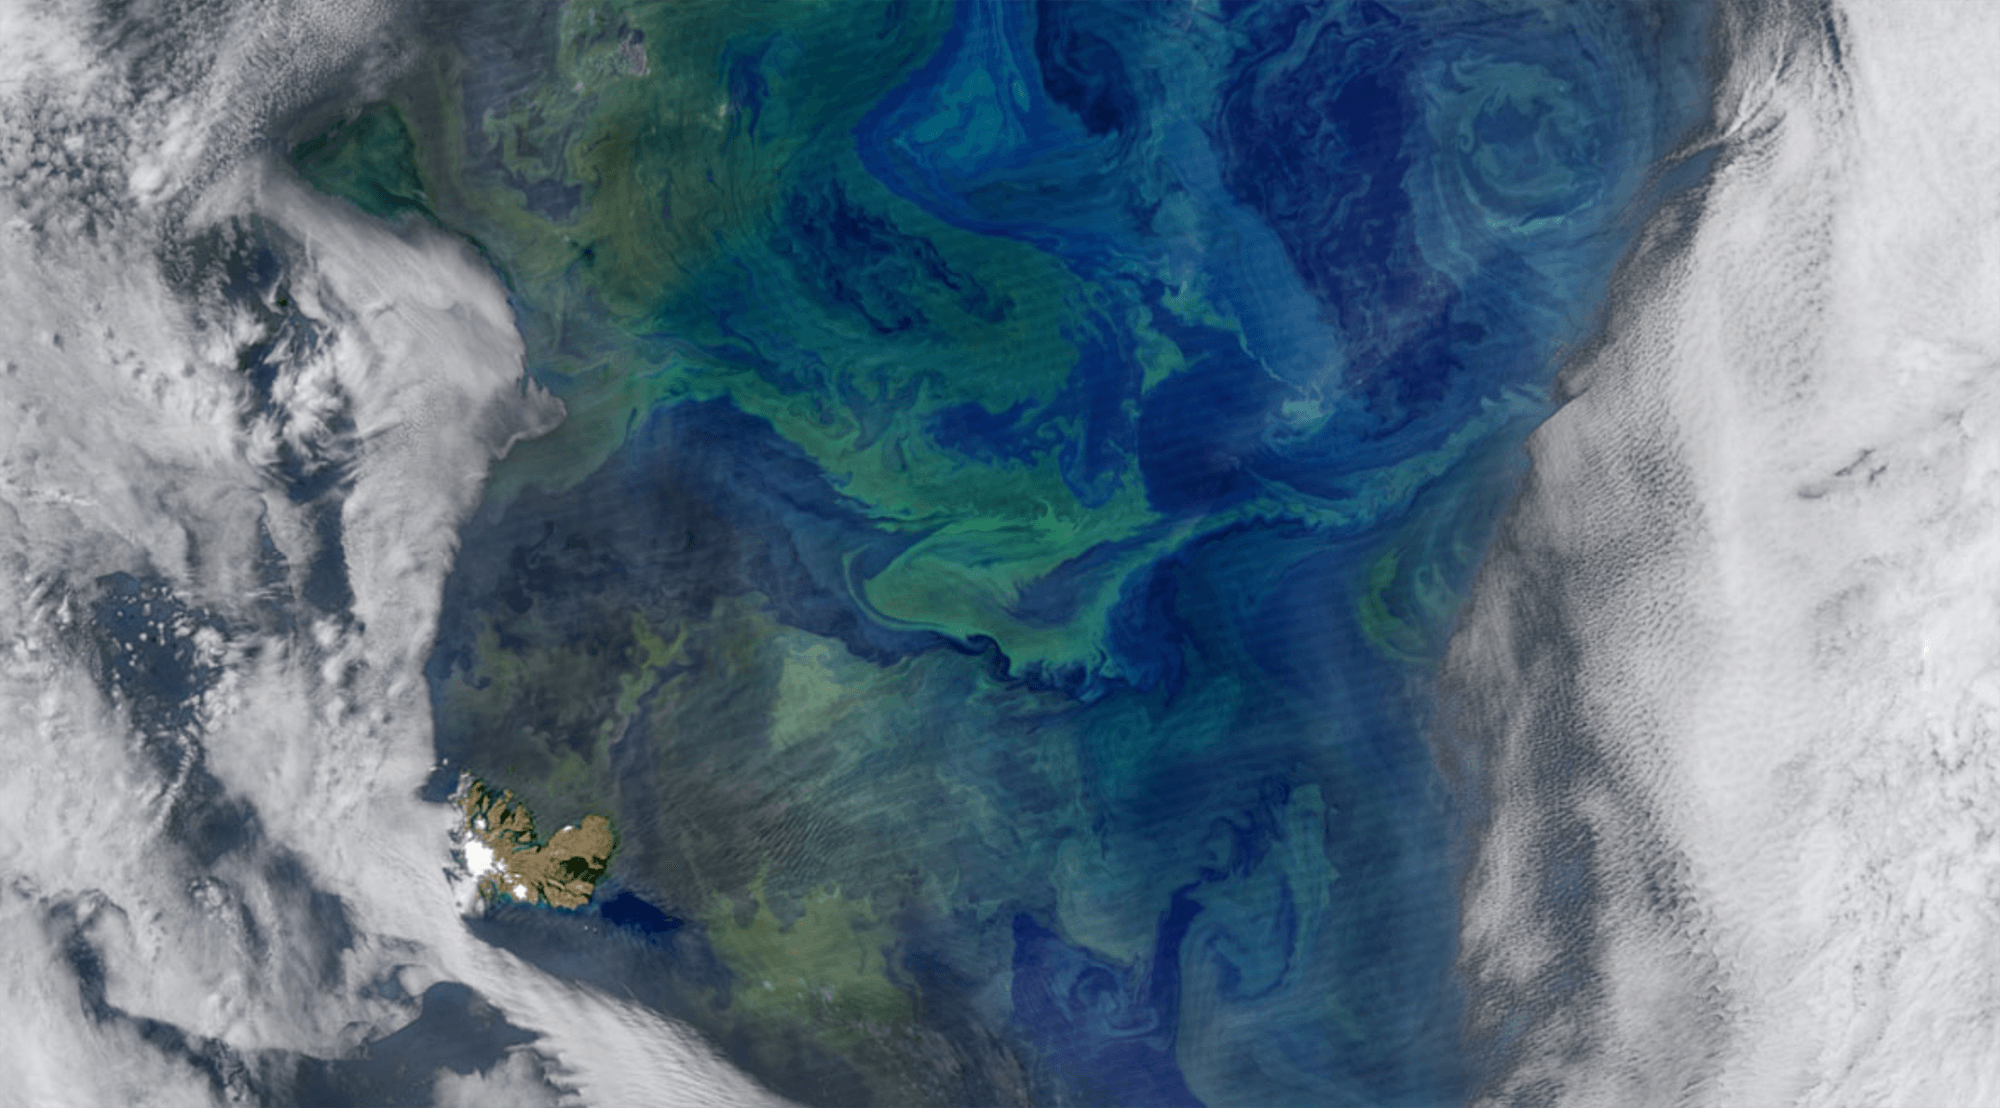
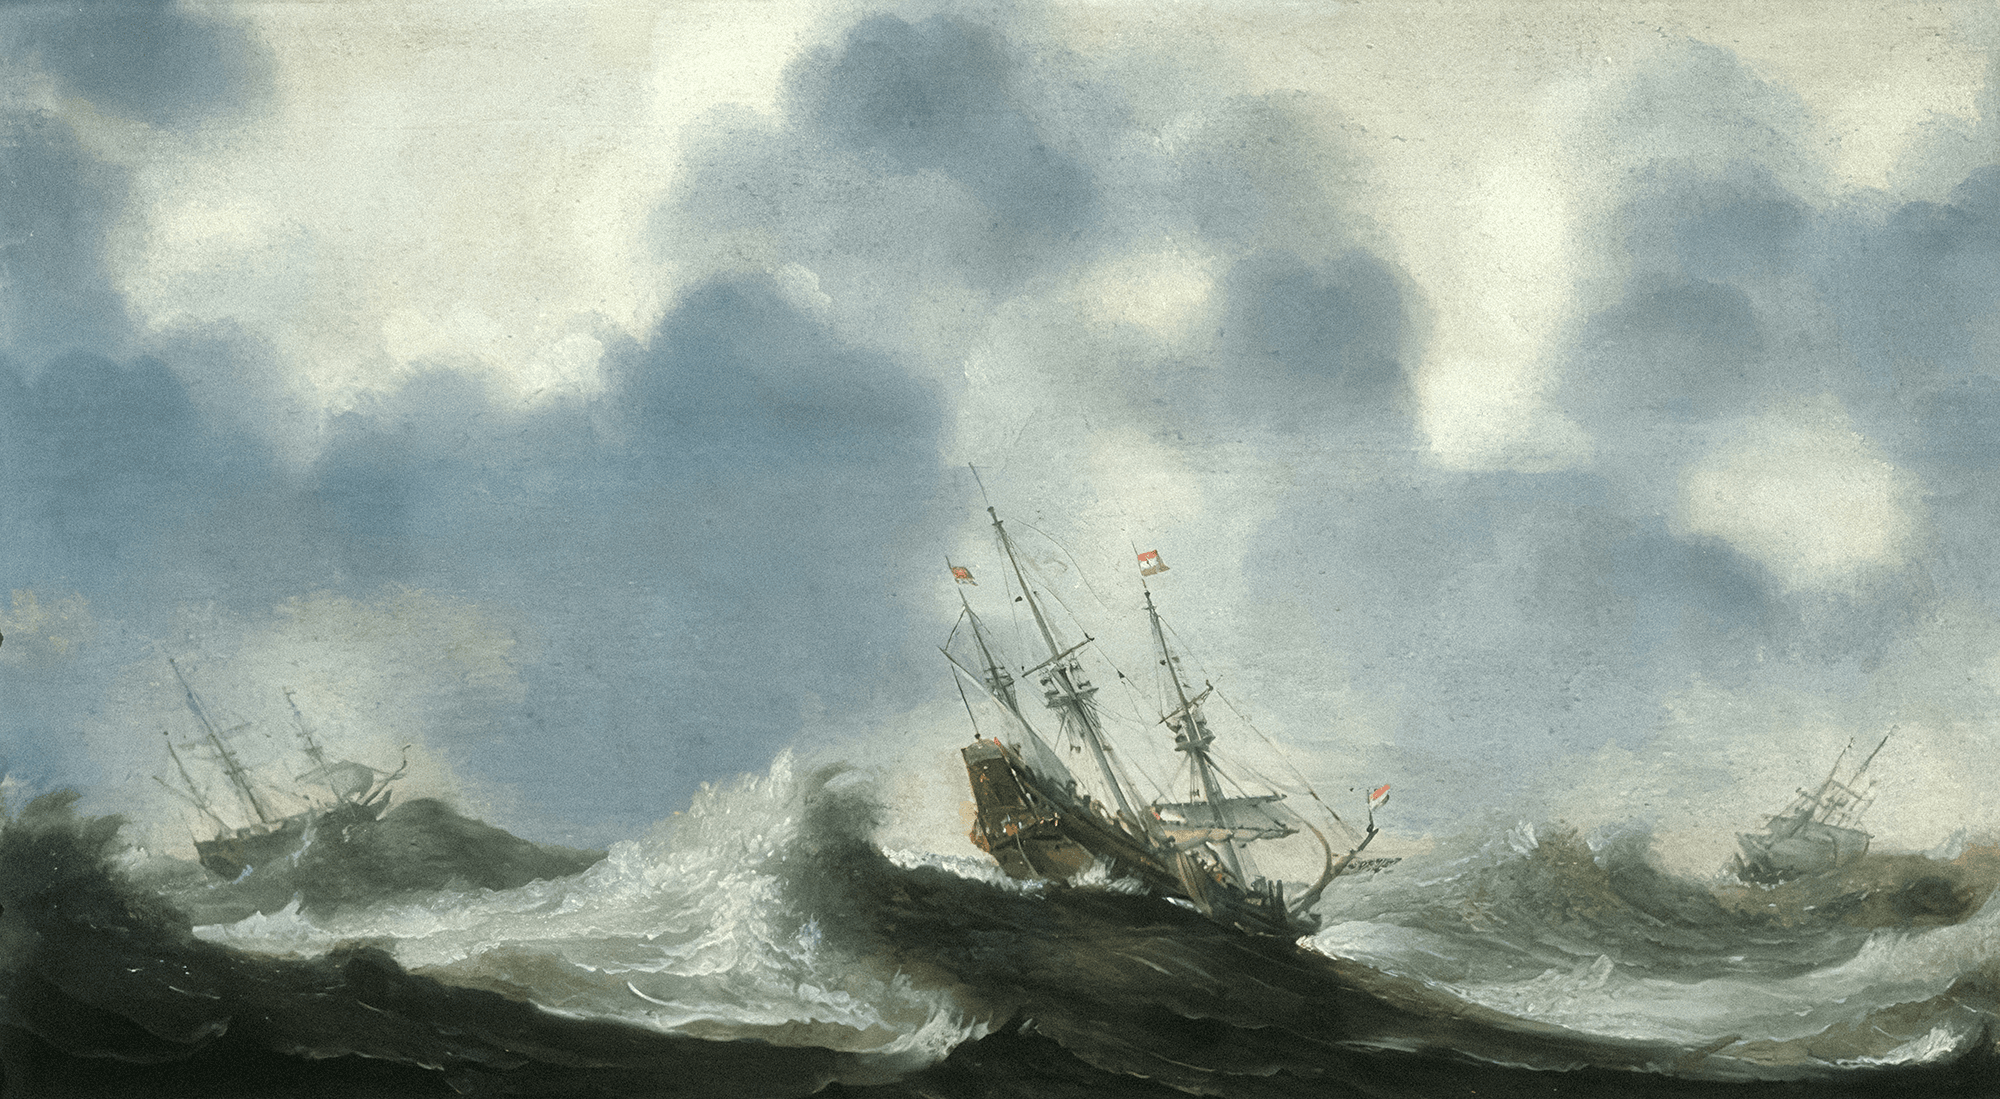
Tag: oceanography

  • Panama’s Missing Pacific Upwelling

    Panama’s Missing Pacific Upwelling

    Strong seasonal winds blowing from the Atlantic typically push water away from Panama’s Pacific coast, allowing deeper, colder waters to rise up. This upwelling cools reefs and feeds phytoplankton blooms, both of which support the rich marine life found there. But in early 2025, the upwelling didn’t occur.

    Normally, coastal ocean temperatures drop to about 19 degrees Celsius during upwelling. Instead, temperatures only reached 23.3 degrees at their coolest. Wind seems to be the missing ingredient: winds from the Atlantic side were short-lived and 74% less frequent than in typical years.

    That lack of upwelling is expected to carry consequences to Panama’s economy. About 95% of the country’s fishing catch comes from the Pacific side, so any drop in fish populations will be felt. The open question remains: was the missing upwelling a singular extreme event or a harbinger of a new normal? (Image credit: R. Heuvel; research credit: A. O’Dea et al.; via Eos)

    Fediverse Reactions
  • Ocean Bubbles Capture Carbon

    Ocean Bubbles Capture Carbon

    As humanity pumps carbon dioxide into the atmosphere, the ocean absorbs about a quarter of it. This exchange happens largely through bubbles created by breaking waves. When waves grow large enough to break, their crests curl over and crash down, trapping air beneath them. The turbulence of the upper ocean can push these buoyant bubbles meters under the surface, where the gases inside them dissolve into the surrounding water. This is how the ocean gets the oxygen used by marine animals, but it’s also how it gathers up carbon dioxide.

    Current climate models often approximate this process using only the wind speed, but a recent study took matters a step further by modeling wave breaking and bubble generation, too. While they found a global carbon uptake that was similar to existing models, the researchers found their breaking wave model showed more variability in where carbon gets stored. For example, more carbon got absorbed in the southern hemisphere, where oceans are consistently rougher, than in the northern hemisphere, where large landmasses shelter the oceans. (Image credit: J. Kernwein; research credit: P. Rustogi et al.; via Eos)

    Fediverse Reactions
  • Tracing the Origins of Ocean Waters

    Tracing the Origins of Ocean Waters

    The Sub-Antarctic Mode Waters (SAMW) lie in the southern Indian Ocean and the east and central Pacific Ocean, where they serve as an important sink for both heat and carbon dioxide. Scientists have long debated the origins of the SAMW’s waters, and a new study may have an answer.

    Researchers combined data from ocean observations with a model of the Southern Ocean to essentially trace the SAMW’s ingredients back to their respective origins. The results showed that about 70% of the Indian Ocean’s SAMWs came from subtropical waters, but those waters contributed to only about 40% of the Pacific’s SAMWs. Pacific SAMWs had their largest contributions from upwelling circumpolar waters.

    Understanding where a SAMW’s waters came from helps scientists predict how those waters will mix and how much heat and carbon they can absorb. (Image credit: NASA; research credit: B. Fernández Castro et al.; via Eos)

    Fediverse Reactions
  • Artificial Reoxygenation

    Artificial Reoxygenation

    Phytoplankton blooms have blossomed in coastal waters around the world, driven by phosphorus and nitrogen in agricultural run-off. These large algal blooms deplete oxygen in the water, creating dead zones where fish and other marine life cannot survive. Typically, oxygen makes its way into the ocean at the surface, where breaking waves trap air in bubbles that, when tiny enough, dissolve their oxygen into the water. But this process mainly helps surface-level waters, and without means to circulate oxygen-rich water down to the depths, the low-oxygen state persists.

    Artificial reoxygenation is a possible countermeasure. Either by bubbling oxygen directly into deeper waters or by pumping surface-level water downward, we could increase oxygen levels in the water column. So far, though, artificial reoxygenation’s success has been limited; tests in a few bays and estuaries show that it’s possible to reoxygenate the water, but the effects only last as long as the artificial mechanism remains active. Stop the pumps and bubblers and the water will revert to its low-oxygen state in just a day. Even so, the measures may be worthwhile on a temporary basis in some places while we adjust agricultural practices and try to mitigate warming. (Image credit: Copernicus Sentinel/ESA; via Eos)

    Fediverse Reactions
  • Mapping the Mozambique Channel

    Mapping the Mozambique Channel

    The Mozambique Channel boasts some of the world’s most turbulent waters, driven by eddies hundreds of kilometers wide. Eddies of this size — known as mesoscale — determine regional flows that influence local biodiversity, sediment mixing, and how plastic pollution moves. To better understand the region, scientists measured a mesoscale dipole from a research vessel.

    Illustration of flows in the Mozambique Channel. The anticyclonic ring in dark blue rotates counterclockwise and consists of largely uniform water (labeled Ring R1). To the south, in green, a cyclonic eddy rotates in a clockwise sense (labeled Cyclone C1). This area is chlorophyll-rich and has varying salinity levels. Between the two is a filament of chlorophyll-rich water being drawn from the near-shore region (labeled Filament F1).
    Illustration of flows in the Mozambique Channel. The anticyclonic ring in dark blue rotates counterclockwise and consists of largely uniform water (labeled Ring: R1). To the south, in green, a cyclonic eddy rotates in a clockwise sense (labeled Cyclone: C1). This area is chlorophyll-rich and has varying salinity levels. Between the two is a filament of chlorophyll-rich water being drawn from the near-shore region (labeled Filament: F1).

    The dipole consisted of a large anticyclonic ring (shown in dark blue) that rotated counterclockwise and a smaller cyclonic eddy (shown in green) that rotated clockwise. Between these eddies lay a central jet moving up to 130 centimeters per second that drew material out from the shoreline. In the anticyclonic ring, researchers found largely uniform waters with little chlorophyll. The cyclonic eddy, in contrast, was high in chlorophyll and had large variations in salinity. Those smaller-scale variations, they found, helped to drive vertical motions of up to 40 meters per day.

    In situ measurements like these help scientists understand how energy flows through different scales in the ocean and how that energy helps transport nutrients, sediment, and pollution regionally. Such measurements also help us to refine ocean models that enable us to predict this transport and how regions will change as climate patterns shift. (Image credit: ship – A. Lamielle/Wikimedia Commons, eddies – P. Penven et al.; research credit: P. Penven et al.; via Eos)

    Fediverse Reactions
  • Climate Change and the Equatorial Cold Tongue

    Climate Change and the Equatorial Cold Tongue

    A cold region of Pacific waters stretches westward along the equator from the coast of Ecuador. Known as the equatorial cold tongue, this region exists because trade winds push surface waters away from the equator and allow colder, deeper waters to surface. Previous climate models have predicted warming for this region, but instead we’ve observed cooling — or at least a resistance to warming. Now researchers using decades of data and new simulations report that the observed cooling trend is, in fact, a result of human-caused climate changes. Like the cold tongue itself, this new cooling comes from wind patterns that change ocean mixing.

    As pleasant as a cooling streak sounds, this trend has unfortunate consequences elsewhere. Scientists have found that this cooling has a direct effect on drought in East Africa and southwestern North America. (Image credit: J. Shoer; via APS News)

    Fediverse Reactions
  • Featured Video Play Icon

    Salt Fingers

    Any time a fluid under gravity has areas of differing density, it convects. We’re used to thinking of this in terms of temperature — “hot air rises” — but temperature isn’t the only source of convection. Differences in concentration — like salinity in water — cause convection, too. This video shows a special, more complex case: what happens when there are two sources of density gradient, each of which diffuses at a different rate.

    The classic example of this occurs in the ocean, where colder fresher water meets warmer, saltier water (and vice versa). Cold water tends to sink. So does saltier water. But since temperature and salinity move at different speeds, their competing convection takes on a shape that resembles dancing, finger-like plumes as seen here. (Video and image credit: M. Mohaghar et al.)

    Fediverse Reactions
  • Growing Ice

    Growing Ice

    While much attention is given to the summer loss of sea ice, the birth of new ice in the fall is also critical. Ice loss in the summer leaves oceans warmer and waves larger since wind can blow across longer open stretches. Those warmer waters and more dynamic waves affect how ice forms once autumn sets in. Higher waves mean that ice tends to form in “pancakes” like those seen here. Pancake ice is small — typically under 1 meter wide — and can only be observed from nearby, since they’re smaller than typical satellite resolution. Only once there’s enough pancake ice to dampen the waves will the pieces begin to cement together to form larger pieces that will form the basis of the year’s new ice. (Image credit: M. Smith; see also Eos)

    Fediverse Reactions
  • Featured Video Play Icon

    Mapping the Oceans With Seals

    Elephant seals are harbingers — canaries in the coal mine — for climate change. A long-running experiment tracks northern elephant seal populations using a combination of sensor tags and field measurements. With the miniaturization of sensors, a tagged seal can provide a wealth of data for scientists: foraging paths, temperature and salinity data, behavioral patterns, ecological data, and even information on the species around the seal. This video delves into this treasure trove, explaining how and what we’re learning from this species, especially as they navigate our changing climate. (Video and image credit: Science)

    Fediverse Reactions
  • Resolution Effects on Ocean Circulation

    Resolution Effects on Ocean Circulation

    The Gulf Stream current carries warm, salty water from the Gulf of Mexico northeastward. In the North Atlantic, this water cools and sinks and drifts southwestward, emerging centuries later in the Southern Ocean. Known as the Atlantic Meridional Overturning Circulation (AMOC), this circulation is critical, among other things, to Europe’s temperate climate. Since 1995, scientists have been warning that human-driven climate change is weakening the AMOC and may cause it to shut down entirely — which would have catastrophic consequences for our society.

    Comparison of ocean current speeds in the low-resolution (left) and high-resolution (right) simulations.
    Comparison of ocean current speeds in the low-resolution (left) and high-resolution (right) simulations.

    A recent study re-examined the AMOC using both low- and high-resolution numerical simulations, combined with direct observations. Both simulations covered 1950 – 2100 and found the AMOC’s strength has declined since 1950. But the high-resolution simulation found significant regional variations in the AMOC’s behavior. Some regions saw localized strengthening, while other areas showed abrupt collapse. These sensitive shifts underscore the importance of driving toward higher resolutions in our next-generation climate models, if we want to better understand — and perhaps predict — what lies ahead as our climate changes. (Image credit: illustration – Atlantic Oceanographic and Meteorological Laboratory, simulations – R. Gou et al.; research credit: R. Gou et al.; via APS Physics)