Tag: oceanography

  • Resolution Effects on Ocean Circulation

    Resolution Effects on Ocean Circulation

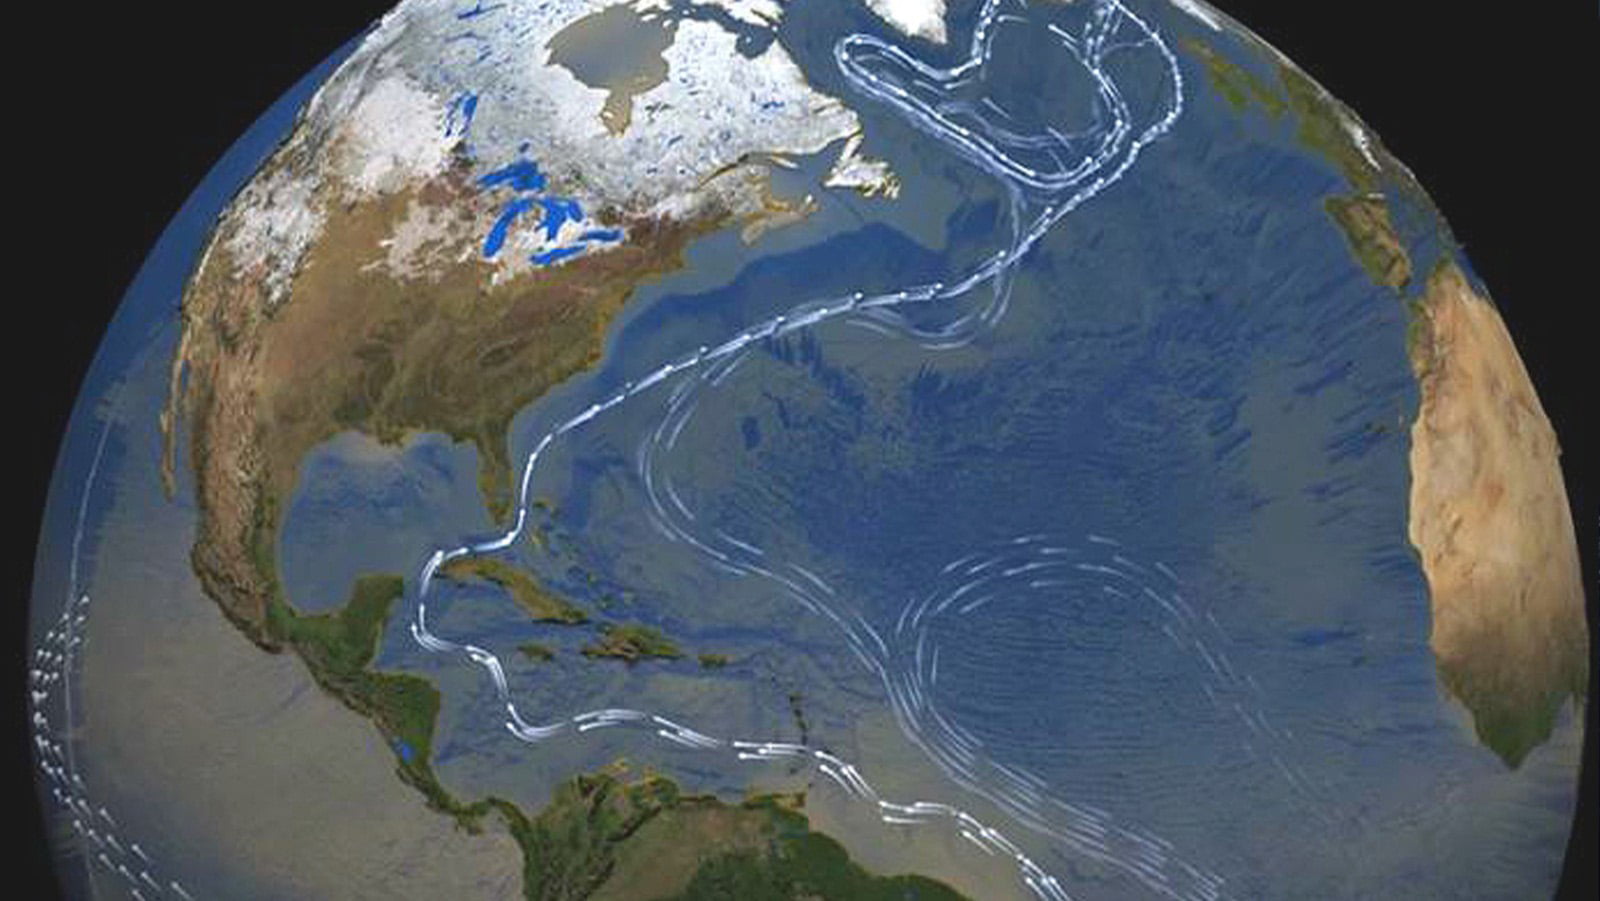
    The Gulf Stream current carries warm, salty water from the Gulf of Mexico northeastward. In the North Atlantic, this water cools and sinks and drifts southwestward, emerging centuries later in the Southern Ocean. Known as the Atlantic Meridional Overturning Circulation (AMOC), this circulation is critical, among other things, to Europe’s temperate climate. Since 1995, scientists have been warning that human-driven climate change is weakening the AMOC and may cause it to shut down entirely — which would have catastrophic consequences for our society.

    Comparison of ocean current speeds in the low-resolution (left) and high-resolution (right) simulations.
    Comparison of ocean current speeds in the low-resolution (left) and high-resolution (right) simulations.

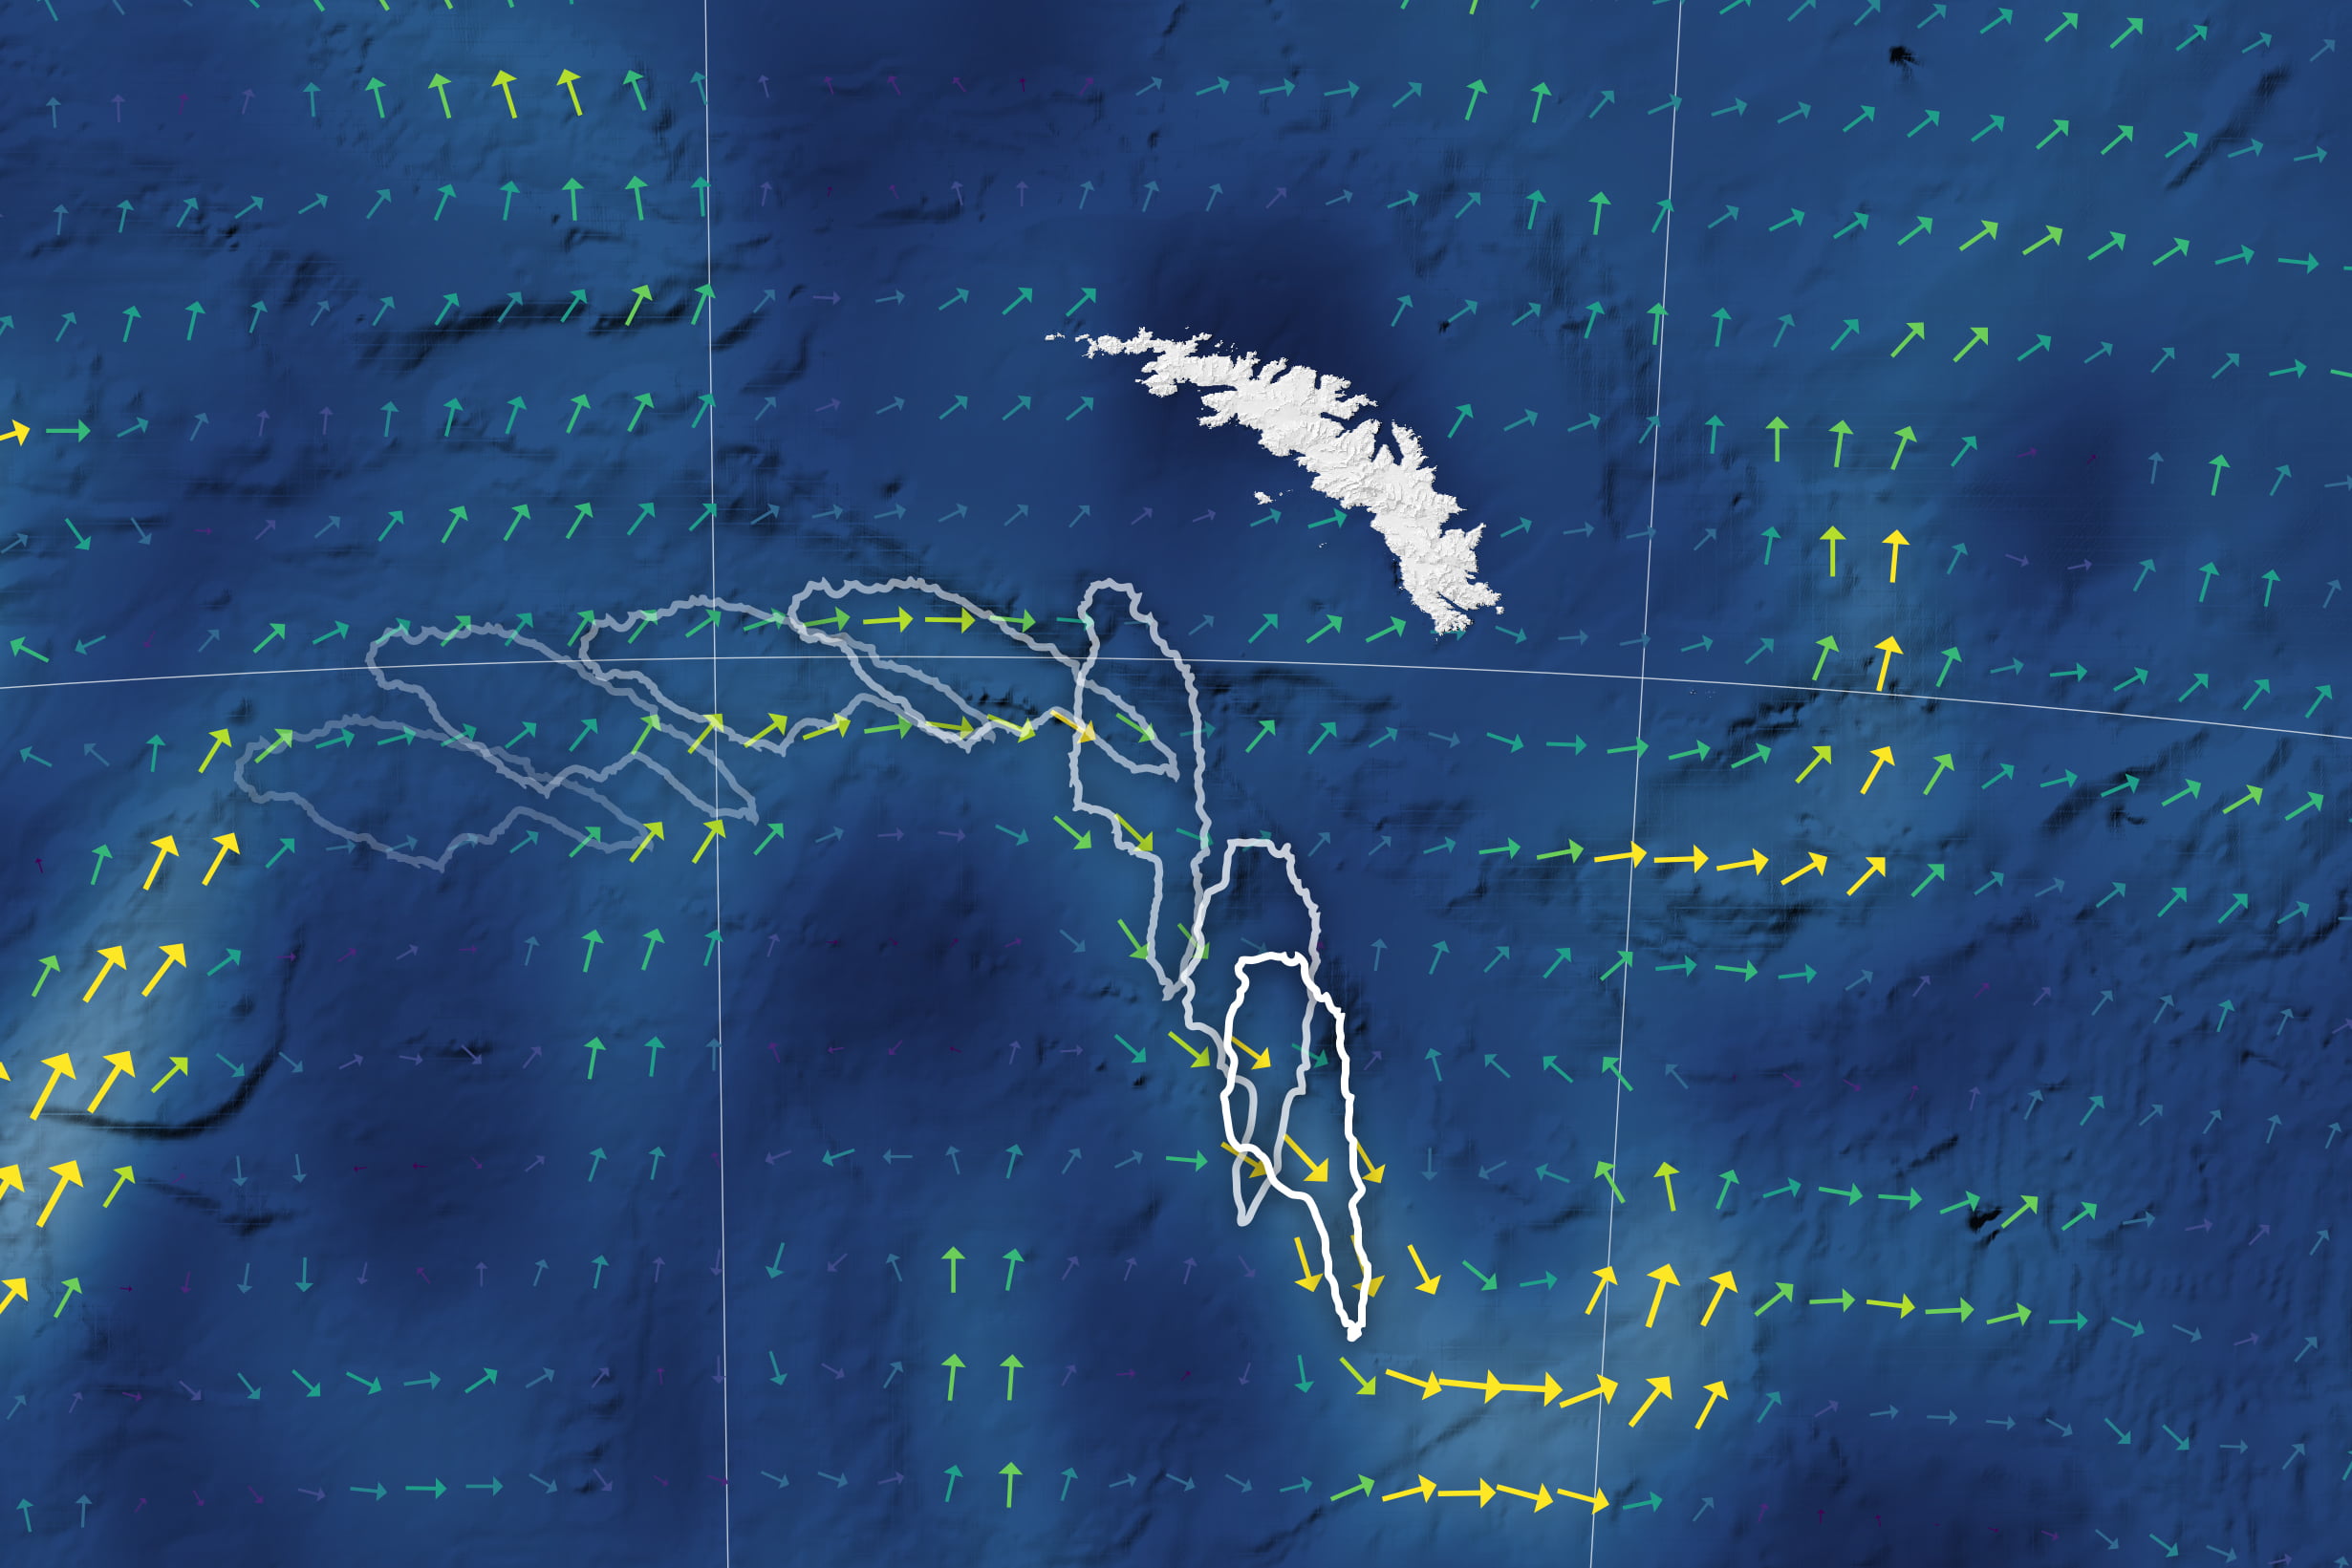
    A recent study re-examined the AMOC using both low- and high-resolution numerical simulations, combined with direct observations. Both simulations covered 1950 – 2100 and found the AMOC’s strength has declined since 1950. But the high-resolution simulation found significant regional variations in the AMOC’s behavior. Some regions saw localized strengthening, while other areas showed abrupt collapse. These sensitive shifts underscore the importance of driving toward higher resolutions in our next-generation climate models, if we want to better understand — and perhaps predict — what lies ahead as our climate changes. (Image credit: illustration – Atlantic Oceanographic and Meteorological Laboratory, simulations – R. Gou et al.; research credit: R. Gou et al.; via APS Physics)

  • Trapped in a Taylor Column

    Trapped in a Taylor Column

    The world’s largest iceberg, A23a, is stuck. It’s not beached; there are a thousand meters or more of water beneath it. But thanks to a quirk of the Earth’s rotation, combined with underwater topology, A23a is stuck in place, spinning slowly for the foreseeable future. A23a is trapped in what’s known as a Taylor column, a rotating column of fluid that forms above submerged objects in a rotating flow. You can see the same dynamics in a simple tabletop tank.

    Pirie Bank sticks up from the seafloor, which sets up a stationary column of rotating water that iceberg A23a is now stuck in.
    Pirie Bank sticks up from the seafloor, which sets up a stationary column of rotating water that iceberg A23a is now stuck in.

    When a tank (or planet) is rotating steadily, there’s little variation in flow with depth. With an obstacle at the deepest layer — in this case, an underwater rise known as the Pirie Bank — water cannot pass through that lowest layer. And that deflection extends to all the layers above. The water above Pirie Bank just stays there, as if the entire column is an independent object. Caught inside this region, A23a will remain imprisoned there. How long will that last? There’s no way to know for sure, but a scientific buoy in another nearby Taylor column has been hanging out there for 4 years and counting. (Image credit: A23a – D. Fox/BAS, diagram – IBSCO/NASA; via BBC News; submitted by Anne R.)

  • Turning the Beach Pink

    Turning the Beach Pink

    Lab experiments and numerical simulations can only take us so far; sometimes there’s no substitute for getting out into the field. That’s why a beach in San Diego turned pink this January and February, as researchers released a safe, non-toxic dye into an estuary. The goal is to understand how small freshwater sources mix with colder, saltier ocean waters when they meet in the surf zone. Differences in temperature and salinity both affect the waters’ density and, therefore, how they’ll combine, especially in the face of the turbulent surf. Using drones, distributed sensors, and a specially-outfitted jet ski, the researchers collect data about how the dye (and therefore the estuary’s water) spreads over the 24 hours following each dye release. Check out their experiment’s site to learn more. (Image credits: E. Jepsen/A. Simpson/UC San Diego; via SFGate; submitted by Emily R.)

  • Streaks of Sea Ice

    Streaks of Sea Ice

    As summer approaches in the Southern Ocean, sea ice melts, but the process is not purely one-way. Temperatures in some locations are cold enough for some limited new freezing. The result is a mix of ice conditions like those seen here. The oldest, thickest ice is part of the ice shelf in the image’s lower right. Normally, younger sea ice would nestle against this shelf, but strong winds have blown that ice north-eastward.

    In the open waters between, delicate frazil ice — tiny needle-like crystals — forms. The wind, coupled with the wave motion, drives the frazil ice together to form streaks of nilas, which eventually accumulate into a layer along the older, broken, windswept ice. (Image credit: J. Stevens/USGS; via NASA Earth Observatory)

  • Where Wind Meets Water

    Where Wind Meets Water

    That the wind causes ocean waves is obvious to anyone who has spent time near the water, but the details of that process remain fuzzy. Many of the explanations — like the Kelvin-Helmholtz instability — only explain part of the process, usually the beginning when the waves are very small. As the waves get larger, they affect the wind in turn, complicating matters.

    As messy as the theory gets, our ability to measure the wind and water in situ is limited, too. Just look at this wild research platform oceanographers designed to study wind and waves. It’s part of a 355-ft vessel that’s towed out to sea horizontally and then flipped so that 300 feet of it remain underwater to stabilize the remainder for measurements. Even with equipment like this, measuring the turbulent air and water near the ocean-sky interface is incredibly difficult.

    This review article gives a nice overview of different historical efforts to explain how wind makes waves and provides a snapshot of the latest research in the area. (Image credit: R. Bilcliff; see also N. Pizzo et al.)

  • Acidic Sea Spray

    Acidic Sea Spray

    As waves crash and break, they generate a spray of droplets — known as aerosols — that make their way into the atmosphere. Researchers investigated the chemistry of these aerosol droplets by generating spray in a wave tank filled with ocean water. They found that aerosol droplets are far more acidic than the ocean they come from, and the smaller the droplet, the more acidic it is. This acidification happens in a matter of minutes, as acidic gases interact with the spray. Their findings will be critical for accurately modeling the climate connections between our oceans and atmosphere. (Image credit: Elle; research credit: K. Angle et al.; via OceanBites; submitted by Kam-Yung Soh)

  • Following the Flow

    Following the Flow

    In early December 2020, the world’s largest iceberg — roughly 135 km long by 44 km wide — was heading straight for South Georgia Island. Luckily for the island, iceberg A-68A was being carried by ocean surface currents that approach the island before turning sharply southward. The enormous iceberg followed, rotating nearly 90 degrees and drifting away on faster currents.

    Scientists track these large-scale — 50 to 100 km wide — currents using satellites that measure the ocean height. Currents of this size actually generate a measurable tilt to the ocean surface, which scientists measure and use as input into models that estimate the surface currents’ speed and direction. (Image credit: L. Dauphin and J. Stevens; via NASA Earth Observatory)

  • Featured Video Play Icon

    Seismic Events Reveal Ocean Temperatures

    Decades ago, researchers proposed sending sound waves through the ocean to measure its temperature. Although the technique worked, it ran into noise pollution issues, but now it’s back, using naturally-occurring seismic events as the sound source.

    When fault lines shift, they generate seismic waves that travel through the ocean as sound. When they reach a land mass, the waves get converted back into seismic energy that’s then picked up by a receiver. Knowing the distance from the source to the receiver and the time necessary for the wave to travel, scientists can then determine the average temperature of the water based on the speed of sound.

    The technique can track temperature changes down to thousandths of a degree. Based on more than a decade of seismic data from the Indian Ocean, researchers found almost double the temperature increase measured by a different sensor network. (Image and video credit: Science; research credit: W. Wu et al.; submitted by Kam-Yung Soh)

  • Underwater Optical Illusions

    Underwater Optical Illusions

    On a hot day, it’s not unusual to catch a glimpse of a shimmering optical illusion over a hot road, but you probably wouldn’t expect to see the same thing 2,000 meters under the ocean. Yet that’s exactly what a team of scientists saw through the cameras of their unmanned submersible as it explored hydrothermal vents deep in the Pacific Ocean.

    At these depths, the pressure is high enough that water can reach more than 350 degrees Celsius without boiling. The hot fluid from the vents rises and gets caught beneath mineral overhangs, forming a sort of upside-down pool. Since the index of refraction of the hot water is different than that of the colder surrounding water, we see a mirror-like surface at some viewing angles. Be sure to check out the whole video for more examples of the illusion. (Image and video credit: Schmidt Ocean; via Smithsonian; submitted by Kam-Yung Soh)

  • Featured Video Play Icon

    Breaking

    As waves fold over and break, they trap air, creating bubbles of many sizes. The smallest of these bubbles can be only a few microns across and persist for long times compared to larger bubbles. When they burst, they create tiny droplets that can carry sea salt up into the atmosphere to seed rain. Understanding how these bubbles form and how many there are of a given size is key to predicting both oceanic and atmospheric behaviors. Numerical simulations like the one featured in the video above reveal the dynamic collisions that create these tiny bubbles and help researchers learn how to model the tiniest bubbles so that future simulations can be faster. (Image and video credit: W. Chan et al.)