Motion in the ocean is driven by many factors, including temperature, salinity, geography, and atmospheric interactions. While global currents dictate much of the large-scale motion, it’s sometimes the smaller scales that impact the climate. This visualization shows numerically simulated data from the Southern Ocean over the course of a year. The eddies that swirl off from the main currents are responsible for much of the mixing that occurs between areas of different temperature, which ultimately impacts large-scale temperature distributions, in this case affecting the flux of heat toward Antarctica. (Video credit: I. Rosso, A. Klocker, A. Hogg, S. Ramsden; submitted by S. Ramsden)
Tag: ocean currents

Sea Surface Temperatures
This video shows sea surface temperature results and their seasonal variation from a numerical simulation modeling circulation in the atmosphere and oceans. Modeling such enormous problems requires the development of reasonable models of the turbulent physics, clever algorithms to quickly progress the solutions, relatively low-fidelity (a single grid node may cover tens of kilometers), and enormous computing power. (Video credit: NOAA; via Gizmodo)
How the Sun Drives the Earth
This video describes how the sun’s energy drives wind and ocean currents on earth. As solar winds stream forth from the sun, our magnetosphere deflects the brunt of the impact (creating auroras at the poles) while the atmosphere, land masses, and oceans absorb thermal energy from the sun’s light. Because of our cycles of day and night and the differences in how land, water, and ice absorb heat, temperature differentials around the earth drive a massive heat engine, causing the circulation of water and wind all around our world. Numerical simulations like the ones underlying this video are vital for the prediction of climate and weather, as well as for developing models and techniques that can be applied to other problems in science and engineering. (Video credit: NASA; via Gizmodo)
Salinity Near the Amazon
This numerical simulation shows the variation of salinity in the Atlantic Ocean near the mouth of the Amazon River over the course of 36 months. The turbulent mixing of the fresh river water and salty ocean shifts with the ebb and flooding of the river. Salt content causes variations in ocean water density, which can strongly affect mixing and transport properties between different depths in the ocean due to buoyancy. Understanding this kind of flow helps predict climate forecasts, rain predictions, ice melting and much more. (Video credit: Mercator Ocean)
Visualizing Ocean Currents
Researchers used computational models of ocean currents to produce this video visualizing worldwide ocean surface currents from June 2005 through December 2007. Dark patterns under the ocean are representative of ocean depths and have been exaggerated to 40x; land topography is exaggerated to 20x. Notice the wide variety of behaviors exhibited in the simulation: some regions experience strong recirculation and eddy production, while others remain relatively calm and unmoving. Occasionally strong currents sweep long lines across the open waters, carrying with them warmth and nutrients that encourage phytoplankton blooms and other forms of ocean life. (Video credit: NASA; submitted by Jason S)

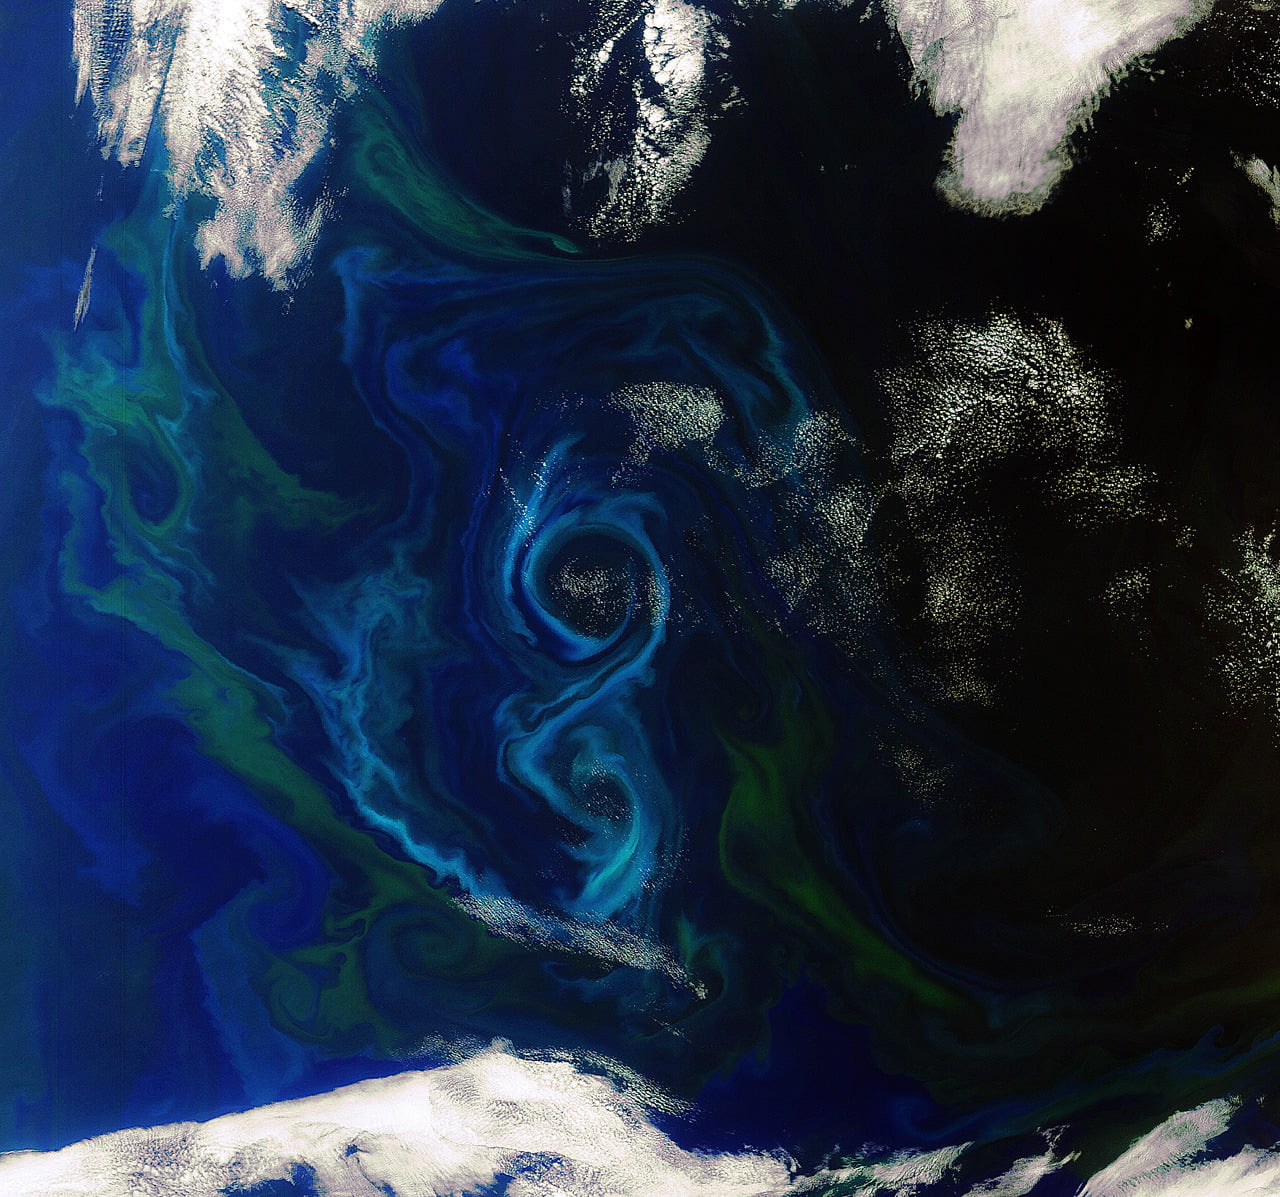
Oceanic Swirls
Mixing of surface waters with deeper ocean currents brings together the minerals and nutrients used by phytoplankton, resulting in gorgeous swirls of color in the ocean. These phytoplankton blooms are most common in the spring and summer, and while lovely, can be harmful to other marine life, either through the production of toxins or by depleting the waters of oxygen. Because the phytoplankton move according to the wind and waves, they can also form a sort of natural flow visualization. (Photo credit: ESA)
———-
While FYFD is not blacking out for SOPA/PIPA, we would like to take a moment to register our protest and encourage those of you who are Americans to take a moment to let Congress know that you don’t approve of these bills. Although we agree that protection of copyright holders rights is important, the measures proposed in these bills reach far beyond that line. FYFD, as a site that reposts photos and videos primarily created by others, could be taken down as a result of these bills, despite the purpose of the website as a tool for educational outreach and dissemination of science. Please support a free and uncensored Internet!

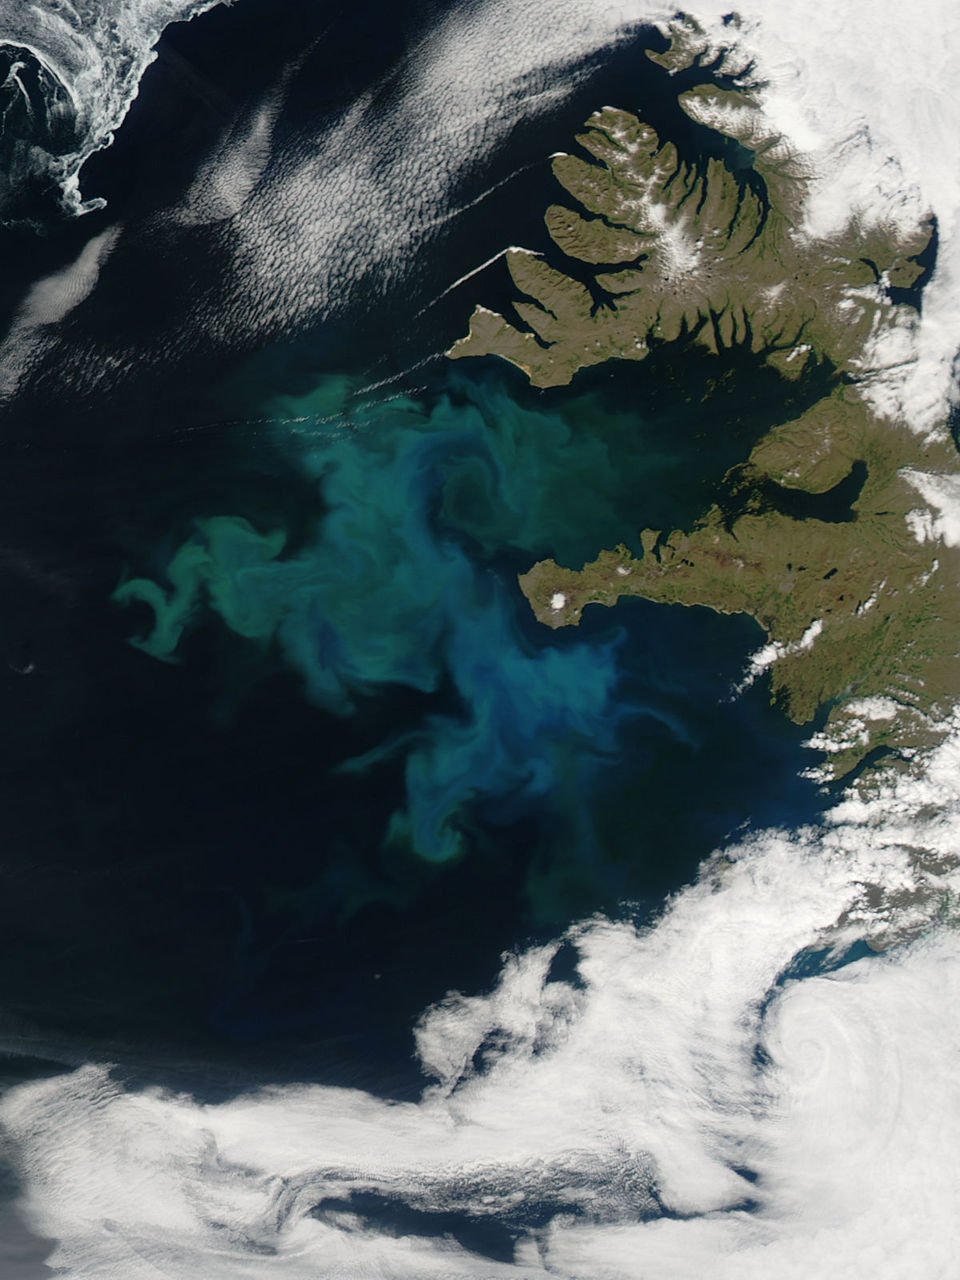
Phytoplankton in Bloom
Phytoplankton blooms, aside from giving us gorgeous eddies of blue and green, can reveal how ocean currents are mixing. Blooms typically occur where nutrients are being washed together. #