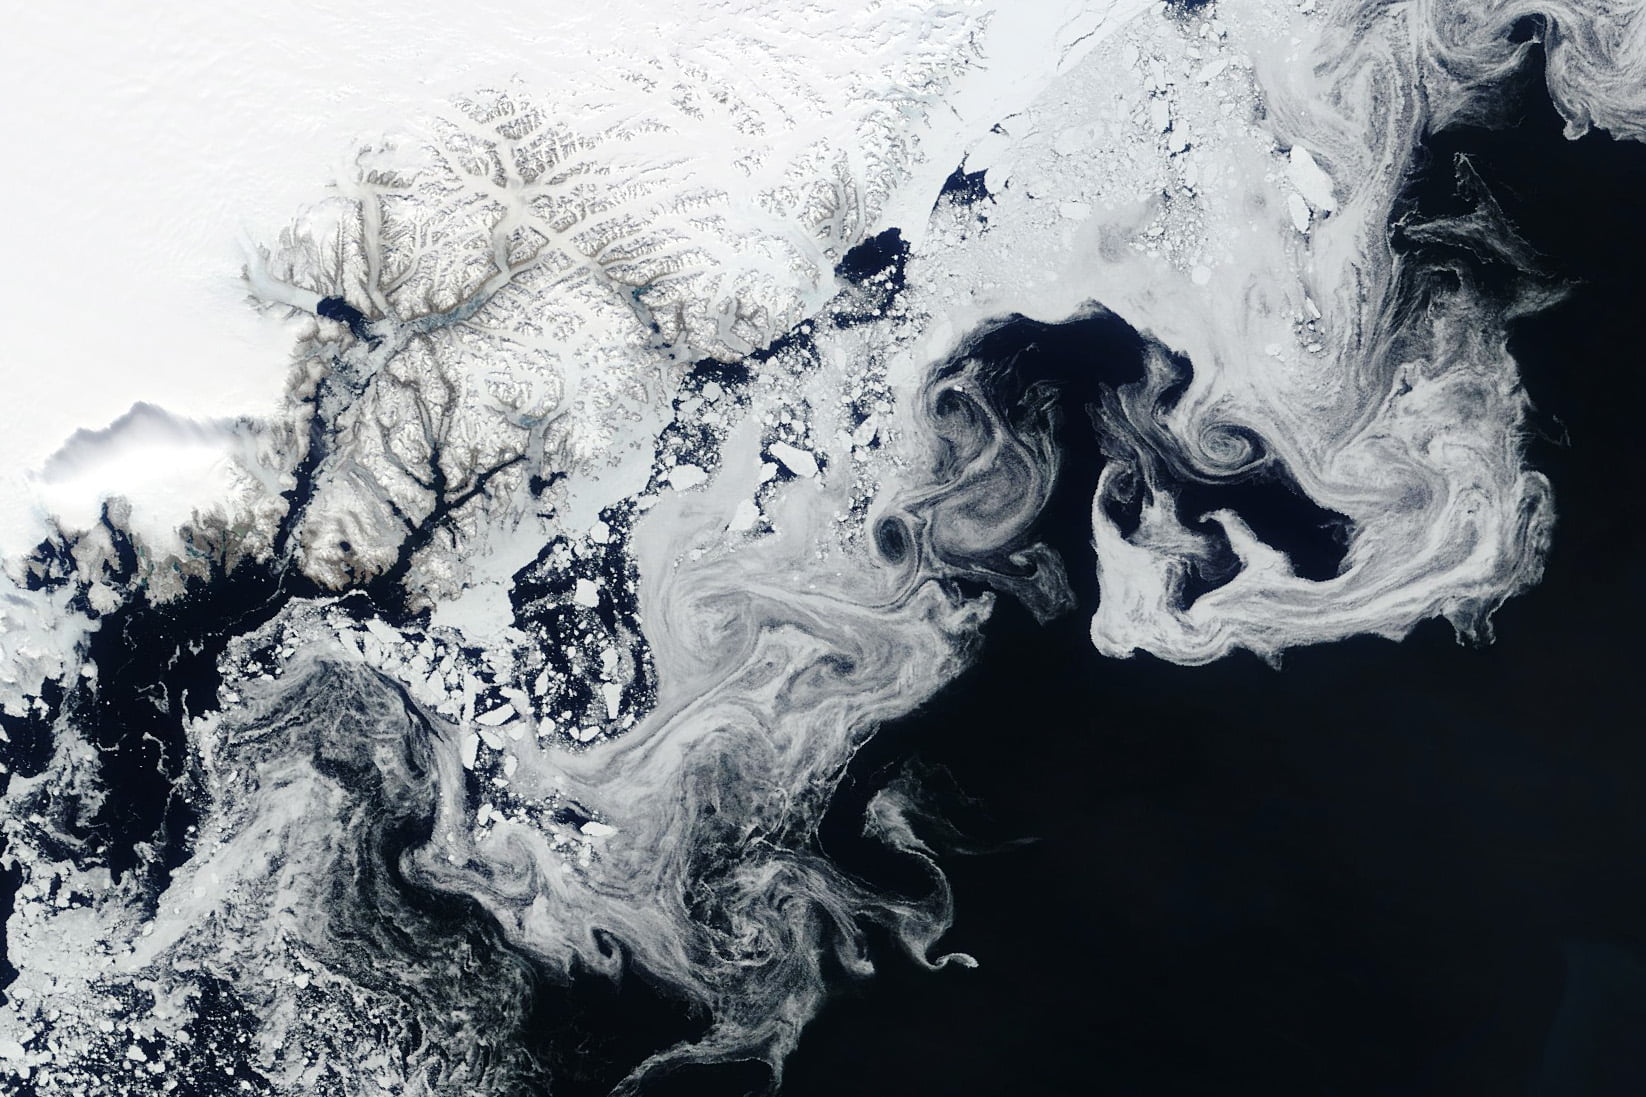
Fragments of sea ice tumble and swirl in this satellite image of Greenland’s east coast. In spring, Arctic sea ice journeys down the Fram Strait between Greenland and Svalbard. Along the way, large ice floes break — and melt — into smaller pieces. Large pieces of sea ice are visible closer to the coastline, but the smaller individual floes get, the wispier they appear in the satellite image. In the haziest portions of the image, the ice may be only meters across. In recent years, less and less Arctic sea ice has survived the journey southward, shifting the temperature and salinity of Arctic contributions to global ocean circulation. (Image credit: W. Liang; via NASA Earth Observatory)
Tag: ocean currents

Measuring Ocean Upwelling
Large-scale ocean circulation is critical to our planet’s health and climate. In this process, seawater near the poles cools and sinks into the deep ocean, carrying dissolved carbon and nutrients with it. Later, that cold water gets pushed back up to the surface elsewhere, where it warms, and the cycle repeats. Although the theory behind this circulation has been around for decades, it’s been difficult to observe the rise, or upwelling, of water from the depths. But a recent study used a fluorescent, non-toxic dye to measure upwelling directly.
Researchers deployed 200 liters of dye just above the floor of a marine canyon near Ireland, then monitored the dye’s movement for several days at a depth of 2200. They found that turbulence along the slope of the canyon drove upwelling at speeds of about 100 meters per day, much faster than global rates. The authors suggest that this kind of topographically-enhanced upwelling could be a major factor in setting overall ocean circulation. (Image credit: visualization – NASA, ship – S. Nguyen; research credit: B. Wynne-Cattanach et al.; via Physics World)

Resolution Effects on Ocean Circulation
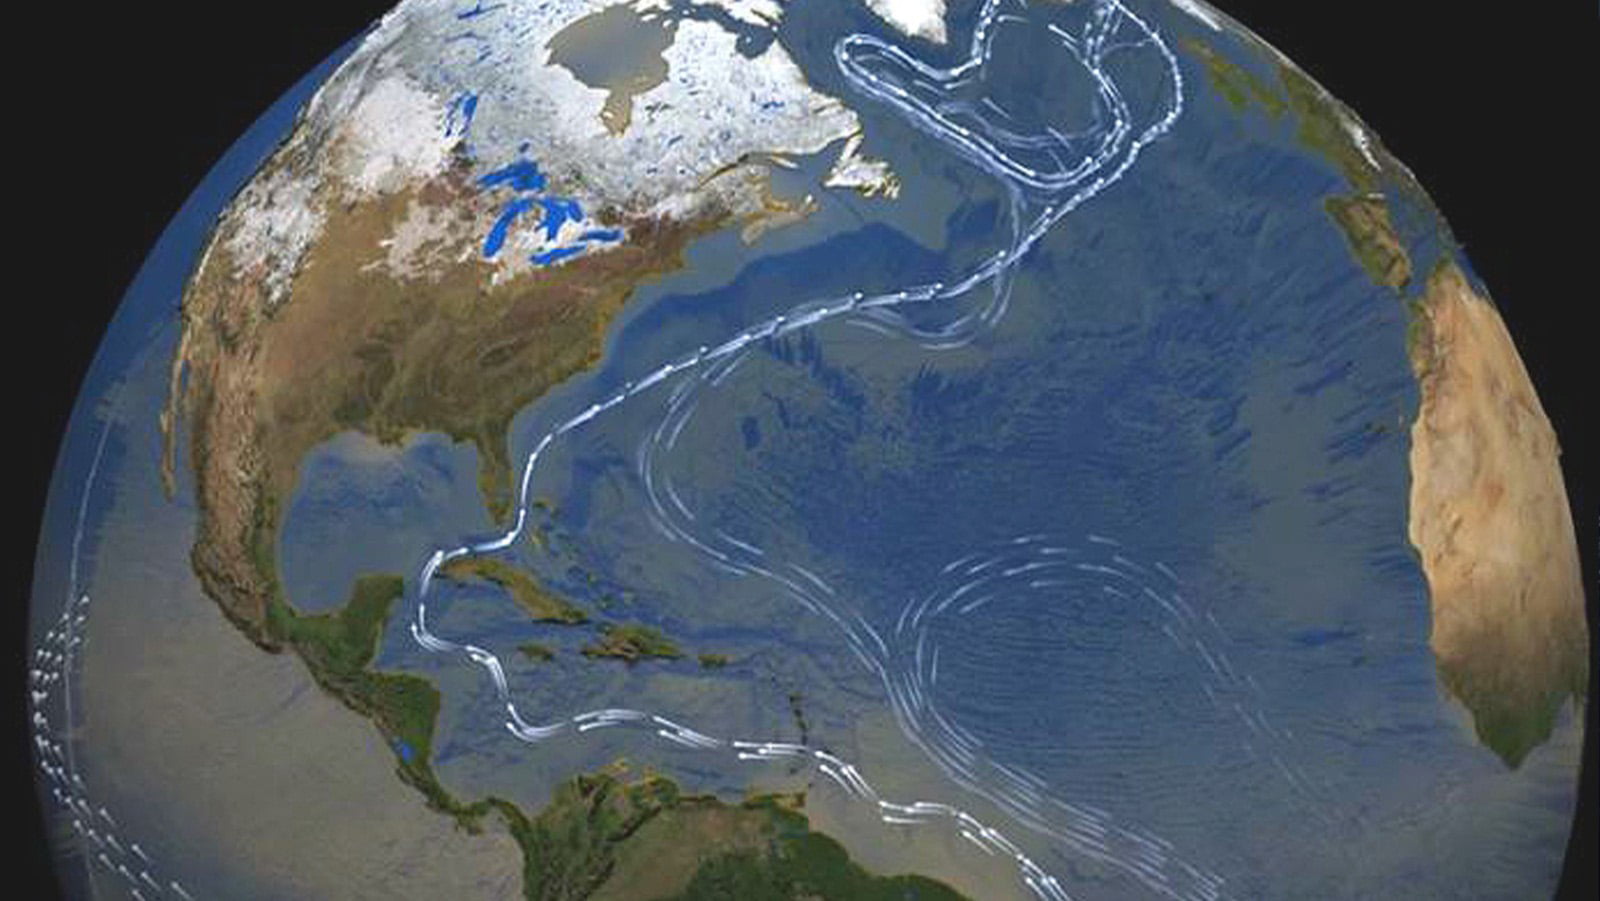
The Gulf Stream current carries warm, salty water from the Gulf of Mexico northeastward. In the North Atlantic, this water cools and sinks and drifts southwestward, emerging centuries later in the Southern Ocean. Known as the Atlantic Meridional Overturning Circulation (AMOC), this circulation is critical, among other things, to Europe’s temperate climate. Since 1995, scientists have been warning that human-driven climate change is weakening the AMOC and may cause it to shut down entirely — which would have catastrophic consequences for our society.

Comparison of ocean current speeds in the low-resolution (left) and high-resolution (right) simulations. A recent study re-examined the AMOC using both low- and high-resolution numerical simulations, combined with direct observations. Both simulations covered 1950 – 2100 and found the AMOC’s strength has declined since 1950. But the high-resolution simulation found significant regional variations in the AMOC’s behavior. Some regions saw localized strengthening, while other areas showed abrupt collapse. These sensitive shifts underscore the importance of driving toward higher resolutions in our next-generation climate models, if we want to better understand — and perhaps predict — what lies ahead as our climate changes. (Image credit: illustration – Atlantic Oceanographic and Meteorological Laboratory, simulations – R. Gou et al.; research credit: R. Gou et al.; via APS Physics)

Breaking Ocean Currents


Our global ocean currents move enough water to dwarf the flow of all Earth’s rivers. This worldwide circulation is driven largely by density and the movements of cold, salty water versus warmer, fresher water. The pump behind this action lies in the North Atlantic, where cold, salty water sinks down in the Atlantic Meridional Overturning Circulation, or AMOC. Among other things, AMOC is responsible for Western Europe’s relatively mild climate compared to similarly northern lands.
Unfortunately, as our world warms, AMOC gets weaker. That means less cold water sinking in the North Atlantic and a smaller driving force behind global oceanic circulation. There is even a small but real chance that global warming breaks our ocean current system entirely and drastically changes climates around the world in ways that cannot be easily fixed. Watch the full video to learn more. (Video and image credit: It’s Okay To Be Smart)

Following the Flow
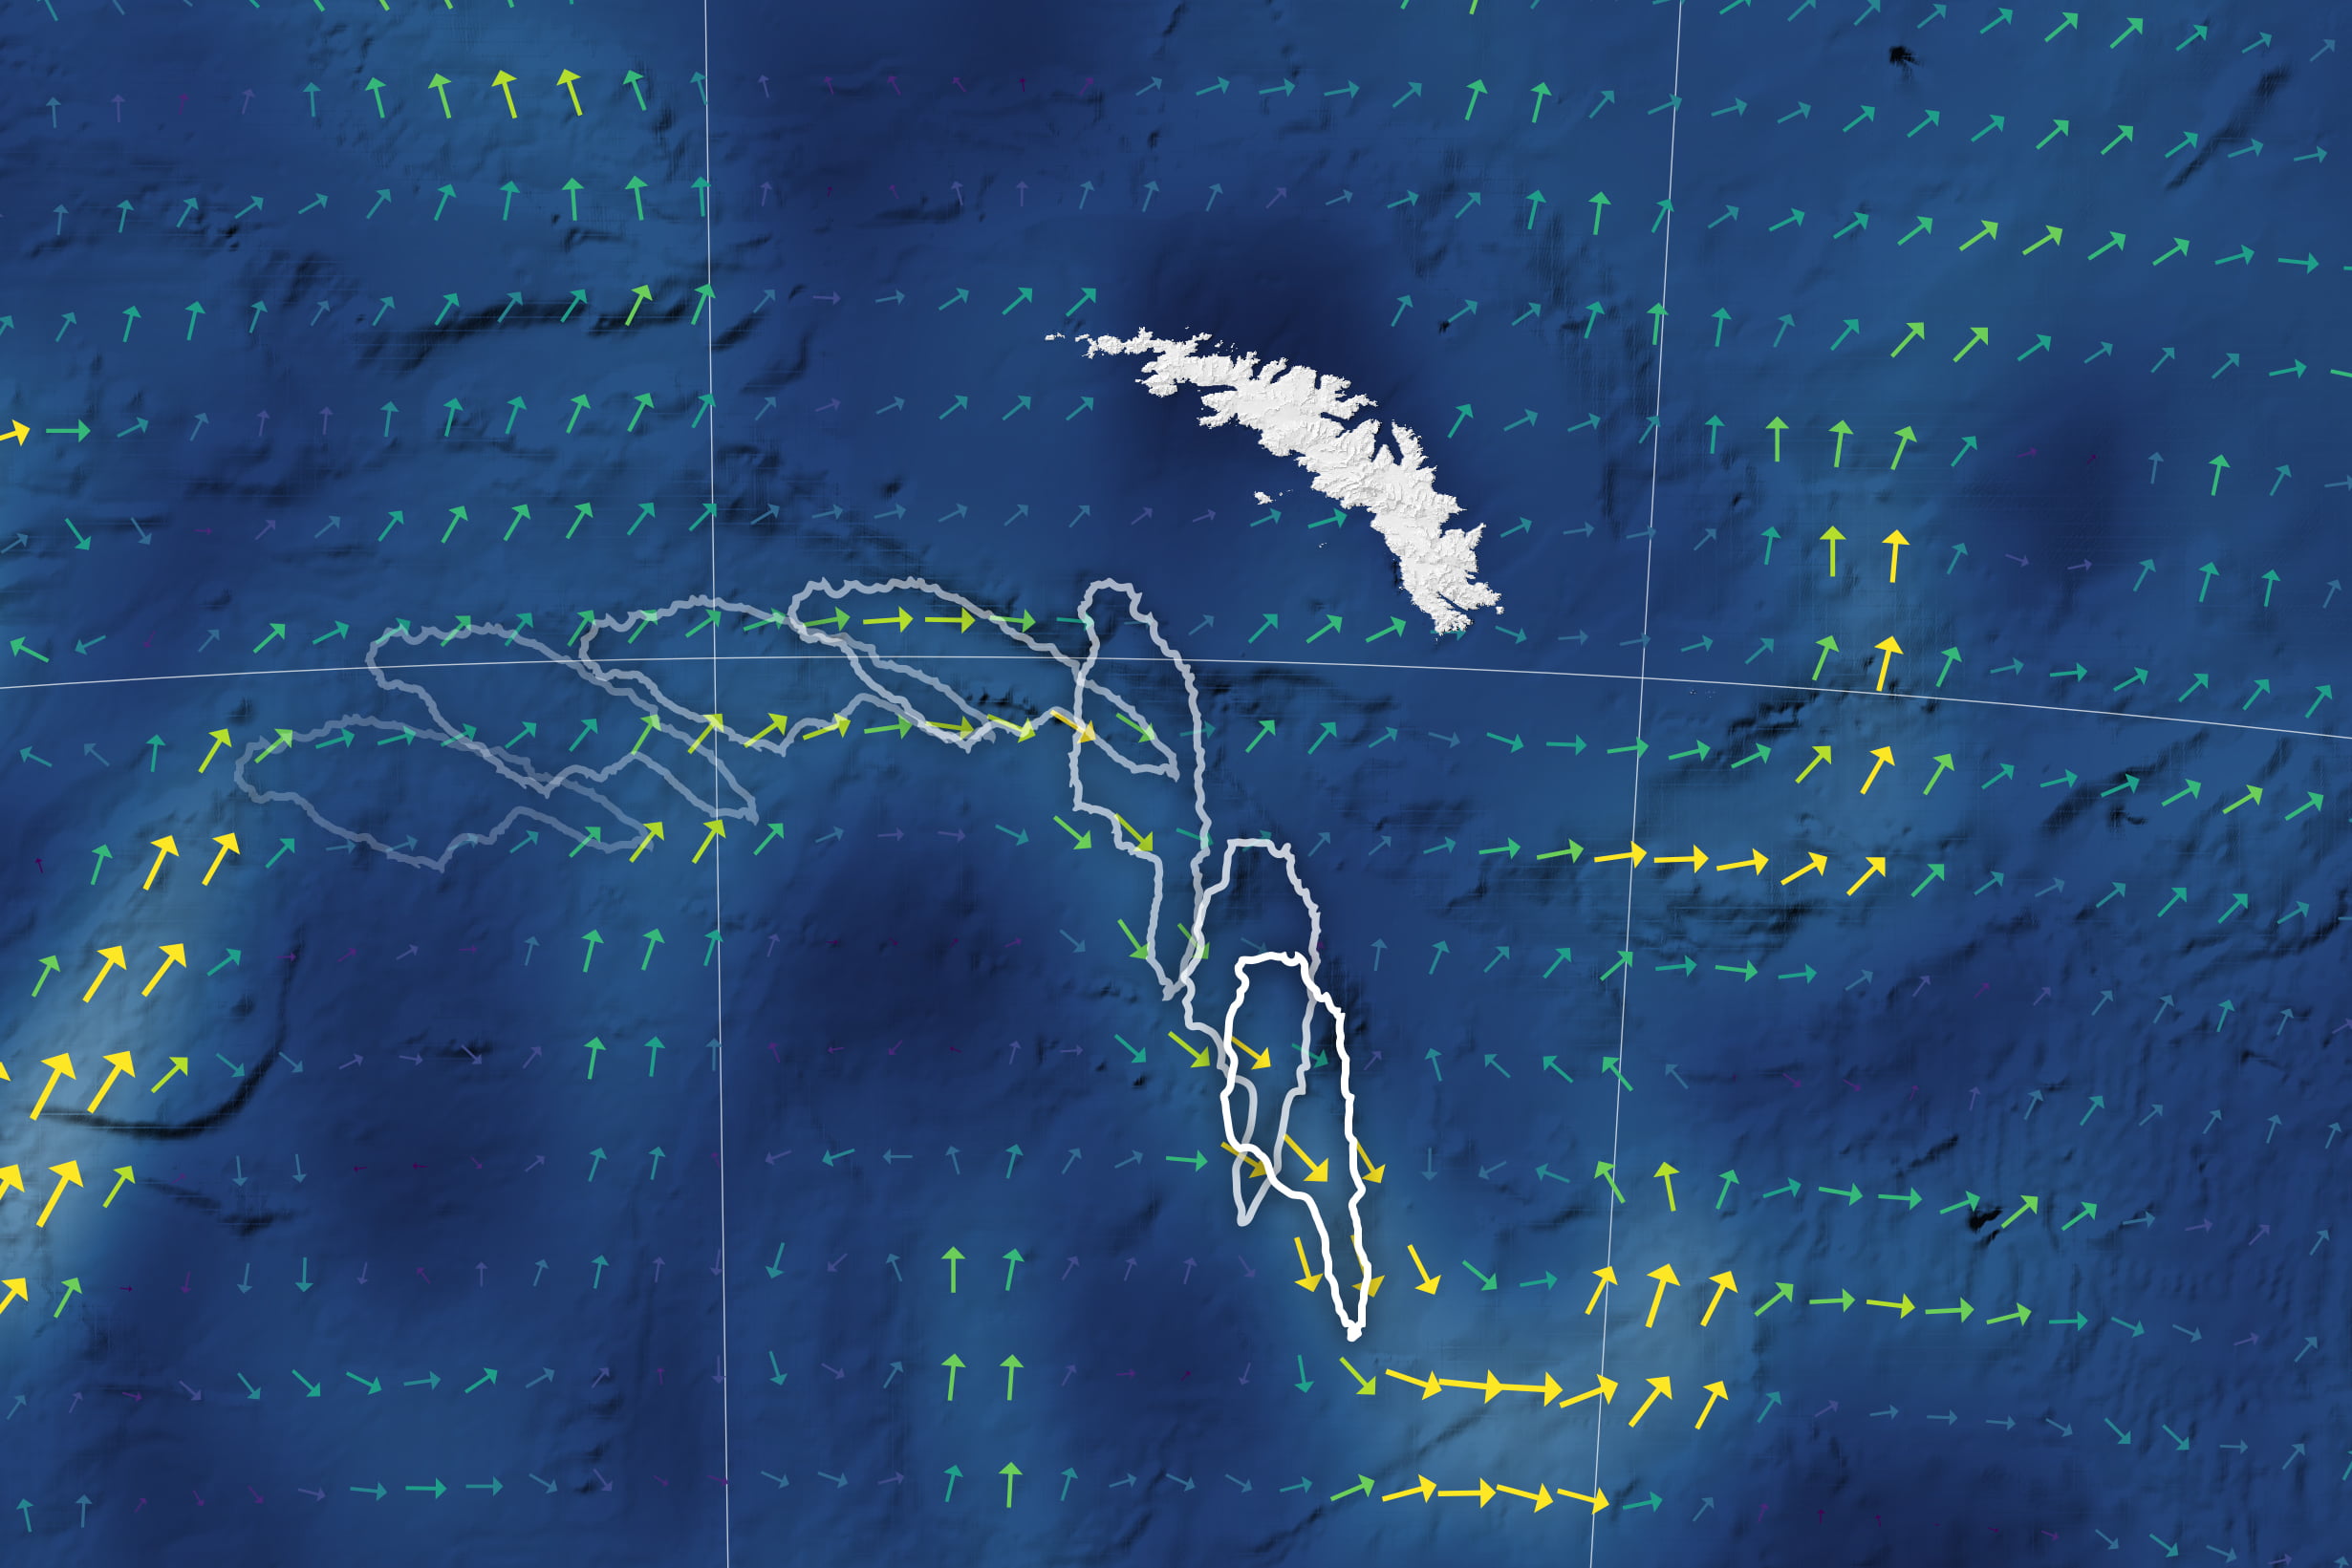
In early December 2020, the world’s largest iceberg — roughly 135 km long by 44 km wide — was heading straight for South Georgia Island. Luckily for the island, iceberg A-68A was being carried by ocean surface currents that approach the island before turning sharply southward. The enormous iceberg followed, rotating nearly 90 degrees and drifting away on faster currents.
Scientists track these large-scale — 50 to 100 km wide — currents using satellites that measure the ocean height. Currents of this size actually generate a measurable tilt to the ocean surface, which scientists measure and use as input into models that estimate the surface currents’ speed and direction. (Image credit: L. Dauphin and J. Stevens; via NASA Earth Observatory)

The Naruto Whirlpools


Enormous whirlpools are not simply the work of overactive imaginations. There are several spots in the world, including Japan’s Naruto Strait, that regularly see these spectacular vortices.
Naruto’s whirlpools are formed through the interaction of tidal currents with the local topography. Spring tides funneled through the vee-shaped strait can reach speeds of 20 kph as they rush between the Pacific Ocean and the Inland Sea. Below the surface, there’s also a deep depression that helps bring the tides together in such a way that it generates vortices 20 meters in diameter.
In normal times, the whirlpools are a significant tourist attraction during the springtime. Travelers can view them from tour boats, helicopters, and from the Onaruto Bridge. (Image credits: whirlpools – Mainichi/N. Yamada, Discover Tokushima; artwork: Hiroshige; via Mainichi; submitted by Alan M.)

Colorful Tides
This false-color satellite image — the recent winner of NASA Earth Observatory’s Tournament Earth 2020 — shows sands and seaweed off the coast of the Bahamas. Ocean currents and tides eroded these elaborate fluted designs in much the same way that winds sculpt desert dunes. The overlap in form is no accident; as seen in recent work, researchers are finding that both air and water move granular materials like sand according to the same rules. (Image credit: S. Andrefouet; via NASA Earth Observatory)

Swirling Blooms
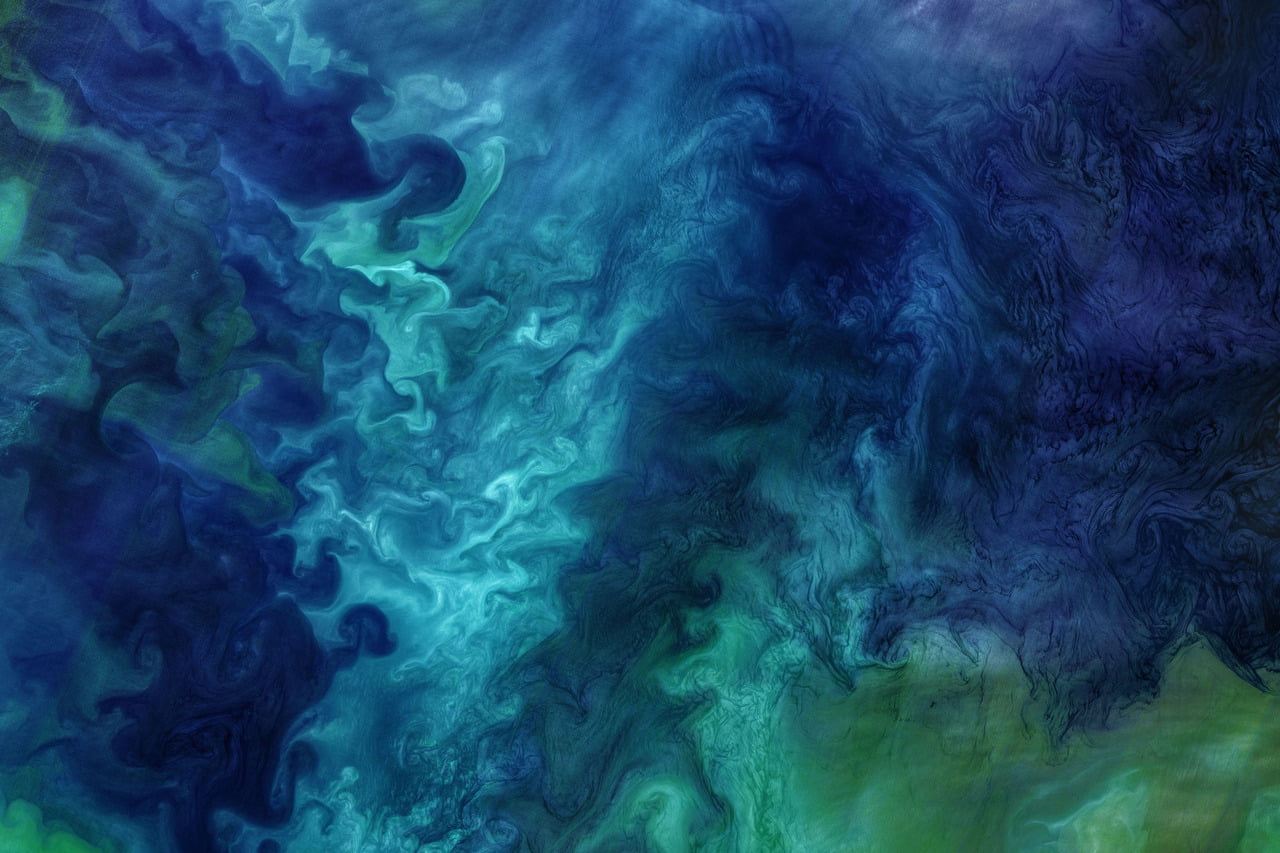
Every summer, as the ice melts, the waters of the Chukchi Sea off the Alaskan coast come alive with phytoplankton blooms. In satellite images like this one, they can look like abstract paintings formed from swirling colors. In the Chukchi Sea, two main currents collide. One, water from the Bering Sea, is cold, salty, and nutrient-rich. This is the preferred home to phytoplankton known as diatoms, which are responsible for some of the greenish hues seen here.
Coccolithophores, another variety of phytoplankton, prefer the warmer, less salty Alaskan coastal waters. Despite a relative lack of nutrients, the coccolithophores thrive, creating the milky turquoise color seen in the image. Knowing these characteristics of the phytoplankton, observing the growth of blooms over time may tell scientists about how the flows in these areas shift and change from year to year. (Image credit: NASA; via NASA Earth Observatory)
Tornadoes, Fire, and Ice


It’s time for another look at breaking fluid dynamics research with the latest FYFD/JFM video! This time around, we tackle some geophysical fluid dynamics, like listening to the sounds newborn tornadoes make below the range of human hearing; studying how melting ice affects burning oil spills; and how salt sinking from sea ice affects the ocean circulation. Check out the full video below for much more! If you’ve missed any of the previous videos in the series, you can check them out here. (Image and video credit: T. Crawford and N. Sharp)
Mediterranean Currents
Ocean currents play a major role in the weather and climate of our planet. This video shows a simulation of the surface ocean currents in the Mediterranean and Atlantic over an 11-month period. Each second corresponds to 2.75 days. You’ll see many swirling eddies in the Mediterranean and more flow along the coastlines in the Atlantic. One observation worth noting: near the end of the video, you’ll notice that flow through the Strait of Dover between England and France changes its direction, flowing back and forth depending on tidal forces. In contrast, flow through the Strait of Gibraltar is always into the Mediterranean (within the timescale of the simulation, at least). This net in-flow to the Mediterranean is due in part to the warm waters there evaporating at a higher rate than the cooler Atlantic. (Video credit: NASA; via Flow Viz; h/t to Ralph L)


