Complicated shock wave patterns envelope vehicles traveling at supersonic and hypersonic speeds. A shock wave is essentially a very tiny region–only a few mean free path lengths wide–over which flow conditions, including density, pressure, velocity, and temperature, change drastically. The image above shows a model of the Space Shuttle at a re-entry-like, high angle of attack at around Mach 20 in one of NASA Langley’s historic helium tunnels. The eerie glow outlining the shock structures around the model is a result of electron-beam fluorescence. In this flow visualization technique, a beam of high-energy electrons is swept over the model, causing the gas molecules to fluoresce according to temperature. (Photo credit: NASA Langley)
Tag: NASA Langley

Oil Flow Viz
Fluorescent oil sprayed onto a model in the NASA Langley 14 by 22-Foot Subsonic Wind Tunnel glows under ultraviolet light. Airflow over the model pulls the initially even coat of oil into patterns dependent on the air’s path. The air accelerates around the curved leading edge of the model, curling up into a strong lifting vortex similar to that seen on a delta wing. At the joint where the wings separate from the body those lifting vortices appear to form strong recirculation zones, as evidenced by the spiral patterns in the oil. Dark patches, like those downstream of the engines could be caused by an uneven application of oil or by areas of turbulent flow, which has larger shear stress at the wall than laminar flow and thus applies more force to move the oil away. Be sure to check out NASA’s page for high-resolution versions of the photo. (Photo credit: NASA Langley/Preston Martin; via PopSci)

Supersonic Oil Flow Viz
This image shows oil-flow visualization of a cylindrical roughness element on a flat plate in supersonic flow. The flow direction is from left to right. In this technique, a thin layer of high-viscosity oil is painted over the surface and dusted with green fluorescent powder. Once the supersonic tunnel is started, the model gets injected in the flow for a few seconds, then retracted. After the run, ultraviolet lighting illuminates the fluorescent powder, allowing researchers to see how air flowed over the surface. Image (a) shows the flat plate without roughness; there is relatively little variation in the oil distribution. Image (b) includes a 1-mm high, 4-mm wide cylinder. Note bow-shaped disruption upstream of the roughness and the lines of alternating light and dark areas that wrap around the roughness and stretch downstream. These lines form where oil has been moved from one region and concentrated in another, usually due to vortices in the roughness wake. Image © shows the same behavior amplified yet further by the 4-mm high, 4-mm wide cylinder that sticks up well beyond the edge of the boundary layer. Such images, combined with other methods of flow visualization, help scientists piece together the structures that form due to surface roughness and how these affect downstream flow on vehicles like the Orion capsule during atmospheric re-entry. (Photo credit: P. Danehy et al./NASA Langley #)

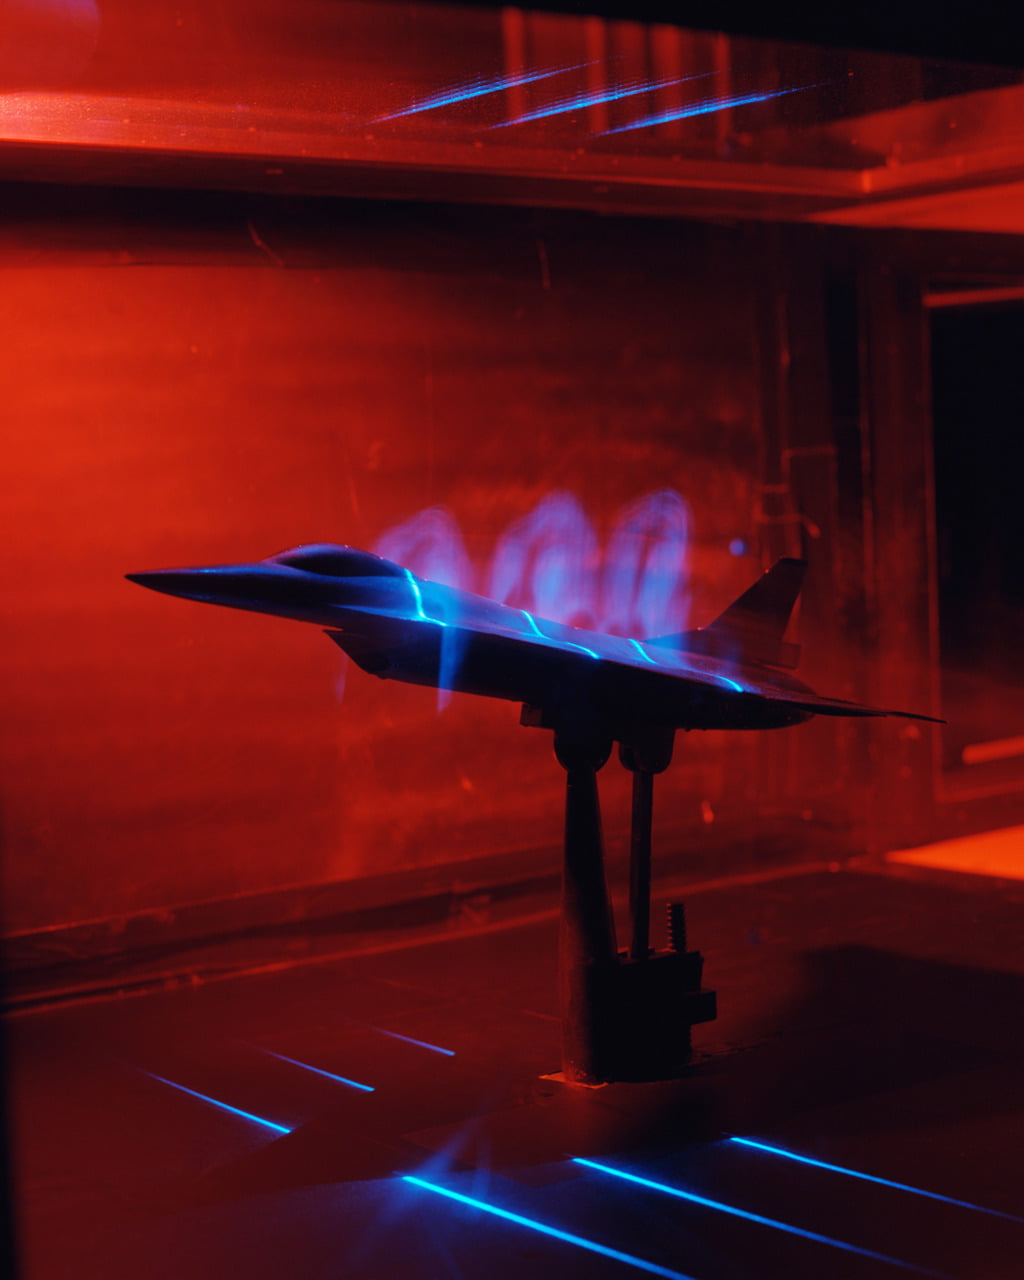
Smoke Visualization on an F-16
Flow around an F-16XL Scamp model is visualized using smoke illuminated by laser sheets. Lasers are common equipment in fluids laboratories; they’re useful for flow visualization and for many velocimetry techniques.

Langley’s Transonic Dynamics Tunnel
NASA Langley’s Transonic Dynamics Tunnel (TDT) recently celebrated 50 years of operation. It’s 16 x 16 ft test section has hosted models of many aircraft, including the Lockheed Electra, the C-141, the F-15, the F-16, and the FA-18 shown above. The tunnel is primarily utilized for aeroelastic studies of flutter, a potentially catastrophic phenomenon where aerodynamic forces couple to a structure’s natural modes of vibration. (via JediOliver and NASA_Langley)