Tag: glacier

  • Slipping Ice Streams

    Slipping Ice Streams

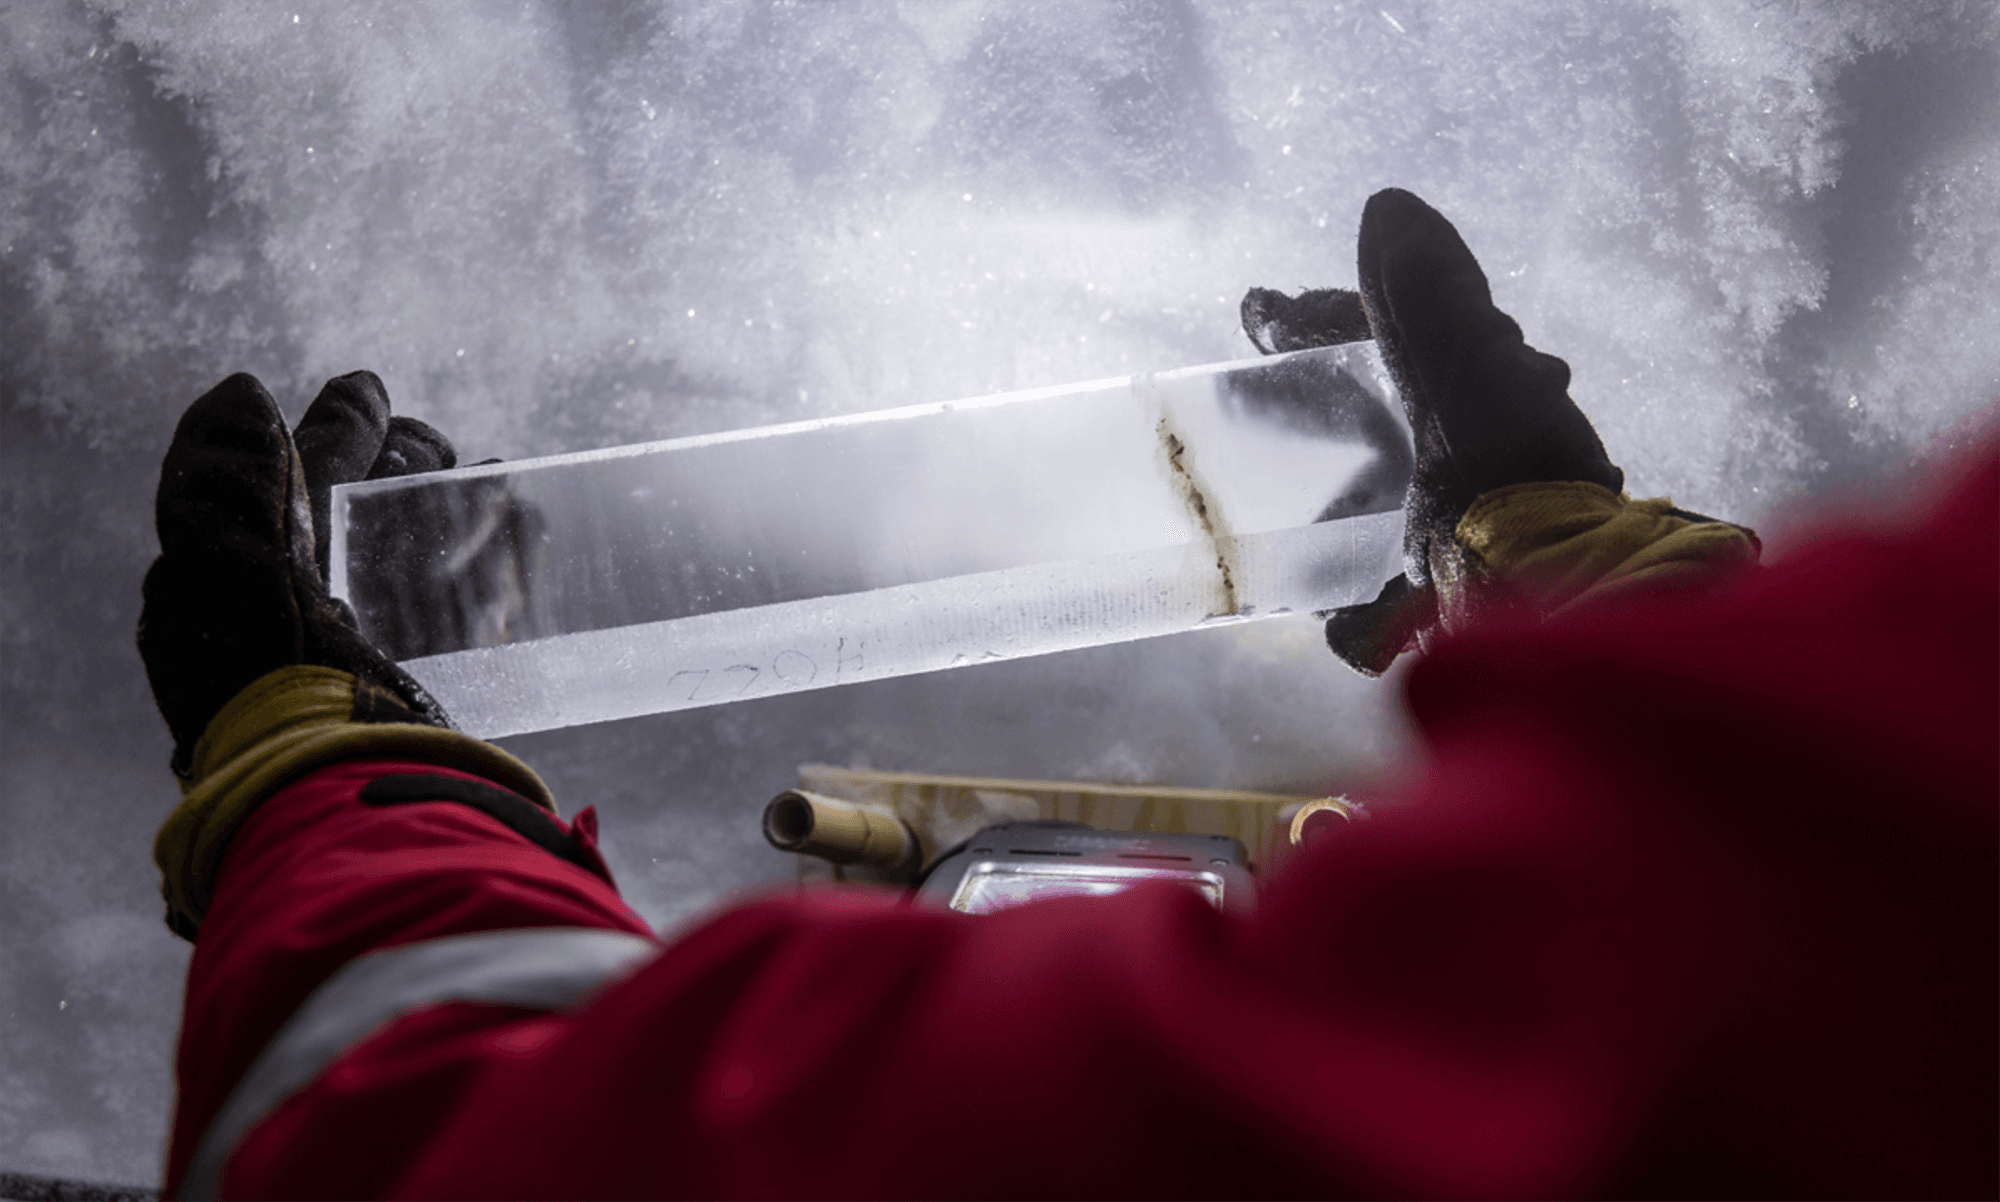
    The Northeast Greenland Ice Stream provides about 12% of the island’s annual ice discharge, and so far, models cannot accurately capture just how quickly the ice moves. Researchers deployed a fiber-optic cable into a borehole and set explosive charges on the ice to capture images of its interior through seismology. But in the process, they measured seismic events that didn’t correspond to the team’s charges.

    Instead, the researchers identified the signals as small, cascading icequakes that were undetectable from the surface. The quakes were signs of ice locally sticking and slipping — a failure mode that current models don’t capture. Moreover, the team was able to isolate each event to distinct layers of the ice, all of which corresponded to ice strata affected by volcanic ash (note the dark streak in the ice core image above). Whenever a volcanic eruption spread ash on the ice, it created a weaker layer. Even after hundreds more meters of ice have formed atop these weaker layers, the ice still breaks first in those layers, which may account for the ice stream’s higher-than-predicted flow. (Image credit: L. Warzecha/LWimages; research credit: A. Fichtner et al.; via Eos)

    Fediverse Reactions
  • Tracking Meltwater Through Flex

    Tracking Meltwater Through Flex

    Greenland’s ice sheet holds enough water to raise global sea levels by several meters. Each year meltwater from the sheet percolates through the ice, filling hidden pools and crevasses on its way to draining into the sea. Monitoring this journey directly is virtually impossible; too much goes on deep below the surface and the ice sheet is a precarious place for scientists to operate. So, instead, they’re monitoring the bedrock nearby.

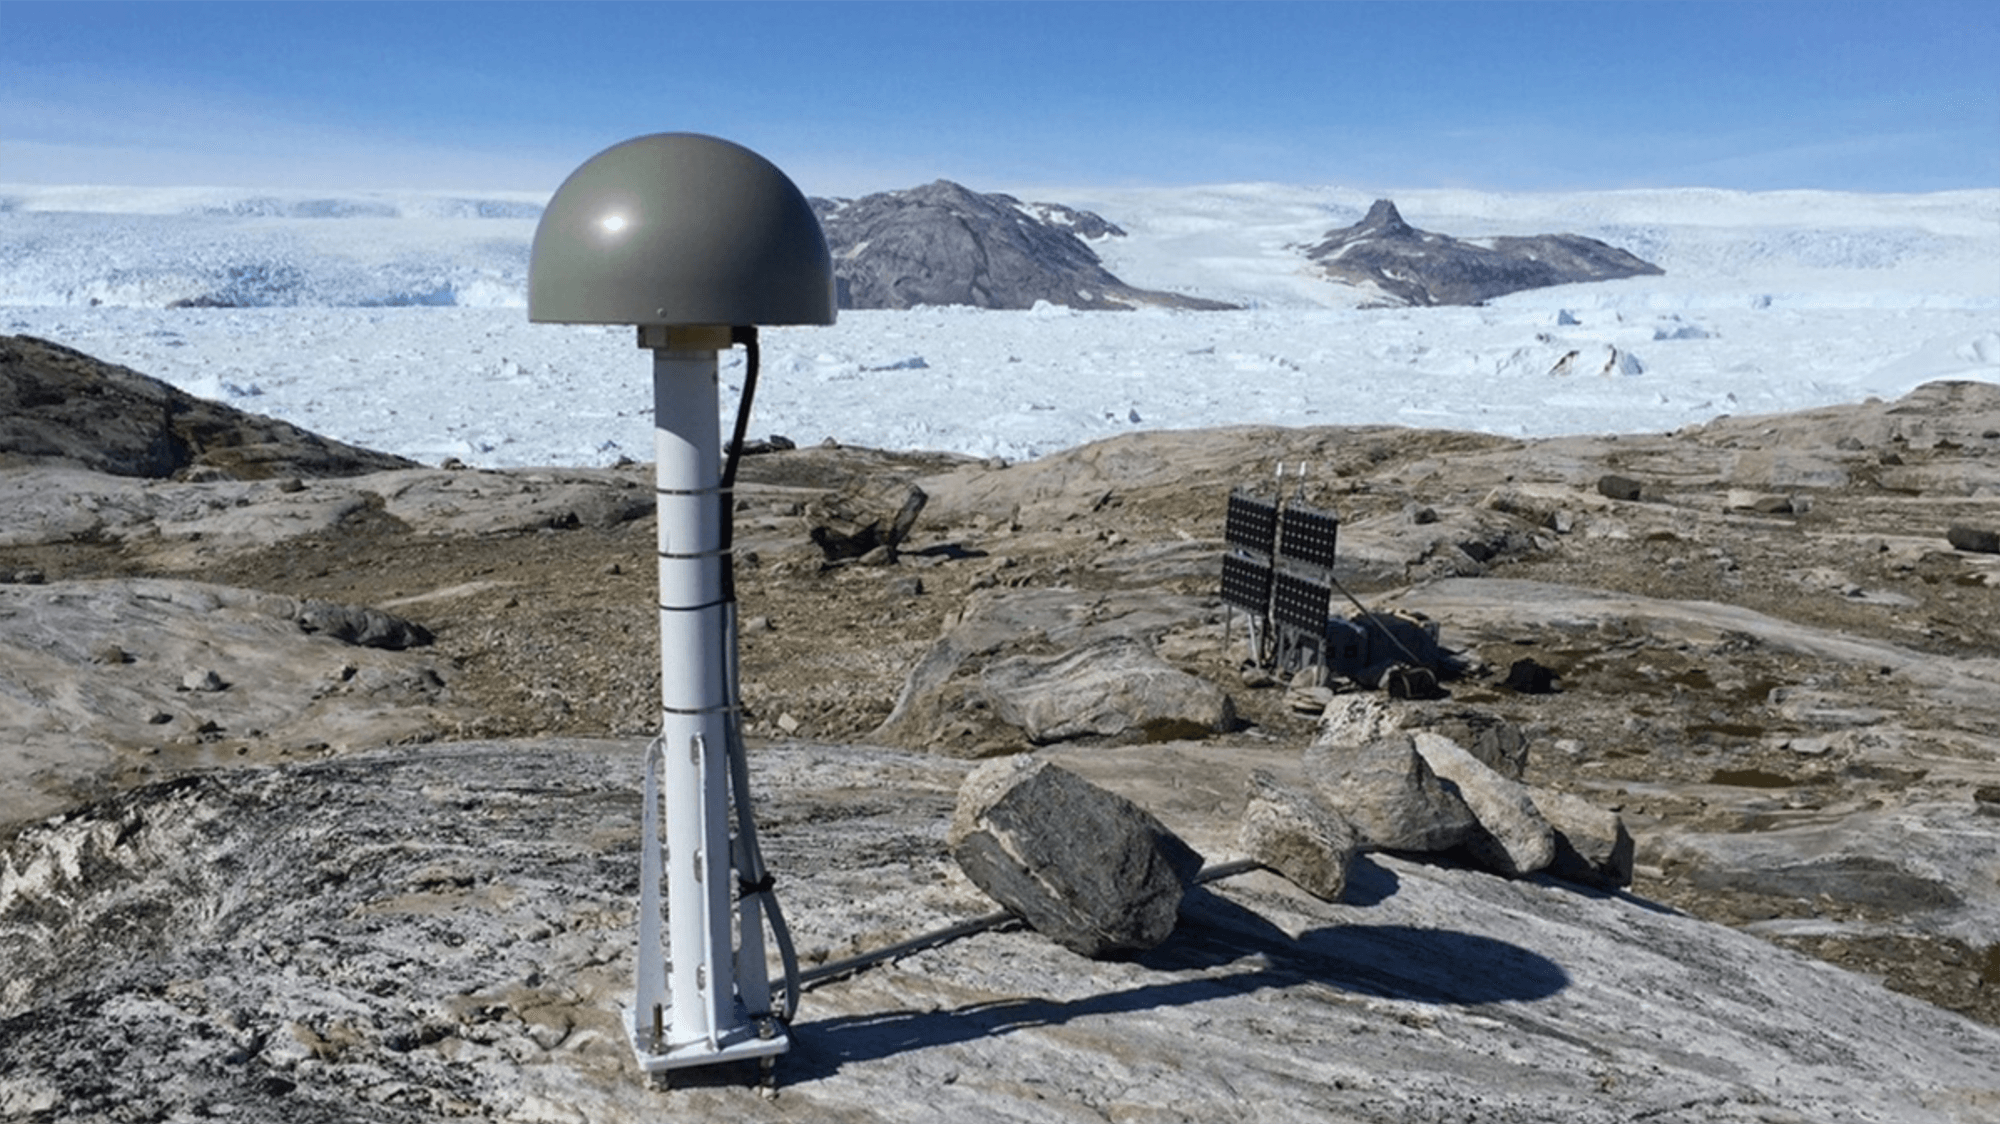
    Researchers used a network of Global Navigation Satellite System (GNSS) stations like the one above to track how the ground shifted and flexed as meltwater collected and moved. They found that the bedrock moved as much as 5 millimeters during the height of the summer melt. How quickly the ground relaxed back to its normal state depended on where the water went and how quickly it moved. Their results indicate that the water’s journey is not a short one: meltwater spends months collecting in subterranean pools on its way to the ocean — something that current climate models don’t account for. Overall, the team’s results indicate that there’s much more hidden meltwater than models predict and it spends a few months under the ice on its way to the sea. (Image credit: T. Nylen; research credit: J. Ran et al.; via Eos)

    Fediverse Reactions
  • Glacial Tributaries

    Glacial Tributaries

    Just as rivers have tributaries that feed their flow, small glaciers can flow as tributaries into larger ones. This astronaut photo shows Siachen Glacier and four of its tributaries coming together and continuing to flow from the top to the bottom of the image. The dark parallel lines running through the glaciers are moraines, where rocks and debris are carried along by the ice. Those seen here are medial moraines left by the joining of tributaries. When glaciers retreat, moraines are often left behind, strewn with sediment that ranges from the fine powder of glacial flour all the way to enormous boulders. (Image credit: NASA; via NASA Earth Observatory)

    Fediverse Reactions
  • Featured Video Play Icon

    “Colors of Glacial Rivers”

    As glaciers flow, they grind down rock, creating fine sediment that dyes waterways a milky color. In Jan Erik Waider’s aerial film, we get a bird’s eye view of the result, watching pockets of sediment move downstream in pulsating waves and swirls. Along the coast, ocean waves pass over the internal ones, creating a mesmerizing crisscrossed wavescape. You can also compare Waider’s aerial footage to Roman De Giuli’s tabletop-scale films and be amazed by their similarities. (Image and video credit: J. Waider; via Colossal)

  • Slushy Snow Affects Antarctic Ice Melt

    Slushy Snow Affects Antarctic Ice Melt

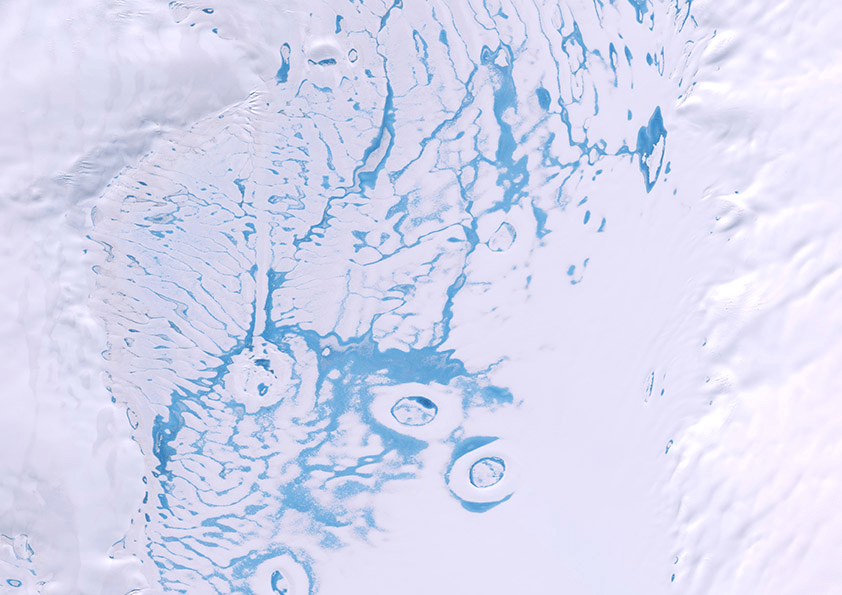
    More than a tenth of Antarctica’s ice projects out over the sea; this ice shelf preserves glacial ice that would otherwise fall into the Southern Ocean and raise global sea levels. But austral summers eat away at the ice, leaving meltwater collected in ponds (visible above in bright blue) and in harder-to-spot slush. Researchers taught a machine-learning algorithm to identify slush and ponds in satellite images, then used the algorithm to analyze nine years’ worth of imagery.

    The group found that slush makes up about 57% of the overall meltwater. It is also darker than pure snow, absorbing more sunlight and leading to more melting. Many climate models currently neglect slush, and the authors warn that, without it, models will underestimate how much the ice is melting and predict that the ice is more stable than it truly is. (Image credit: Copernicus Sentinel/R. Dell; research credit: R. Dell et al.; via Physics Today)

  • “Earth’s Treasure”

    “Earth’s Treasure”

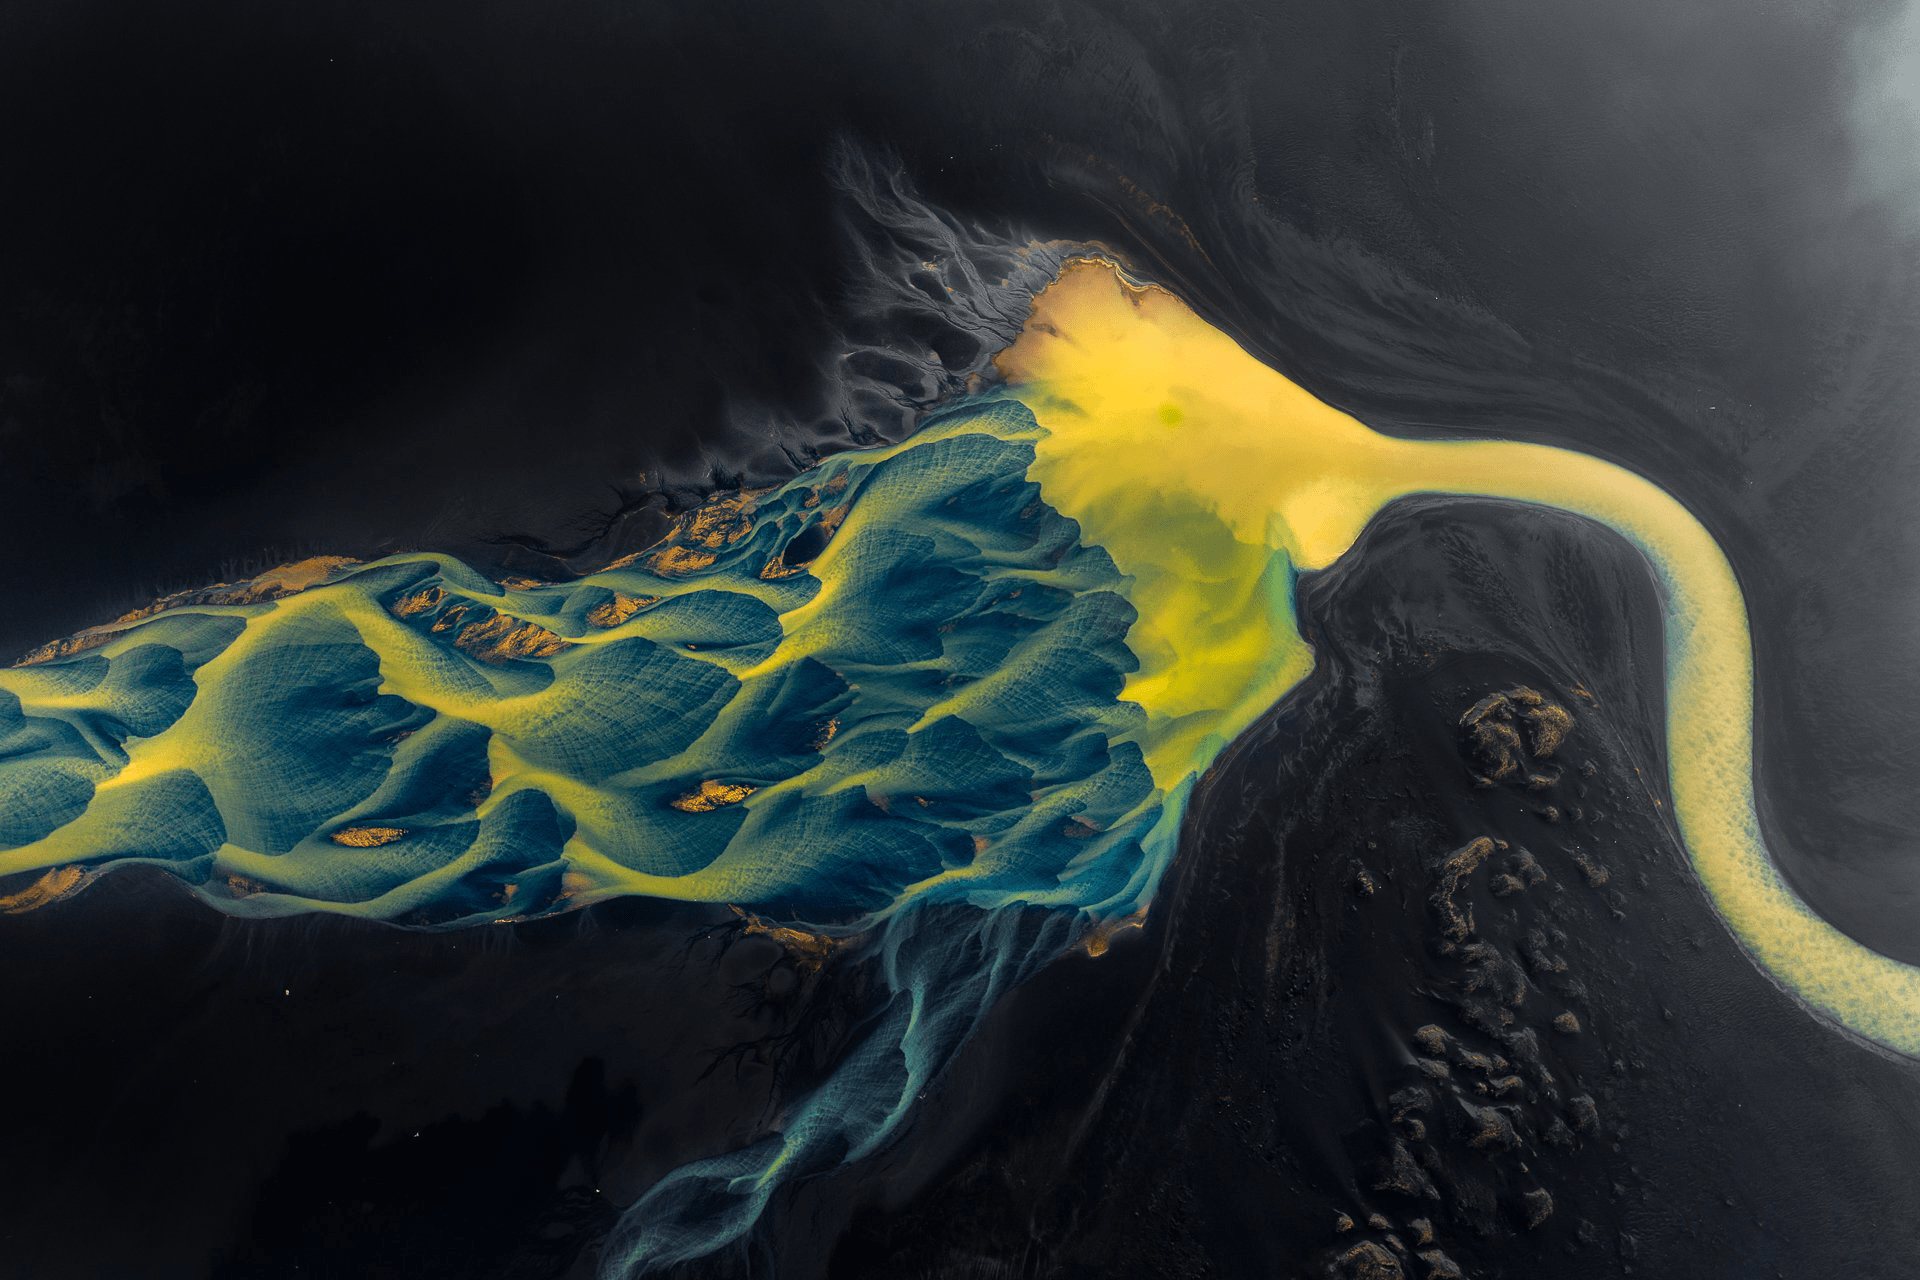
    Streams of blue and yellow braid across Iceland’s volcanic landscape in this award-winning photo from Miki Spitzer. Glacial water shows an icy blue and sediments glisten in gold. Together, their interplay creates an arresting delta viewed from above. (Image credit: M. Spitzer; via WNPA)

  • Fire in Ice

    Fire in Ice

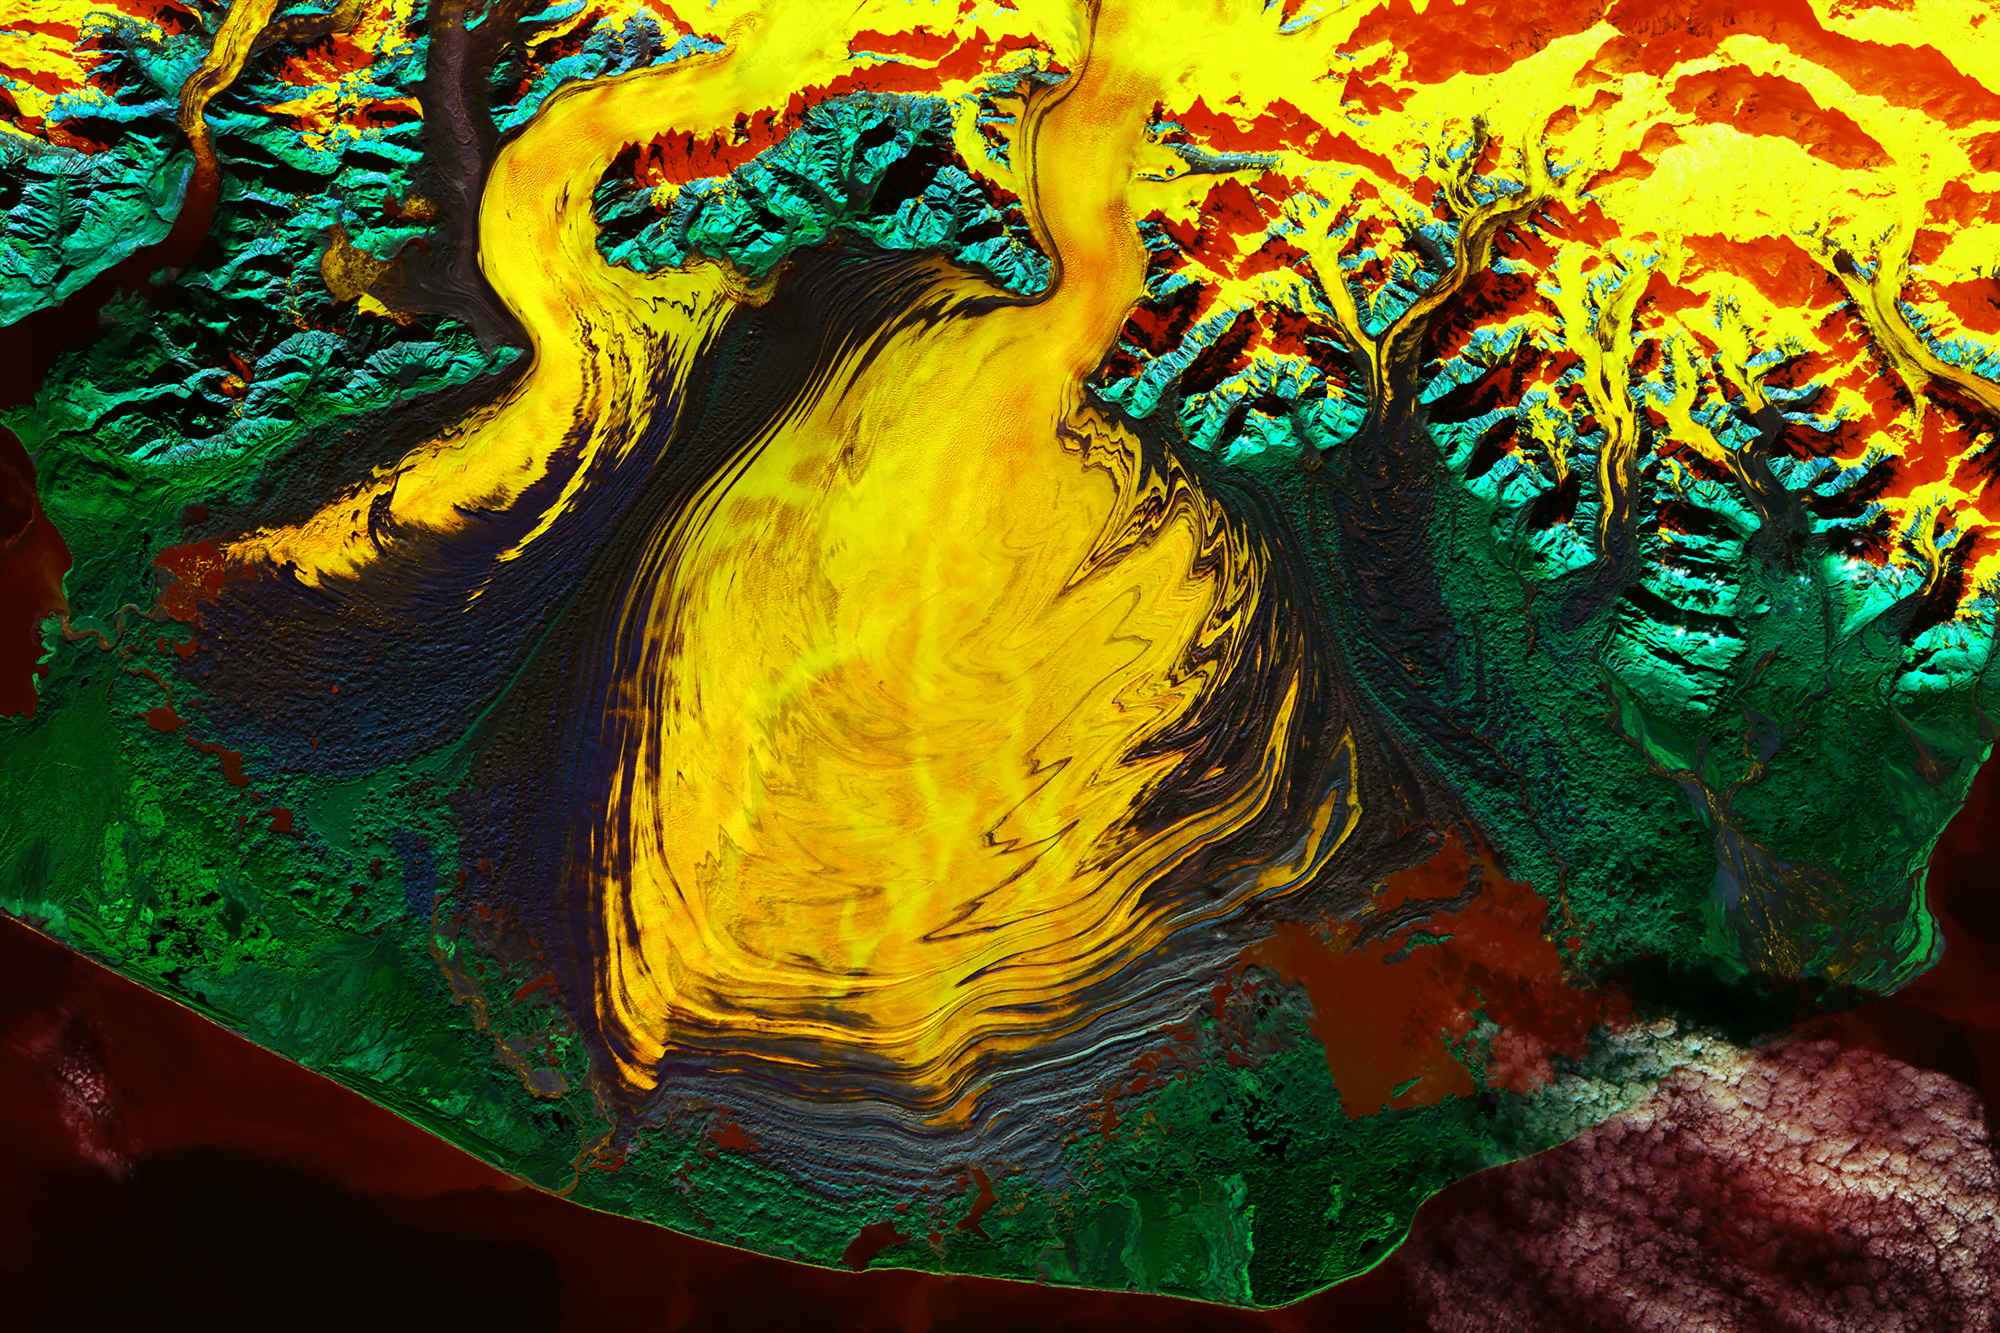
    This false-color satellite image of Malaspina Glacier (Sít’ Tlein) is a riot of color. Composed of coastal/aerosol, near infrared, and shortwave infrared bands from Landsat 9, the colors highlight features otherwise hard to identify. Watery features appear in reds, oranges, and yellows; vegetation is green and rock appears in blue. The glacier covers more than 4000 square kilometers, an area larger than the state of Rhode Island. The dark lines atop the glacier are moraines, where rock, soil, and other debris has been scraped up along the glacier’s edge. Over time, changes in the glacier’s velocity cause the moraines to fold and shear, creating the zigzag pattern seen here. (Image credit: W. Liang; via NASA Earth Observatory)

  • Melting Ice Cap

    Melting Ice Cap

    This award-winning photo by Thomas Vijayan shows waterfalls of ice melt off the Austfonna ice cap. The third-largest glacier in Europe, Austfonna is located in Norway’s Svalbard archipelago. Like other glaciers, it sees rising temperatures and increased melting due to climate change. Vijayan highlights that melting with his focus on the many waterfalls slicing through the ice. All that meltwater contributes to changes in local salinity as well as rising sea levels worldwide. (Image credit: T. Vijayan; via Nature TTL POTY)

  • Icelandic Glacial Caves

    Icelandic Glacial Caves

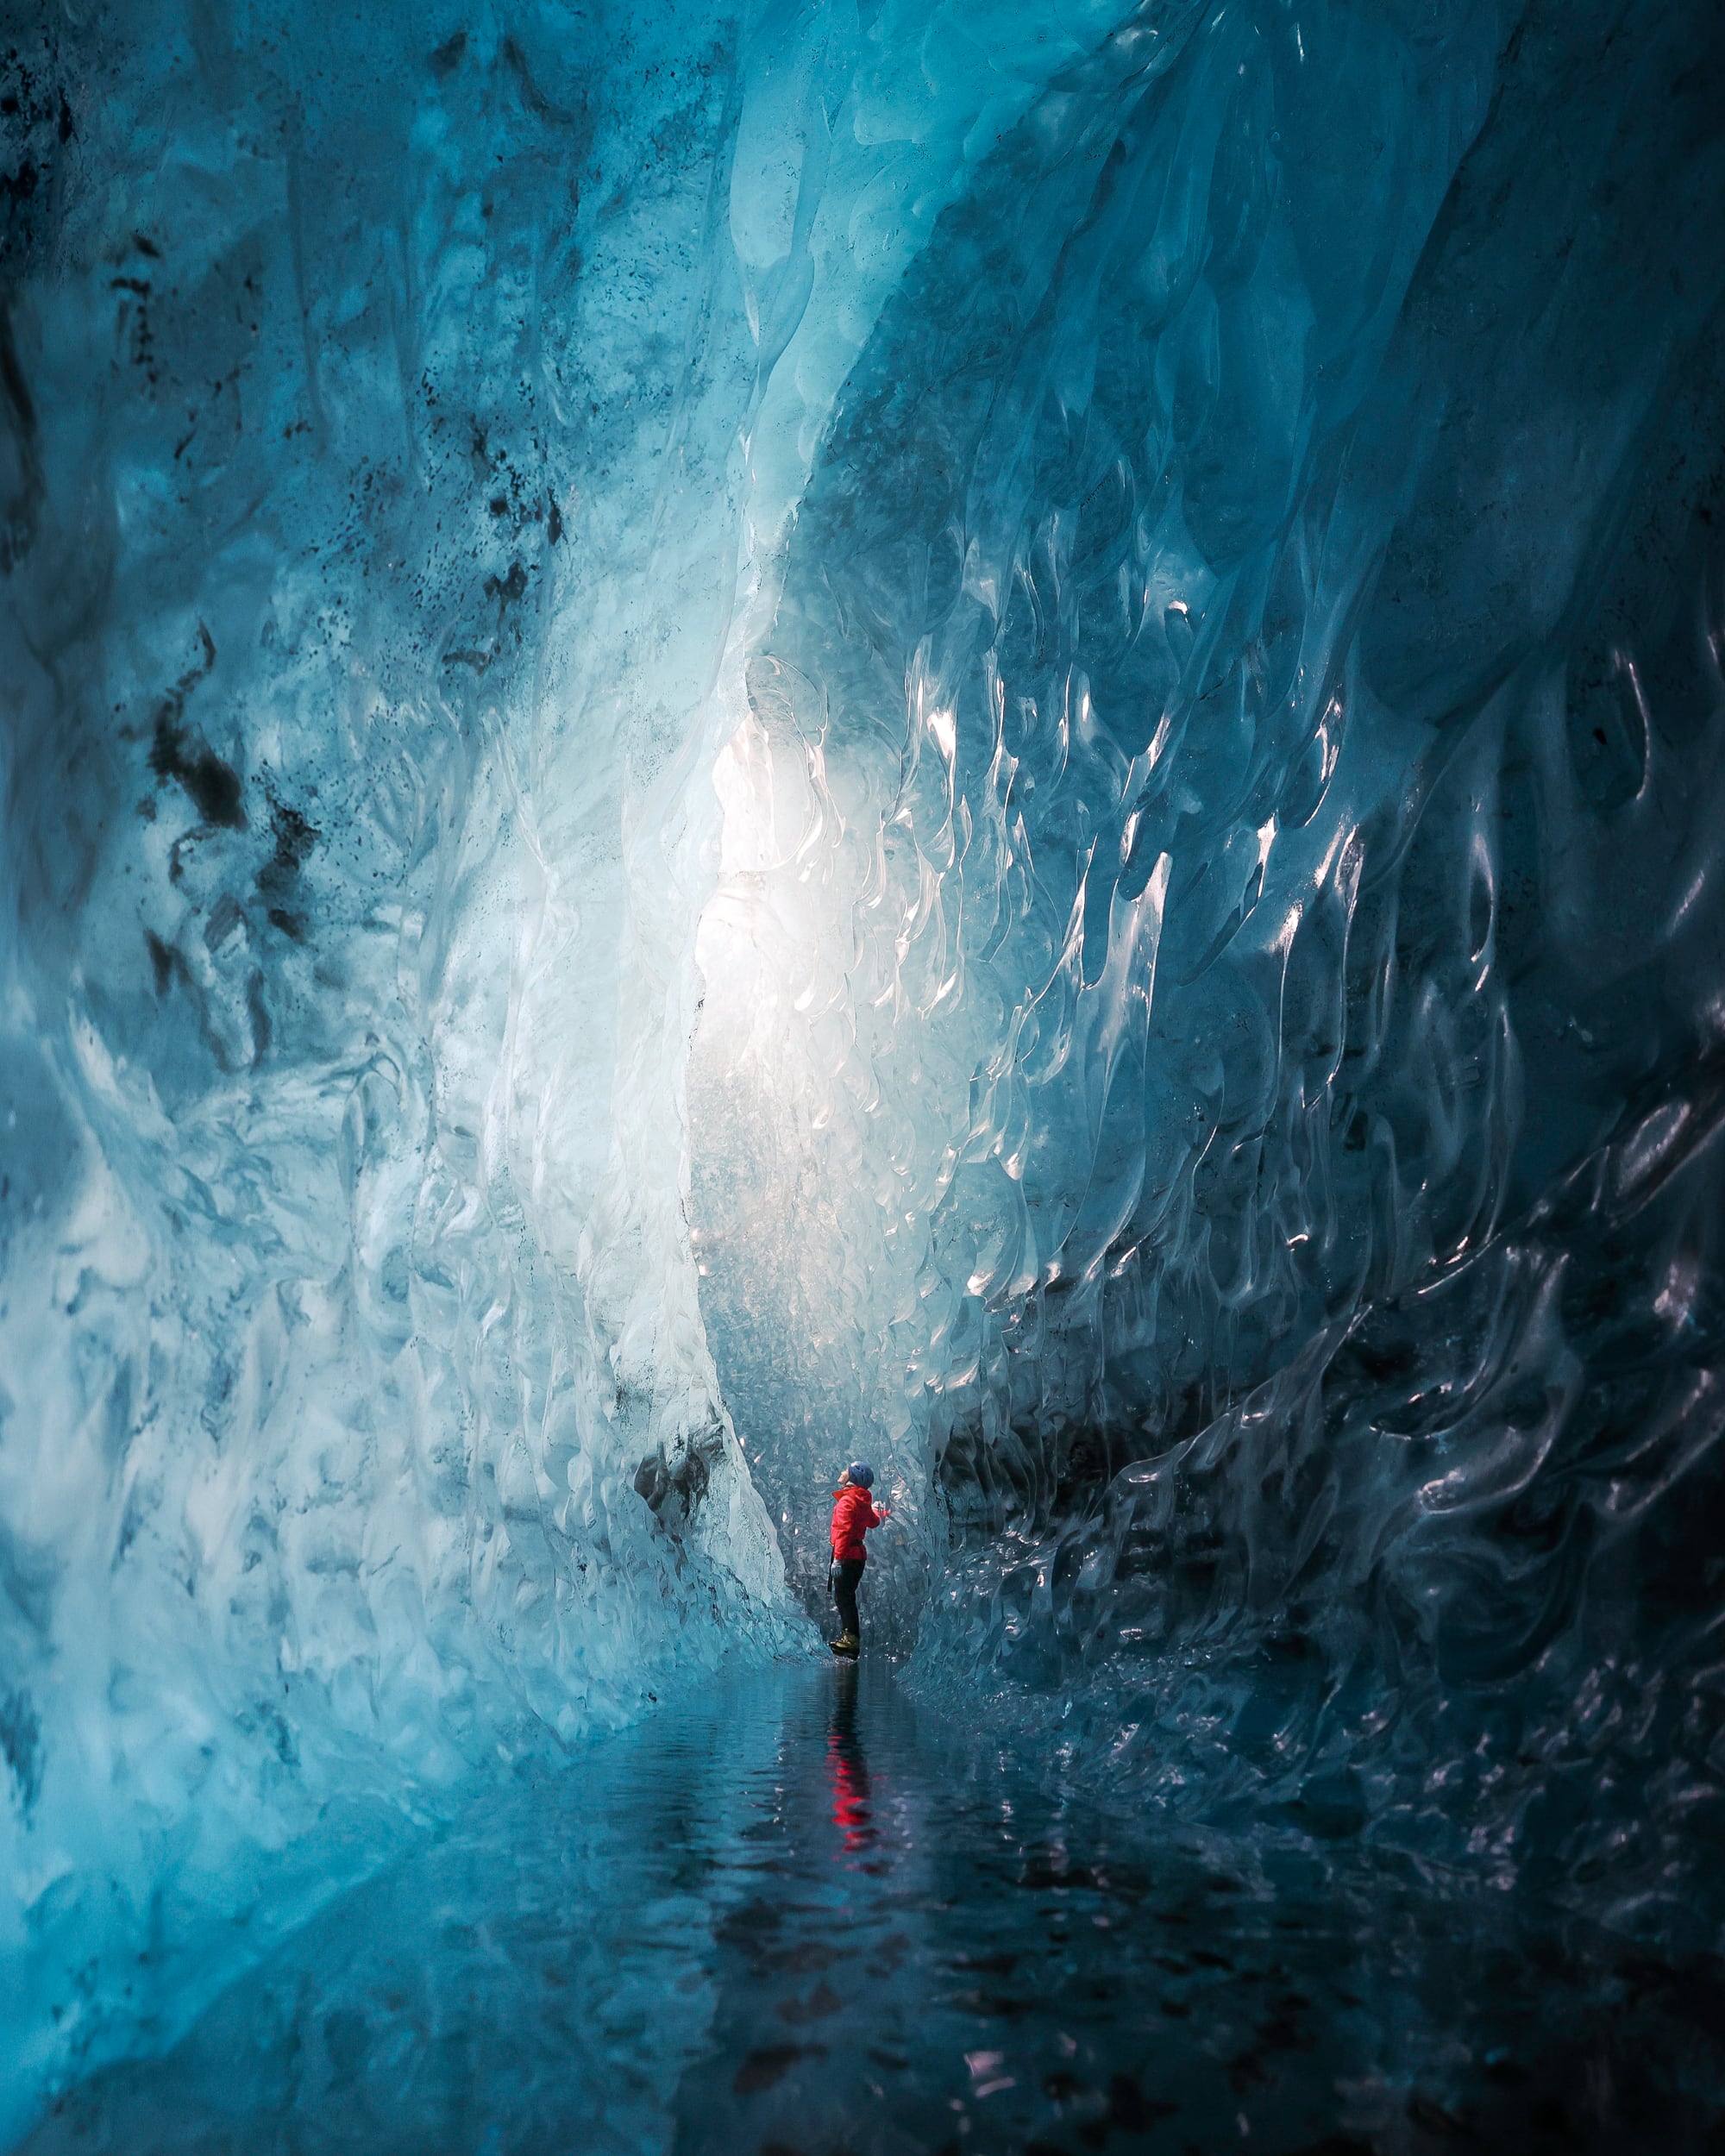
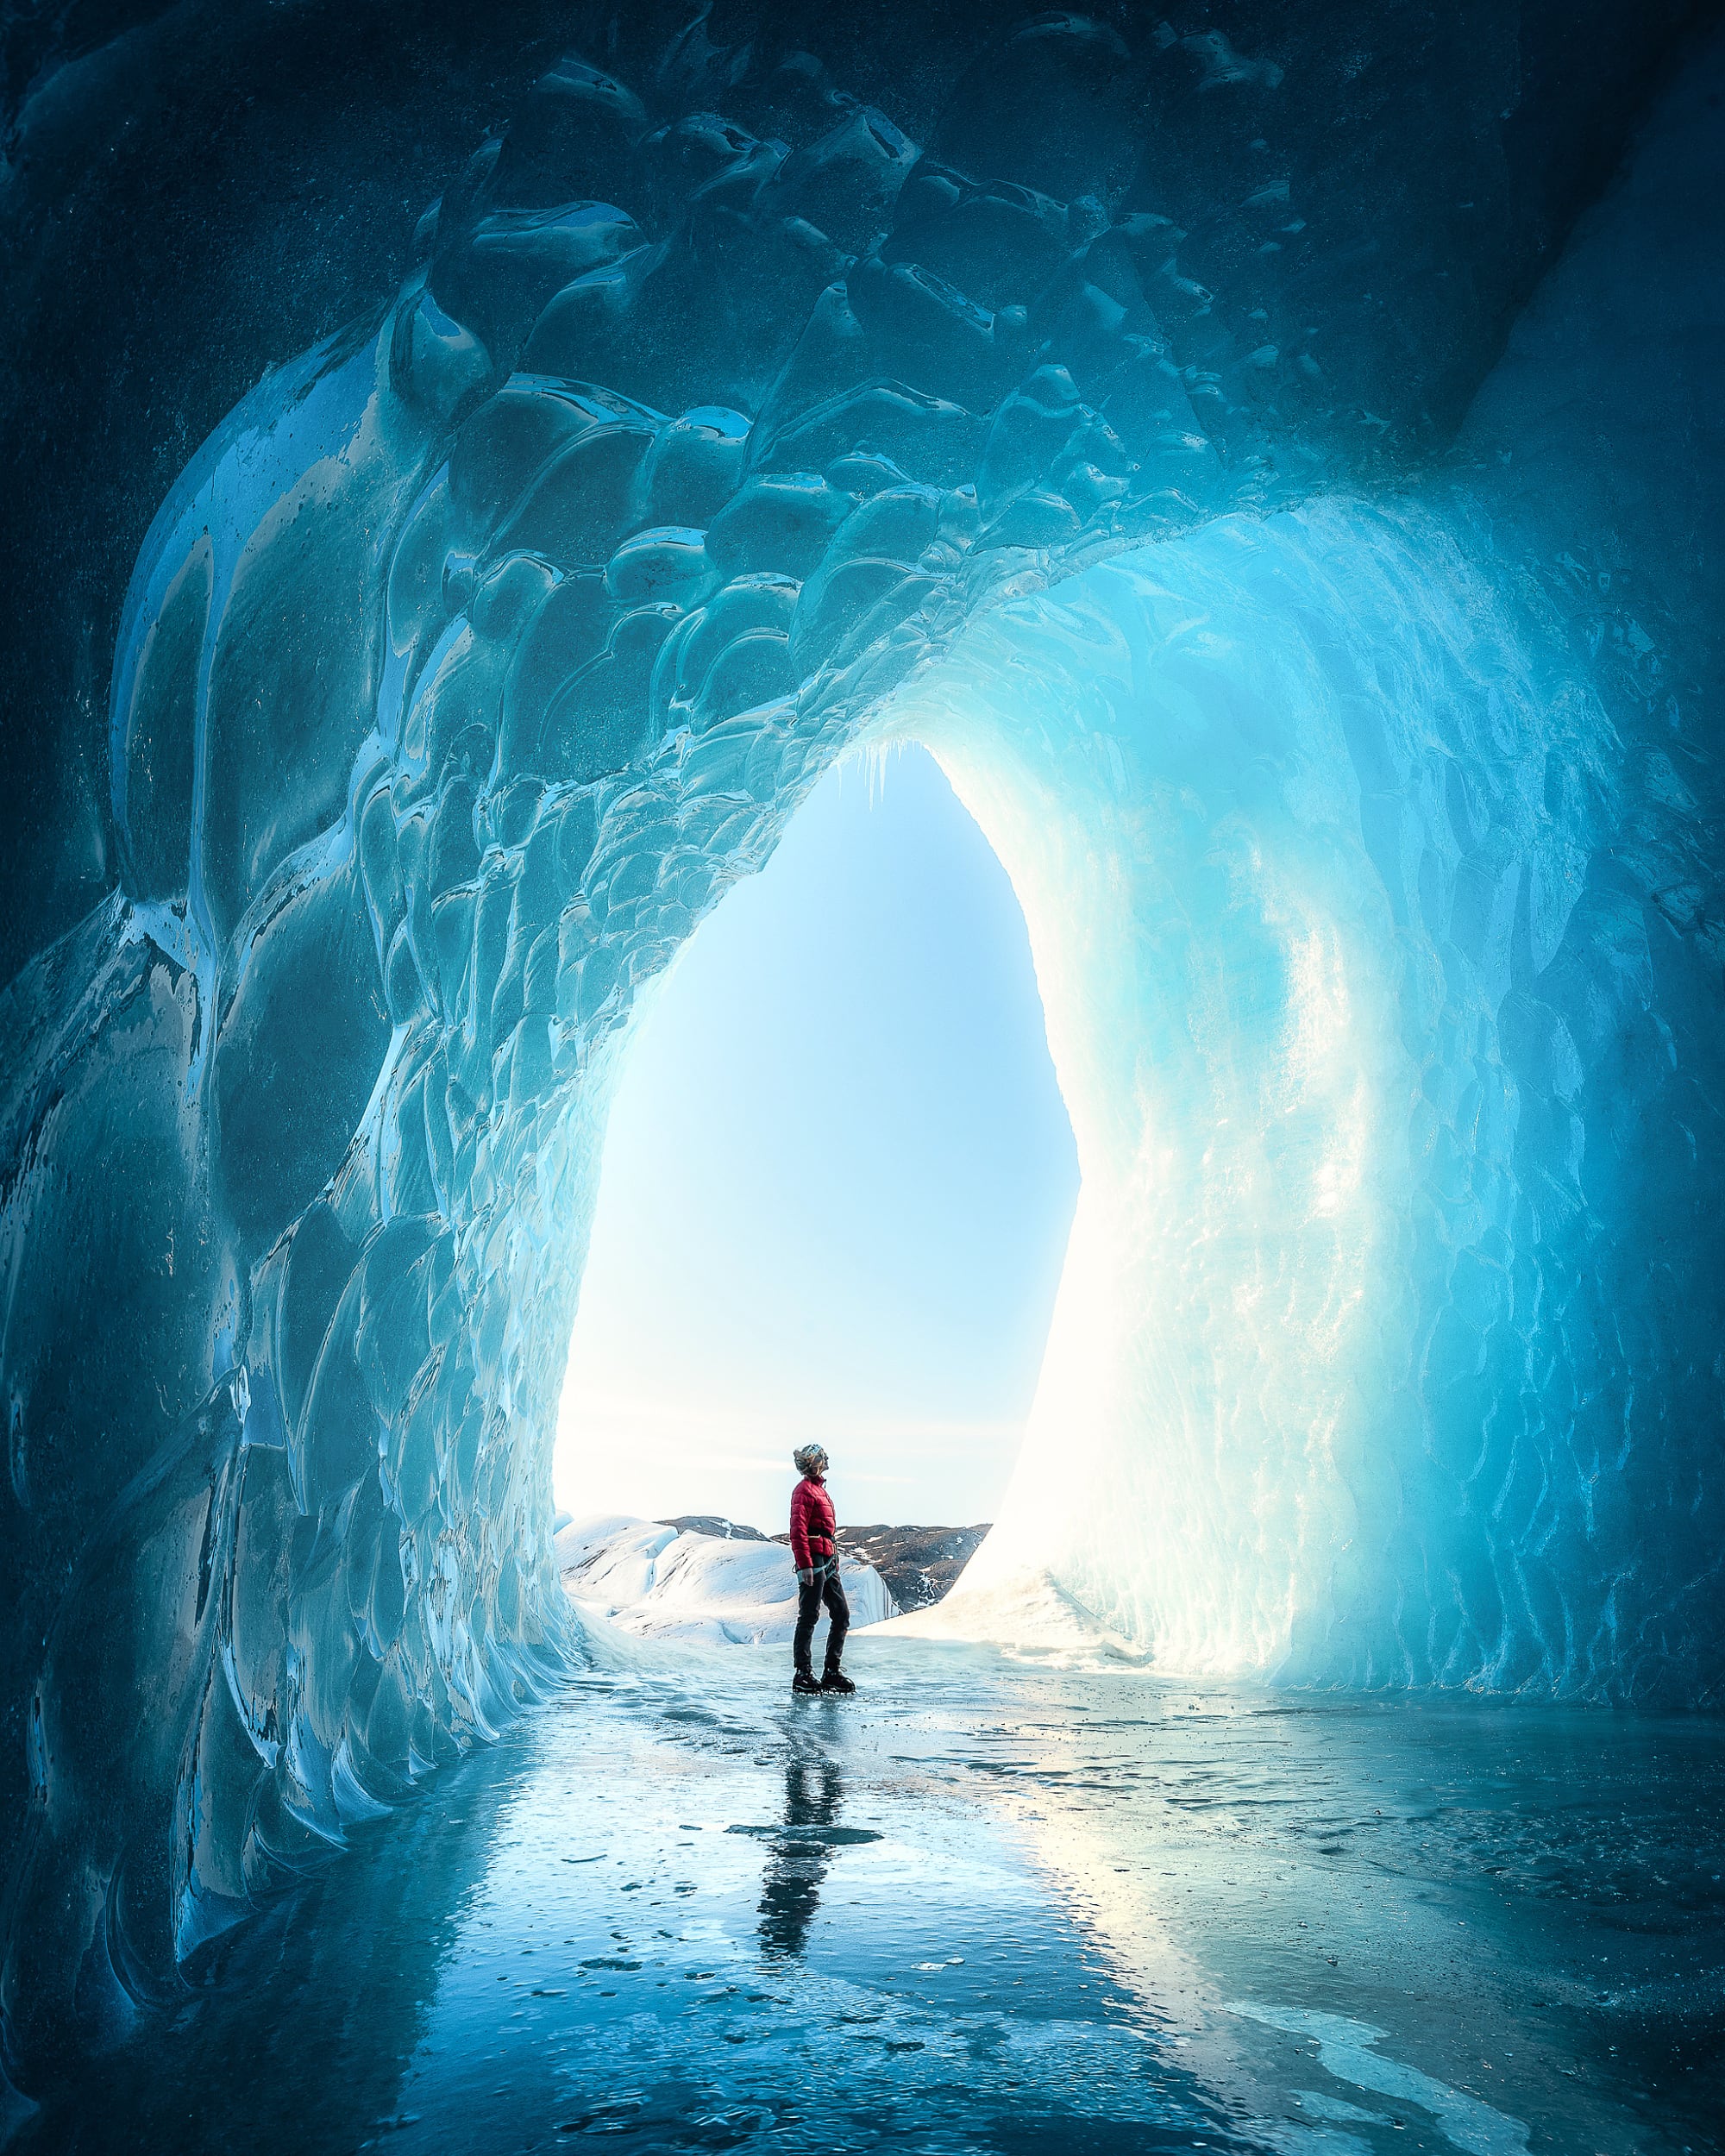
    Expedition guide and photographer Ryan Newburn captures the ephemeral beauty of the glacial caves he explores in Iceland. These caves are in constant flux, thanks to the run and melt of water. The scalloped walls are a sign of this process of melting and dissolution. The icicles, too, hint at ongoing melting and refreezing. Caves can appear and disappear rapidly; they’re a dangerous environ, but Newburn freezes them in time, letting the rest of us experience a piece of their majesty. See more of his images on his Instagram. (Image credit: R. Newburn; via Colossal)

  • Summer Melt

    Summer Melt

    A warm summer in 2022 has resulted in record melting on Svalbard. Located halfway between the Norwegian mainland and the North Pole, more than half of Svalbard is normally covered in ice. But with glaciers in retreat and firn — a surface layer of compressed porous snow — melting, pale blue ice is getting direct exposure to the sun and warm air temperatures. The result has been melting 3.5 times larger than the average melt between 1981 and 2010. Look closely and you’ll find deep blue meltwater ponds dotting the ice, too. The run-off of meltwater has likely carried extra sediment into the surrounding waters, accounting for some of the paler water colors along the coast. (Image credit: J. Stevens/USGS; via NASA Earth Observatory)