
In this video, schlieren imaging is used to make visible the flow field around a mussel. Mussels are filter-feeders, drawing nearby water in to obtain their food and expelling the unneeded fluid once they’ve gathered the plankton they eat. Normally this process is invisible to the naked eye, but schlieren imaging reveals changes in density (and thus refractive index) that make it possible to visualize the outflow from the mussel. The technique is also commonly used in supersonic flows to reveal shock waves. (Video credit: Stephen Allen)
Tag: flow visualization

How Maple Seeds Fly
Maple tree seeds flutter and spin as they descend. The above video, which shows flow visualization of a freely falling seed, demonstrates that the so-called helicopter seed’s autorotation creates a vortex along the leading edge. Watch as the seed’s “wing” sweeps through and you will notice the vortex along the upper surface. This leading edge vortex generates high lift on the maple seed, allowing it to stay in the air more effectively than other seeds, thereby increasing the maple’s reproductive range. (Video credit: D. Lentink et al.; see also Supplemental Materials)
Inky Vortex
Ink released into water shows the swirling motion inside a vortex ring as well as its deformation and breakup upon stagnation against a wall. Although humans are known to make such vortex rings with smoke or bubbles, they are common in nature as well. Buoyant plumes often feature vortex rings at their head; dolphins and whales play with bubble rings; volcanoes blow smoke rings; and mosses use them to distribute spores.

F-18 Flow Viz
")


Water tunnels are useful tools for determining aerodynamic characteristics of aircraft, such as this F-18 model placed in the NASA Dryden Flow Visualization Facility. By matching the Reynolds number of the model in the water tunnel to that of the full-scale aircraft in air, engineers can observe flow around the aircraft inside the laboratory. This similarity of flows is a powerful design tool. Here dye introduced along the nose, wings, and fuselage traces streamlines around the F-18, revealing areas of turbulence at different flight conditions.

Winds Across the US
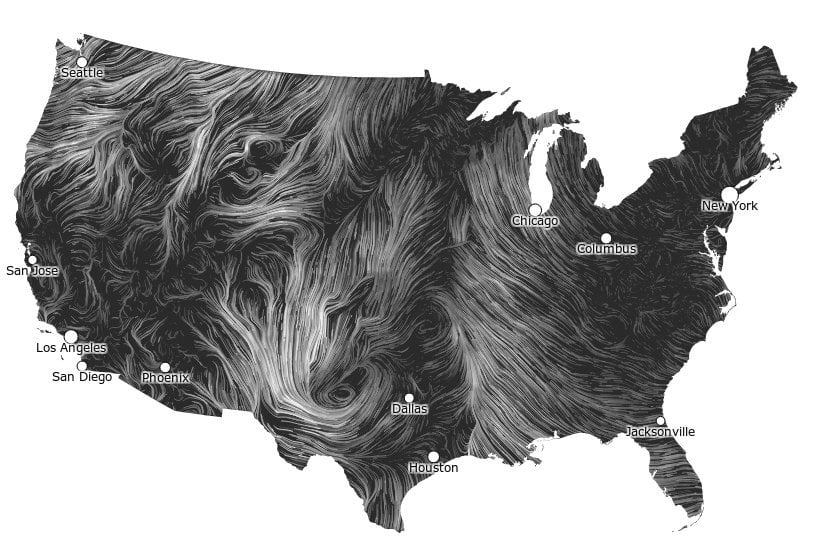
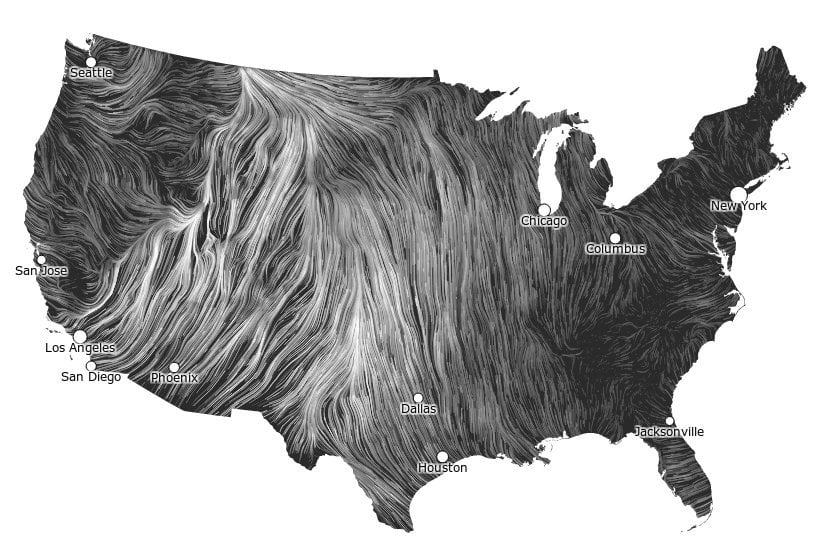
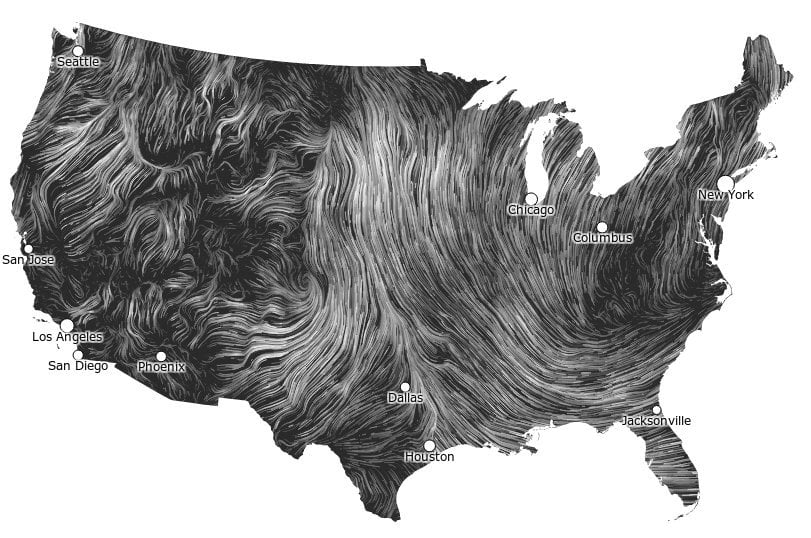
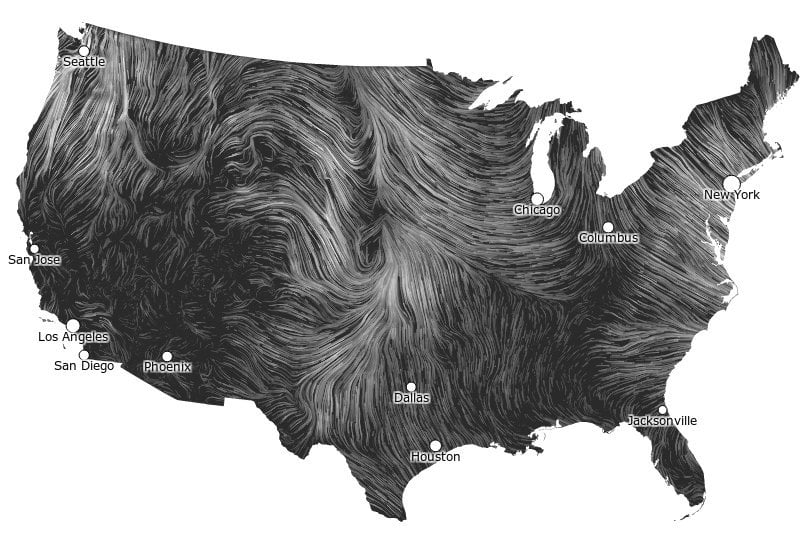
A collaborative project on data visualization brings to life the wind velocity data across the United States. The Wind Map is an interactive, nearly real-time indicator of wind conditions across the country, compiled on an hourly basis from the National Digital Forecast Database. Be sure to click through to see the data in motion. Observing the variety in wind patterns over the scale of days brings to light the swirling motion of surface winds much the way Perpetual Ocean does for surface currents. Fluid dynamics are all around us. (via Gizmodo)

Micro Air Vehicle Flow Viz
A smoke wire shows the deformation of streamlines around a swept-winged micro air vehicle (MAV). These crafts typically feature wingspans smaller than one foot and, thus, never develop the type of flow fields associated with larger fixed-wing airplanes. This complicates theoretical predictions of lift and drag for MAVs as well as making them difficult to control. MAVs have numerous commercial and military applications, including search and rescue operations. (Photo credit: Tom Omer)
Visualizing Ocean Currents
Researchers used computational models of ocean currents to produce this video visualizing worldwide ocean surface currents from June 2005 through December 2007. Dark patterns under the ocean are representative of ocean depths and have been exaggerated to 40x; land topography is exaggerated to 20x. Notice the wide variety of behaviors exhibited in the simulation: some regions experience strong recirculation and eddy production, while others remain relatively calm and unmoving. Occasionally strong currents sweep long lines across the open waters, carrying with them warmth and nutrients that encourage phytoplankton blooms and other forms of ocean life. (Video credit: NASA; submitted by Jason S)
Vortex Cannon
Building a vortex cannon is a great way to demonstrate the power and longevity of vortex rings. As demonstrated here, it’s possible to create one with just a box with a round hole in it. Adding some smoke or stage fog helps visualize the rings. Vortex rings are found frequently in nature: volcanoes make them, some plants use them to distribute spores, and dolphins and whales use them to play. (submitted by @aggieastronaut)
Flow in Urban Areas
While we typically think about boundary layers as a small region near the surface of an object–be it airplane, golf ball, or engine wall–boundary layers can be enormous, like the planetary boundary layer, the part of the atmosphere directly affected by the earth’s surface. Shown above is a flow visualization of the boundary layer in an urban area; note the models of buildings. In these atmospheric boundary layers, buildings, trees, and even mountains act like a random rough surface over which the air moves. This roughness drives the fluid to turbulent motion, clear here from the unsteadiness and intermittency of the boundary layer as well as the large variation in scale between the largest and smallest eddies and whorls. In the atmosphere, the difference in scale between the largest and smallest eddies can vary more than five orders of magnitude.

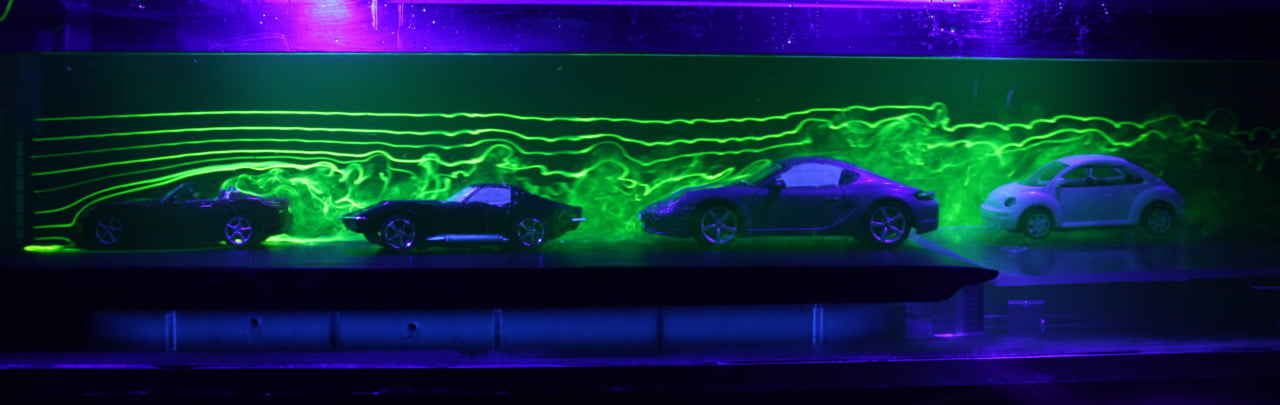
Flow Around Traffic
Flow visualization in a water tunnel shows what the flow around a line of traffic looks like. Note the progressively more turbulent flow around each car as it sits in the wake of the car before it. Turbulent flow is usually associated with increased drag forces, but because turbulence can actually help prevent flow separation it is sometimes desirable as a method for decreasing drag. In the case of these cars drafting on one another, it is clear that the cars further back in the line cause less effect on the fluid–and thus have less drag to overcome–than the front car. (Photo credit: Rob Bulmahn)
