Tag: flow visualization

  • Replacing Kalliroscope

    Replacing Kalliroscope

    Although you may not recognize the name, you’ve probably seen Kalliroscope (top image), a pearlescent fluid that creates beautiful flow patterns when swirled. This rheoscopic fluid was invented in the mid-1960s by artist Paul Matisse and, over the following decades, became a staple of flow visualization techniques. Kalliroscope contained a suspension of crystalline guanine. Since the crystals were asymmetric, they would orient themselves depending on the flow and, from there, scatter light, creating the beautiful pearlescent effect seen above.

    Unfortunately for researchers, the production of guanine crystals was expensive and difficult. The cosmetics industry was their main consumer and over time, they moved toward mica and other cheaper mineral alternatives. The company that produced Kalliroscope gave up production in 2014, leaving researchers scrambling for a suitable alternative.

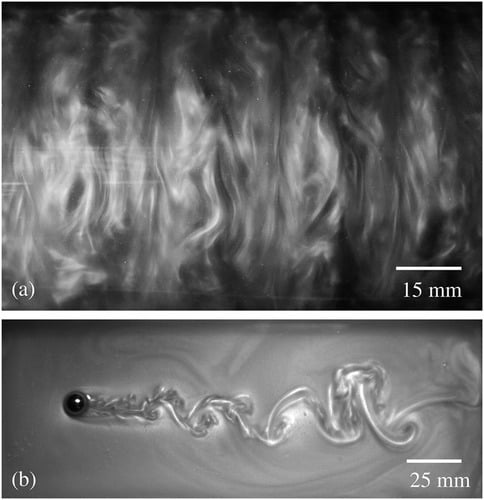
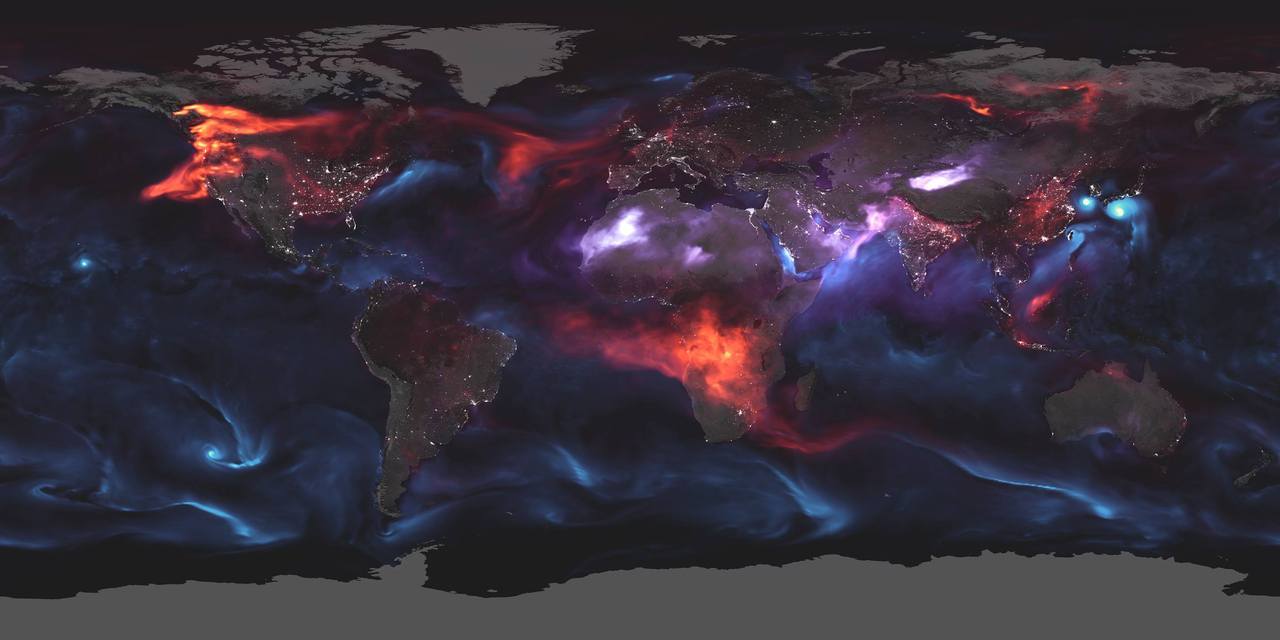
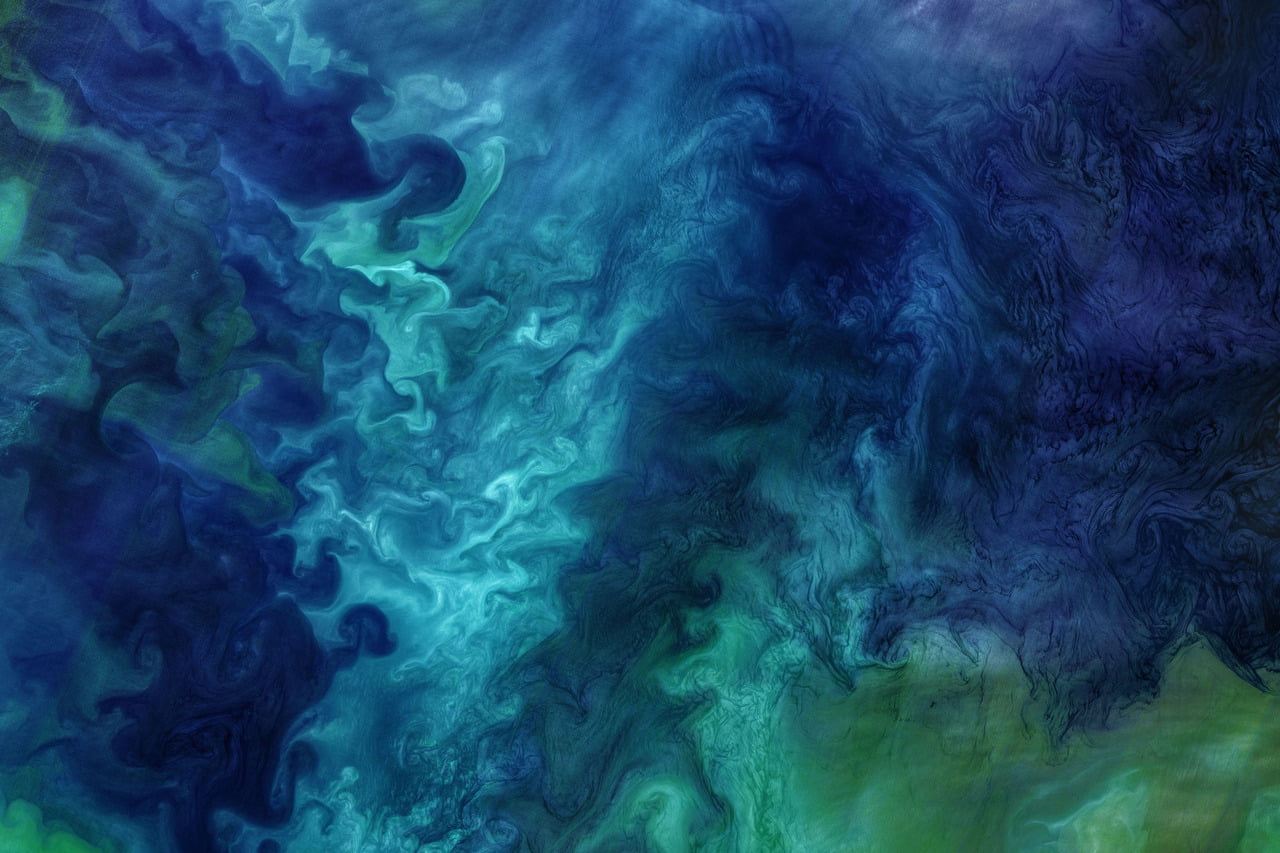
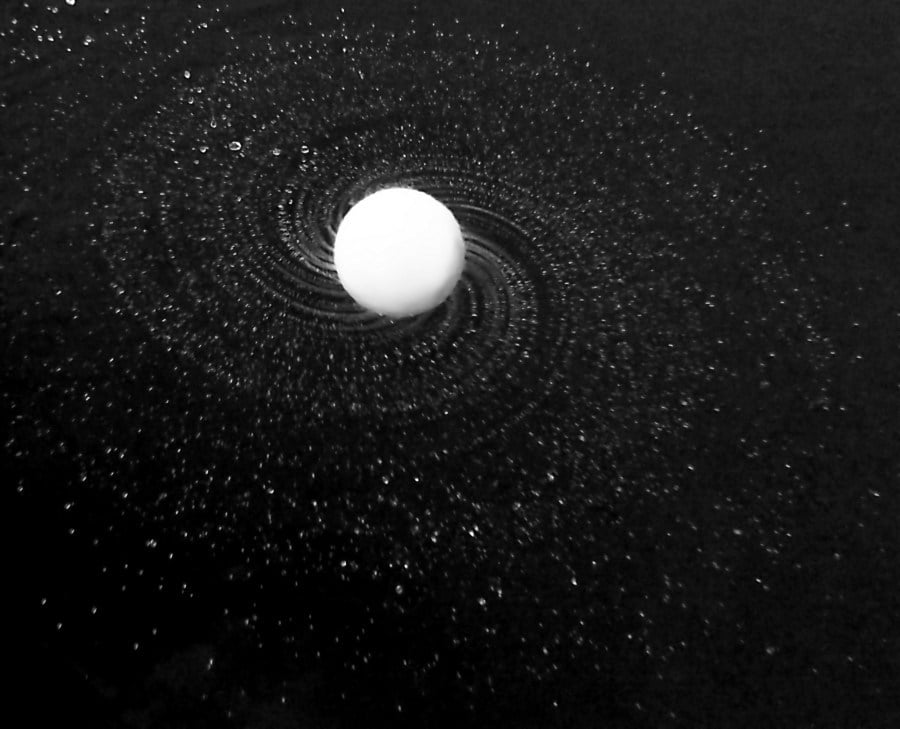
    One contender for a new standard rheoscopic fluid is based on shaving cream. By diluting shaving cream 20:1 with water, researchers are able to extract stearic acid crystals, which form an admirable alternative to Kalliroscope (middle collage). Like Kalliroscope, the resulting fluid is pearlescent and reveals flow features well (bottom two images). Stearic acid crystals are also closer in density to water than guanine, so the fluid remains in suspension far better than Kalliroscope. Plus, the best shaving cream is cheap and widely available, meaning that this is a DIY project just about anyone can do! (Image credits: Kalliroscope – P. Matisse; other images – D. Borrero-Echeverry et al.; research credit: D. Borrero-Echeverry et al.)

  • The Challenges of Blowing Bubbles

    The Challenges of Blowing Bubbles

    Although every child has experience blowing soap bubbles with a wand, only in recent years have scientists dedicated study to this problem. It turns out to be a remarkably complex one, with subtleties that can depend on the size of the wand relative to the jet a bubble-blower makes as well as the speed at which the air impacts the film. A recent study found that, at low or
    moderate speeds, the film takes on a stable, curved shape (top image), but once you increase to a critical speed, the film will overinflate and burst. The key to forming a bubble, the authors suggest, is hitting that critical speed only briefly; if you slow down before the film ruptures, then the bubble has a chance to disconnect and form a sphere without breaking. 

    The work also suggests there are two reliable methods for bubble making in this way. One is to impulsively move the wand through the background fluid, as shown in the lower animation. The other is the one familiar to children: blow a jet just fast enough to overinflate the film, then let up so the bubble forms without breaking. (Image and research credit: L. Ganedi et al.; via Ars Technica; submitted by Kam-Yung Soh)

  • Visualizing Aerosols

    Visualizing Aerosols

    Aerosols, micron-sized particles suspended in the atmosphere, impact our weather and air quality. This visualization shows several varieties of aerosol as measured August 23rd, 2018 by satellite. The blue streaks are sea salt suspended in the air; the brightest highlights show three tropical cyclones in the Pacific. Purple marks dust. Strong winds across the Sahara Desert send large plumes of dust wafting eastward. Finally, the red areas show black carbon emissions. Raging wildfires across western North America are releasing large amounts of carbon, but vehicle and factory emissions are also significant sources. (Image credit: NASA; via Katherine G.)

  • Swirling Blooms

    Swirling Blooms

    Every summer, as the ice melts, the waters of the Chukchi Sea off the Alaskan coast come alive with phytoplankton blooms. In satellite images like this one, they can look like abstract paintings formed from swirling colors. In the Chukchi Sea, two main currents collide. One, water from the Bering Sea, is cold, salty, and nutrient-rich. This is the preferred home to phytoplankton known as diatoms, which are responsible for some of the greenish hues seen here.

    Coccolithophores, another variety of phytoplankton, prefer the warmer, less salty Alaskan coastal waters. Despite a relative lack of nutrients, the  coccolithophores thrive, creating the milky turquoise color seen in the image. Knowing these characteristics of the phytoplankton, observing the growth of blooms over time may tell scientists about how the flows in these areas shift and change from year to year. (Image credit: NASA; via NASA Earth Observatory)

  • Spinning Droplet Galaxies

    Spinning Droplet Galaxies

    Water flung from a spinning tennis ball takes on a shape reminiscent of a spiral galaxy. As it detaches, water leaves the surface with both the tangential velocity of the spinning ball and a radial velocity due to the centrifugal force flinging it. The continued spin of the ball makes the thin ligaments of water still attached to it spiral and stretch. Eventually, surface tension can no longer hold the water together against the centrifugal forces, and the ligaments split into a spray of droplets. (Image credit: W. Derryberry and K. Tierney)

  • Featured Video Play Icon

    Vortex Ring Collisions

    One of the most enduringly popular submissions I receive is T. Lim’s experimental footage of two vortex rings colliding head-on. It’s an devilishly tough experimental set-up to master because perfectly aligning the rings is incredibly difficult. The pay-off, however, is huge because the breakdown of the colliding rings and their transformation into secondary rings is breathtaking. Destin at Smarter Every Day and his team have worked hard to recreate the experiment (top video), but they’re not the only ones – nor are they the first in decades – to do so.

    Ryan McKeown and a team at Harvard have a set-up of their own for vortex ring collisions, and you can see a little of it in action in the middle video. Ryan’s set-up is, frankly, incredible. It scans a light sheet through the vortex rings at high-speed, allowing him to capture the collision and break-up in minute detail in both space and time. What you see in the latter half of his video is a digital reconstruction of that data – not a simulation but real data! His work is capturing vortex collisions in unprecedented detail, allowing researchers to probe the smallest scales of the phenomenon.

    When two vortex rings approach one another, they can undergo what’s known as a vortex reconnection event. Bubbles rings are a great place to see this. The vortex cores get distorted when they’re close to one another due to the influence of the other vortex ring’s velocity field. This often stretches and flattens the vortex core. It’s impossible for the rings to simply break apart, though, (per Helmholtz’s second theorem). So when the original vortex rings thin to the point of breaking, they immediately reconnect to a piece of the other ring, creating a series of small vortex rings around the remains of the originals. The exact details of how this works are what investigators like Ryan and his colleagues are trying to understand. You can hear a little more about their work in my interview with Ryan in the bottom video, starting at ~2.54. (Video credits: Smarter Every Day, R. McKeown et al., and N. Sharp and T. Crawford; submission credit: a huge number of readers)

  • Visualizing Turbulence

    Visualizing Turbulence

    Turbulence, the seemingly random and chaotic state that fluids often tend toward, can be difficult to wrap one’s head around. Turn your faucet on high or pour milk into your coffee, and the flow just looks like a completely unpredictable mess. But there are important patterns to be found.These flows have many different lengthscales and timescales to them. Think of a cloud. There are very large-scale motions that are close to the size of the entire cloud, but there are also very small ones that may be only a centimeter or so in size. 

    Our best understanding of turbulence so far says that energy starts out in these large scales and slowly works its way down to the smaller ones, where viscosity (essentially friction, in this case) can transform that motion into heat. Above you see a creative way to display this fact. Using data from a numerical simulation, the authors transformed velocity information into these mandala-like patterns. The center of the image represents the large lengthscales, where energy is added. Moving around the circle, like a clock’s hand does, shows different positions in space. Moving radially from the center outward takes you through different lengthscales from large to small. 

    Notice how the large lengthscales break into smaller and smaller ones as you move outward. The pattern looks like a set of fractal pitchforks, with each lengthscale fracturing into smaller and smaller ones as the turbulence breaks down further. There’s lots more to see in the original poster, below, but you should really click here for the glorious full-size original. The poem, by the way, is the work of physicist Lewis Richardson, who wrote it to summarize how turbulence works. (Image credit: M. Bassenne et al.)

    image
  • Star Wars Aerodynamics

    Star Wars Aerodynamics

    Science fiction is not always known for hewing to scientific fact, so it will probably come as little surprise that Star Wars’ ships have terrible aerodynamics. But it’s nevertheless fun to see EC Henry’s analysis of drag coefficients of various Rebel and Imperial ships and just how poorly they fare against our own designs.

    Drag coefficients really only give a tiny piece of the story, though. We don’t know what speed Henry is testing the ships at, and we get no information about properties like lift or lift-to-drag ratio, which can be even more important than just the drag when it comes to evaluating an aircraft.

    There are some intriguing hints about other aerodynamic properties in the clips of flow around an X-wing and TIE fighter, though. Notice that the wake of both ships meanders back and forth. This is an indication of vortex shedding, and it means that both spacecraft would tend to be buffeted from side-to-side when flying in an atmosphere. Either the ships would need some kind of active control to counter those forces, or pilots would need iron constitutions to operate under those conditions! (Video and image credit: EC Henry)

    [original video no longer available]

  • Featured Video Play Icon

    360 Fireball

    Flames are inherently fascinating to watch. Most of the ones we see regularly, like candle flames and campfires, tend to flicker unsteadily due to their turbulence. But larger fires have a spell-binding nature all their own, one that’s highlighted in slow motion. Here the Slow Mo Guys take flame-gazing to a new level by circling a fireball with a high-speed camera. In the resulting footage, you can admire the incredible expansion of the flame front, and the beautiful, detailed turbulence that creates all the myriad tiny eddies you see in the slow motion. It’s well worth watching more than once! (Video and image credit: The Slow Mo Guys)

  • Collecting Fog

    Collecting Fog

    In some parts of the world, fog is a major source of freshwater, but collecting it is a challenge. Most systems use a wire mesh to capture and collect droplets, but the process is highly inefficient, pulling only 1-3% of droplets from the fog. Researchers found that this is due largely to aerodynamic effects. The presence of the wire deflects droplets around it (bottom left). To solve this, engineers introduced an electric charge into the fog. The subsequent electric field actually pulls droplets to the wires (bottom right). When applied to a mesh (top), the efficiency of fog capture improves dramatically. 

    The technique can also be used to capture water vapor that would otherwise escape from the cooling towers of power plants. The MIT researchers who developed the technique will conduct a full-scale test at the university’s power plant this fall. They hope the technique will recapture millions of gallons of water that would otherwise drift away from the plant. (Image credits: MIT News, source; image and research credits: M. Damak and K. Varanasi, source)