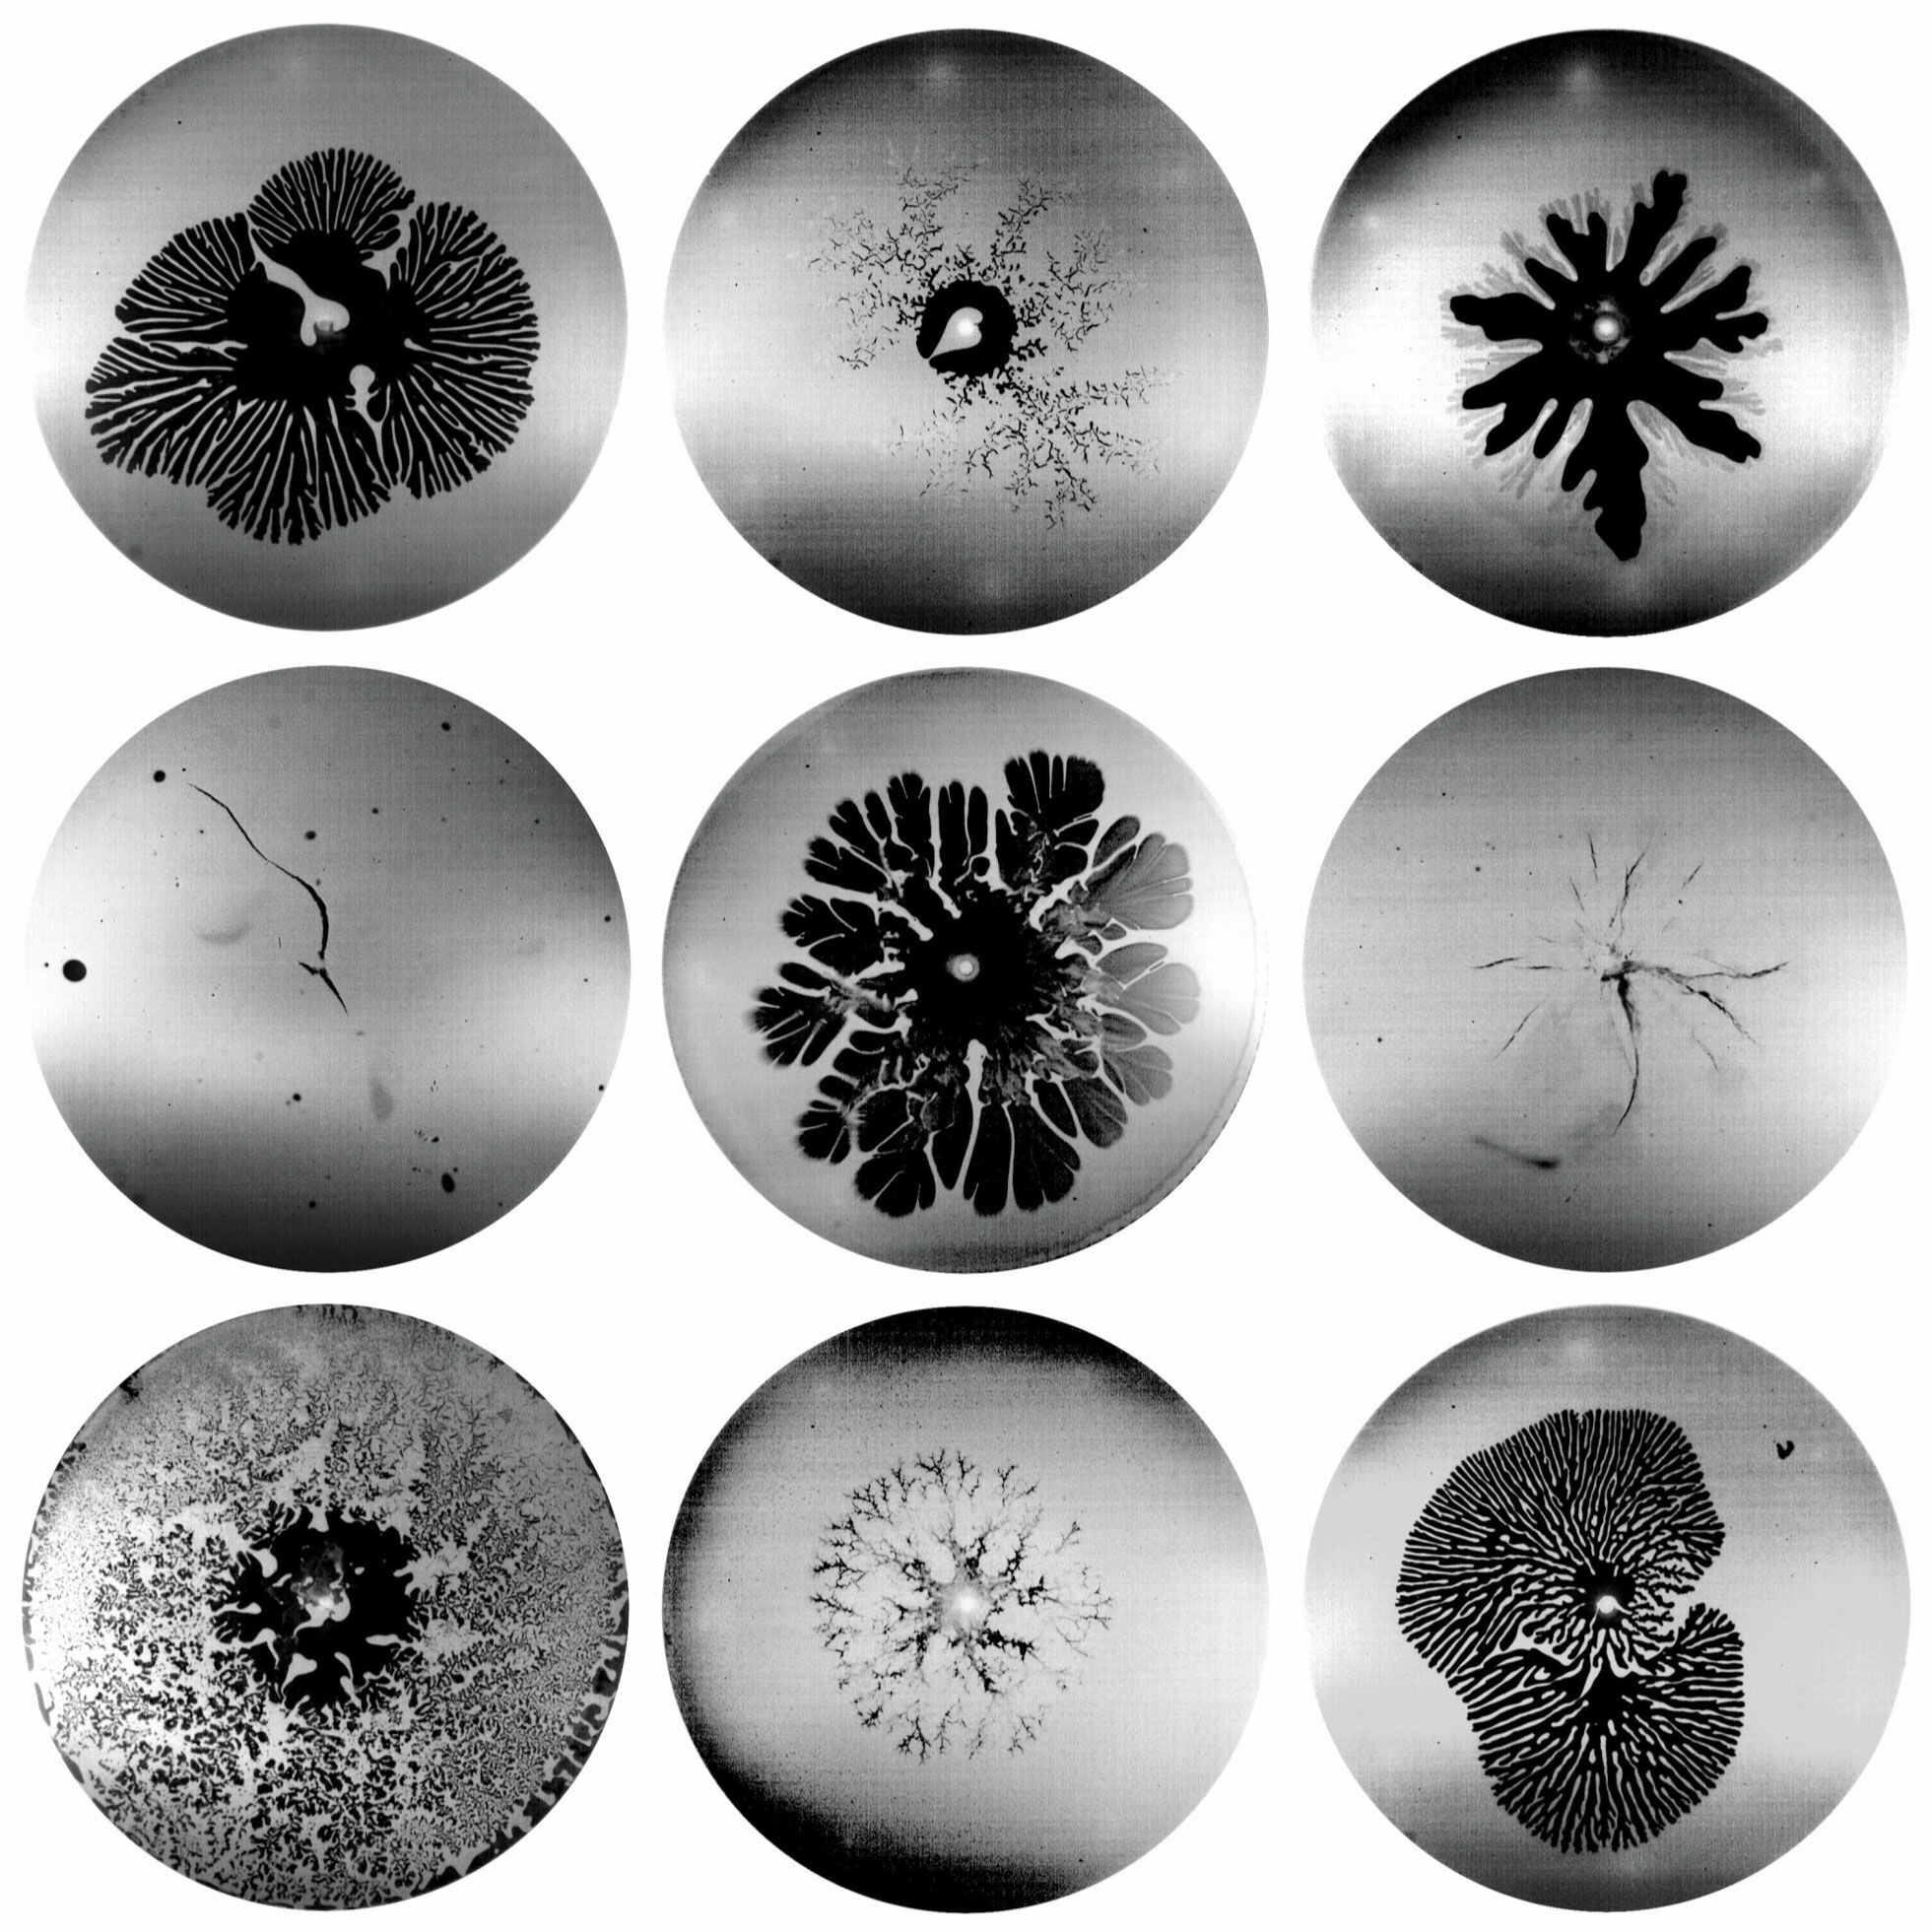
Tag: flow visualization

  • Solid, Liquid, Both?

    Solid, Liquid, Both?

    Materials like oobleck — a suspension of cornstarch particles in water — are tough to classify. In some circumstances, they behave like a fluid, but in others, they act like a solid. Here researchers sandwiched a thin layer of oobleck between glass plates and injected air into the mixture. For a fluid, this setup creates a classic Saffman-Taylor instability where rounded fingers of air push their way into the more viscous fluid. And, indeed, for low air pressures and low concentrations of cornstarch, the oobleck forms these viscous fingers. You can see examples in the top row’s first and third image, the second row’s middle image, and the bottom row’s third image.

    Injecting air at high pressures and high cornstarch concentrations fractures the oobleck like a solid (middle row, first and third images). At intermediate pressures and concentrations, the oobleck forms a pattern called dendritic fracturing, where new branches can grow perpendicularly to their parent branch. Examples of this pattern are in the top row’s second image and the bottom row’s first and second images. (Image and research credit: D. Ozturk et al.; via Physics Today)

  • Featured Video Play Icon

    RC Ground Effect Plane

    The ekranoplan was a massive, Soviet-era aircraft that relied on ground effect to stay aloft. In this video, RC pilots test out their own homemade version of the craft, including some neat flow visualization of the wingtip vortices. When an aircraft (or, for that matter, a bird) flies near the ground, it experiences less drag than at higher altitudes. This happens primarily because of the ground’s effect on wingtip vortices.

    In normal flight, the vortices from an aircraft’s wingtips create a downwash that reduces the wing’s overall lift. But in ground effect, the vortices cannot drift downward as they normally do. Instead, they spread apart from one another, thereby reducing the drag caused by downwash from the aircraft. The end result is better performance, though it comes with added risk since there’s very little time to correct an error when flying at an altitude less than half the aircraft’s wingspan. (Video and image credit: rctestflight; submitted by Simplicator)

  • Featured Video Play Icon

    The Noisy Gluggle Jug

    The fish-shaped Gluggle Jug makes an impressive set of sounds when tilted for pouring. Steve Mould explores their origin in this video. When liquid is poured from a container, air needs a path in to replace the poured liquid. You’re likely most familiar with this from long-necked bottles, where trying to pour the liquid too quickly results in a glug-glug noise as air bubbles periodically force their way through the bottle neck. The same thing happens in the Gluggle Jug, particularly at the joint between the tail and body of the pitcher. The volume and resonance of the jug’s sounds comes from the shape; the open mouth of the container amplifies the sound of bubbles popping back from the tail region. (Image and video credit: S. Mould)

  • Featured Video Play Icon

    Really, Really Slow Mo Fluids

    Fluid dynamics is a perfect subject for high-speed video. So much goes on at speeds that are far too quick for our eyes and brains to perceive. But there is such a thing as too slow – a concept explored in this Slow Mo Guys video, which takes everyday activities like turning on a faucet or splashing into a pool and slows them down a speed where one second lasts an hour. The video I’ve embedded here isn’t nearly that long; it speeds up and slows down. But if you really want to, you can watch Gav fall into a pool for a full hour. (Image and video credit: The Slow Mo Guys)

  • Featured Video Play Icon

    “Feeding the Sea”

    It’s impressive when a microscopic organism is visible from space, but that’s a regular occurrence for phytoplankton, the tiny marine algae that feed much of the ocean. In this video from NASA Earth Observatory, we travel around the globe, observing phytoplankton blooms and learning about the ecosystems they feed — or destroy.

    Note that many of these satellite images have been color-enhanced to bring out the swirls and eddies of each bloom. The colors are enhanced but the patterns are real. (Image and video credit: NASA Earth Observatory)

  • Microjets and Needle-Free Injection

    Microjets and Needle-Free Injection

    Some people don’t mind needles, and others absolutely detest them. But to replace needles with needle-free injections, we have to understand how high-speed microjets pass through skin. Given skin’s opacity, that’s tough, so researchers are instead using droplets as a model. If we can understand the dynamics of a microjet passing through different kinds of droplets, getting jets of medicine into arms becomes easier.

    Researchers found that jets passed completely through a droplet if they impacted above a critical velocity. For Newtonian droplets, the jet creates a cavity and shoots straight through because the inertia of the impact outweighs the countering force of surface tension. But with viscoelastic drops, the jet goes through, slows down, and gets sucked back into the droplet. In this case, the combination of surface tension and viscoelasticity can, eventually, overpower the jet’s inertia. (Image, research, and submission credit: M. Quetzeri-Santiago et al.)

  • Jupiter in Many Lights

    Jupiter in Many Lights

    Sometimes the key to unraveling a mystery is to observe the phenomenon in different ways. That’s why researchers are increasingly taking advantage of multiple instruments simultaneously observing targets like Jupiter. Here we see the gas giant in three different types of light: infrared, visible, and ultraviolet. Infrared bands reveal the hot and cold regions of Jupiter’s clouds, allowing scientists to identify convective areas. Ultraviolet observations can reveal high-energy processes, like Jupiter’s auroras. And the colors revealed in visible light can give hints about chemical make-up in different regions. But to get a fuller picture, scientists compare all three modes — along with radio signal data from Juno — to understand topics like the planet’s lightning-filled storms. (Image credits: International Gemini Observatory/NOIRLab/NSF/AURA/NASA/ESA, M.H. Wong and I. de Pater (UC Berkeley) et al.; via Gizmodo)

  • Featured Video Play Icon

    “Stream”

    Roman De Giuli’s short film “Stream” explores a macro world of color and flow, with a few glimpses behind-the-scenes at how the visuals get made. The artistic canvas here is a glass plate; the materials are oil, ink, and water. As simple as the ingredients are, though, the view is complex and enchanting. It’s amazing to see just how much goes on in an area the size of one’s thumb. (Image and video credit: R. De Giuli)

  • Light Painting

    Light Painting

    Light streams from the branches of trees in this series from photographer Vitor Schietti. The effect is created with a combination of fireworks, long-exposure photography, and compositing. I love how the falling sparks create streaklines just like so many flow visualization diagnostics do! Follow more of Schietti’s work on Instagram. (Image credit: V. Schietti; via Colossal)

  • Featured Video Play Icon

    Metallic Magma

    Metallic paint flows like silver lava in this macro video from Chemical Bouillon. The paint has been mixed with an unknown fluid (my guess is alcohol) to produce the flows we see here. My suspicion is that we’re seeing solutal convection where variations in surface tension create convective flow within the liquid. What do you think? (Video and image credit: Chemical Bouillon)