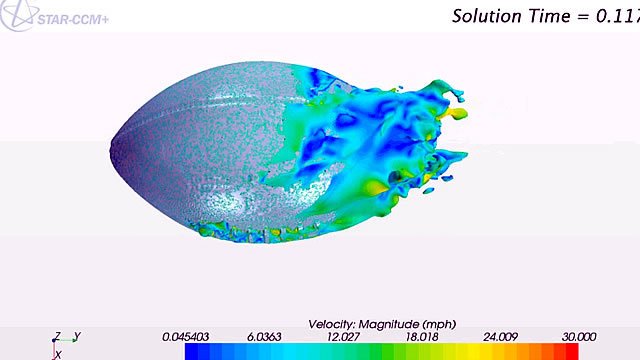
Tag: CFD

  • 3D Printing Fluids

    3D Printing Fluids

    Most flows vary in three spatial dimensions and time. In experimental fluid dynamics, the challenge is measuring as much of this information as possible. For those who use computational fluid dynamics to study flows, their simulations provide massive amounts of data and the challenge comes in visualizing and processing that data in a useful way. Unless you can find and analyze the important aspects of the simulation results, they’re just a bunch of numbers. As computers have advanced, the size and complexity of simulation results has increased, too, making the task even more difficult. Using technologies like virtual reality projections (above) or 3D printing (below) allow researchers to interact with flow information in completely new but intuitive ways, hopefully leading to new insights into the data.

    (Video credit: M. Stock; photo credit: K. Taira et al.)

    ** The 3D-printed vortices are an image I took of a poster at the APS DFD Gallery of Fluid Motion in 2013, but I’m missing the researchers’ names. If you know whose poster these were from, please let me know (fyfluids [at] gmail [dot] com) so that I can update the credits accordingly. Thanks to Shervin for helping me find the right lab to credit!

  • American Football Aerodynamics

    American Football Aerodynamics

    Like many sports balls, the American football’s shape and construction make a big difference in its aerodynamics. Unlike the international football (soccer ball), which undergoes significant redesigns every few years thanks to the World Cup, the American football has been largely unchanged for decades. The images above come from a computational fluid dynamics (CFD) simulation of a spiraling football in flight. Although the surface is lightly dimpled, the largest impact on aerodynamics comes from the laces and the air valve (just visible in the upper right image). Both of these features protrude into the flow and add energy and turbulence to the boundary layer. By doing so, they help keep flow attached along the football longer, which helps it fly farther and more predictably. For more, check out the video of the CFD simulation. (Image credits: CD-adapco; via engineering.com)

  • Supernova Explosion

    Supernova Explosion

    Type 1a supernovae occur in binary star systems where a dense white dwarf star accretes matter from its companion star. As the dwarf star gains mass, it approaches the limit where electron degeneracy pressure can no longer oppose the gravitational force of its mass. Carbon fusion in the white dwarf ignites a flame front, creating isolated bubbles of burning fluid inside the star. As these bubbles burn, they rise due to buoyancy and are sheared and deformed by the neighboring matter. The animation above is a visualization of temperature from a simulation of one of these burning buoyant bubbles. After the initial ignition, instabilities form rapidly on the expanding flame front and it quickly becomes turbulent. (Image credit: A. Aspden and J. Bell; GIF credit: fruitsoftheweb, source video; via freshphotons)

  • Featured Video Play Icon

    Blood Flow Simulations

    Though we may not often consider it, our bodies are full of fluid dynamics. Blood flow is a prime example, and, in this video, researchers describe their simulations of flow through the left side of the heart. Beginning with 3D medical imaging of a patient’s heart, they construct a computational domain – a meshed virtual heart that imitates the shape and movements of the real heart. Then, after solving the governing equations with an additional model for turbulence, the researchers can observe flow inside a beating heart. Each cycle consists of two phases. In the first, oxygenated blood fills the ventricle from the atrium. This injection of fresh blood generates a vortex ring. Near the end of this phase, the blood mixes strongly and appears to be mildly turbulent. In the second phase, the ventricle contracts, ejecting the blood out into the body and drawing freshly oxygenated blood into the atrium. (Video credit: C. Chnafa et al.)

  • Fluids Round-up – 20 October 2013

    Fluids Round-up – 20 October 2013

    Some very cool fluids applications in this week’s fluids round-up. On to the links!

    ETA: I somehow forgot to include the first of the upcoming APS presentations to get wide media recognition: Law of Urination, which has shown up all over the place.

    (Photo credit: San Diego Air and Space Museum Archive/In Focus)

  • Featured Video Play Icon

    Supersonic Bubble Shock Waves

    Supercomputing has been an enormous boon to fluid dynamics over the past few decades. Many problems, like the interaction between a supersonic shock wave and a bubble, are too complicated for analytical solutions and difficult to measure experimentally. Numerical simulation of the problem, combined with visualization of key variables, adds invaluable understanding. Here a shock wave strikes a helium bubble at Mach 3, and the subsequent interactions in terms of density and vorticity are shown. This situation is relevant to a number of applications, such as supersonic combustion and shockwave lithotripsy–a medical technique in which kidney stones are broken up inside the body using shock waves. After impact, an air jet forms and penetrates the center of the structure while the outer regions mix and form a persistent vortex ring. (Video credit: B. Hejazialhosseini et al.; via Physics Buzz)

  • Formula 1 Aerodynamics

    [original media no longer available]

    Computational fluid dynamics (CFD) and the advent of supercomputing have forever changed the way engineers design. Here the use of CFD in the design of Formula 1 racing cars is discussed. Although CFD is used by many companies in place of wind tunnel testing, each method has its advantages.  CFD provides information about all flow quantities at all points in the flow but can only do so with an accuracy dependent on the grid and models used.  It remains impossible to solve the equations of motion exactly for any problem of practical application because the computational cost is simply too high; instead software packages like FLUENT utilize turbulence models that approximate the physics.  Wind tunnel testing, on the other hand, is physically accurate but typically yields only limited data and flow quantities due to the difficulty of instrumentation. (Video credit: BBC News; submitted by carhogg)

    (Source: /)
  • Simulated Turbulence

    Simulated Turbulence

    This image, taken from a direct numerical simulation, shows turbulence in a stably stratified flow in which lighter fluid sits atop a denser fluid. In the image lighter colors represent denser fluid. Turbulence is created by the shear forces caused when the lighter fluid on top moves faster than the denser fluid on the bottom; however the stable stratification will tend to counteract or stabilize the turbulence. Note the vast variety and detail of the scales involved in turbulence; this is what makes it such a difficult process to simulate and model. (Image credit: G. Matheou and D. Chung, NASA/JPL-Caltech)

  • Featured Video Play Icon

    Simulating Turbulence

    Turbulent flows are complicated to simulate because of their many scales. The largest eddies in a flow, where energy is generated, can be of the order of meters, while the smallest scales, where energy is dissipated, are of the order of fractions of a millimeter. In Direct Numerical Simulation (DNS), the exact equations governing the flow are solved at all of those scales for every time step–requiring hundreds or thousands of computational hours on supercomputers to solve even a small domain’s worth of flow, as on the airplane wing in the video. Large Eddy Simulation (LES) is another technique that is less computationally expensive; it calculates the larger scales exactly and models the smaller ones. The video shows just how complicated the flow field can look. The red-orange curls seen in much of the flow are hairpin vortices, named for their shape, and commonly found in turbulent boundary layers.

  • Featured Video Play Icon

    Vortex Shedding from a Hot Cylinder

    This numerical simulation shows vortex shedding behind a hot cylinder. The behavior is very similar to what one sees behind an unheated cylinder, until the coefficient of thermal expansion increases and the von Karman vortex street is completely distorted. Describing the particulars of the computation, jessecaps writes (links added):

    I wrote an incompressible flow solver to simulate flow past a heated cylinder. The Navier-Stokes equations are discretized on a Cartesian grid and solved explicitly in time. The pressure-Poisson equation is solved implicitly using a bi-conjugate gradient method. The Boussinesq approximation was used (density is constant everywhere except for the gravity term) to account for buoyancy. Reynolds number = 250, Froude number = 1 (gravity is pointing down). The two simulations show the effect of the coefficient of thermal expansion. Each video shows a plot of velocity and temperature.

    (submitted by jessecaps)