It may look like grainy, black and white static from a 20th-century television, but this animation shows what may be the first view of gravity waves seen from the ground on another planet. The animation was stitched together from photos taken by the Mars Curiosity rover’s navigation camera, and it shows a line of clouds approaching the rover’s position.
Gravity waves are common on Earth, appearing where disturbances in a fluid propagate like ripples on a pond. In the atmosphere, this can take the form of stripe-like wave clouds downstream of mountains; internal waves under the ocean are another variety of gravity wave. If these are, in fact, Martian gravity waves, they are likely the result of wind moving up and over topography, much like their Terran counterparts. (Image credit: NASA/JPL-Caltech/York University; research credit: J. Kloos and J. Moores, pdf; via Science; h/t Cocktail Party Physics)
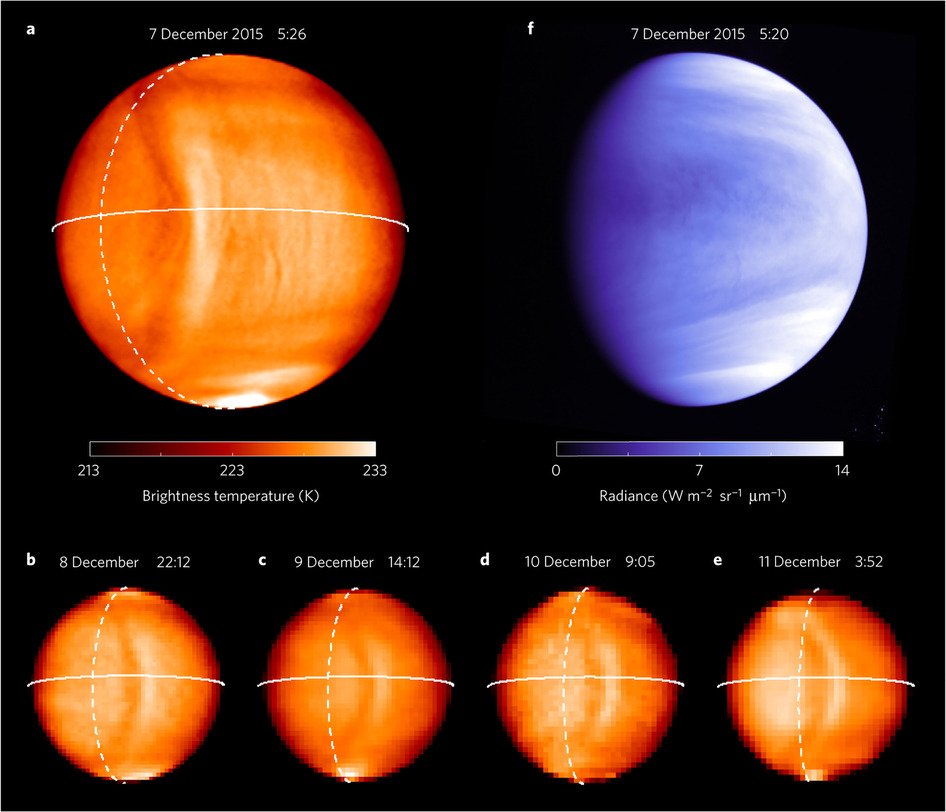
Despite its proximity, Venus remains largely mysterious, thanks to its cloudy atmosphere and incredible harsh conditions. A recent study using data from the Japanese satellite Akatsuki revealed an enormous bow-shaped wave in the Venusian atmosphere. The wave appeared at an altitude of about 65 km and stretched more than 10,000 km long, across both the northern and southern hemispheres. Although surface winds on Venus are believed to be small due to its incredibly slow rotation, winds higher in the atmosphere are much faster – so it was strange to observe this wave sitting essentially stationary for five days of observation.
When the scientists mapped the location of wave relative to the surface, they found it was sitting over the Aphrodite Terra highlands, suggesting that this structure is a gravity wave generated by winds interacting with the topography. Similar, albeit smaller, gravity waves are often observed on Earth near mountains. The finding raises questions about our understanding of Venusian atmospheric dynamics and exactly how disturbances from surface winds could create enormous structures so high in the atmosphere. (Image credit: T. Fukuhara et al.; h/t to SciShow Space)
Photographer Dave Sandford braved the cold and turbulent waters of Lake Erie in late fall to capture some remarkable wave action. Like on the ocean, waves in the Great Lakes are largely driven by winds, but lakes don’t develop the constant set of rolling waves that oceans do. Instead their waves are more erratic and unpredictable. Sandford focused on capturing the moment when wind-driven waves coming into shore collided with waves rebounding from piers or rocks along the shore. The results are waves that, through Sandford’s lens, look like exploding mountainsides. Such energetic waves mix sediment and nutrients in the lake, and the spray of droplets can even loft aerosols and pollutants from the water into the atmosphere. (Photo credit: D. Sandford; via Flow Vis)
Earlier this summer, the spillway of the Banja Dam was opened for the first time, releasing a stream of excess water from the reservoir. As you can see above, waves quickly formed at the surface of the falling water. You’ve likely noticed this yourself in the run-off along the street after a storm. It turns out that shallow water running down an incline is unstable. A disturbance to the flow – from surface roughness, vibration, or a change in curvature – will grow, just like a ball sitting at the top of a hill will roll down as soon as it’s prodded. For more about this kind of instability, check out this post or my video about boundary layer stability and the Space Shuttle. (Image credit: Guillaume TYTECA, source; via Gizmodo)
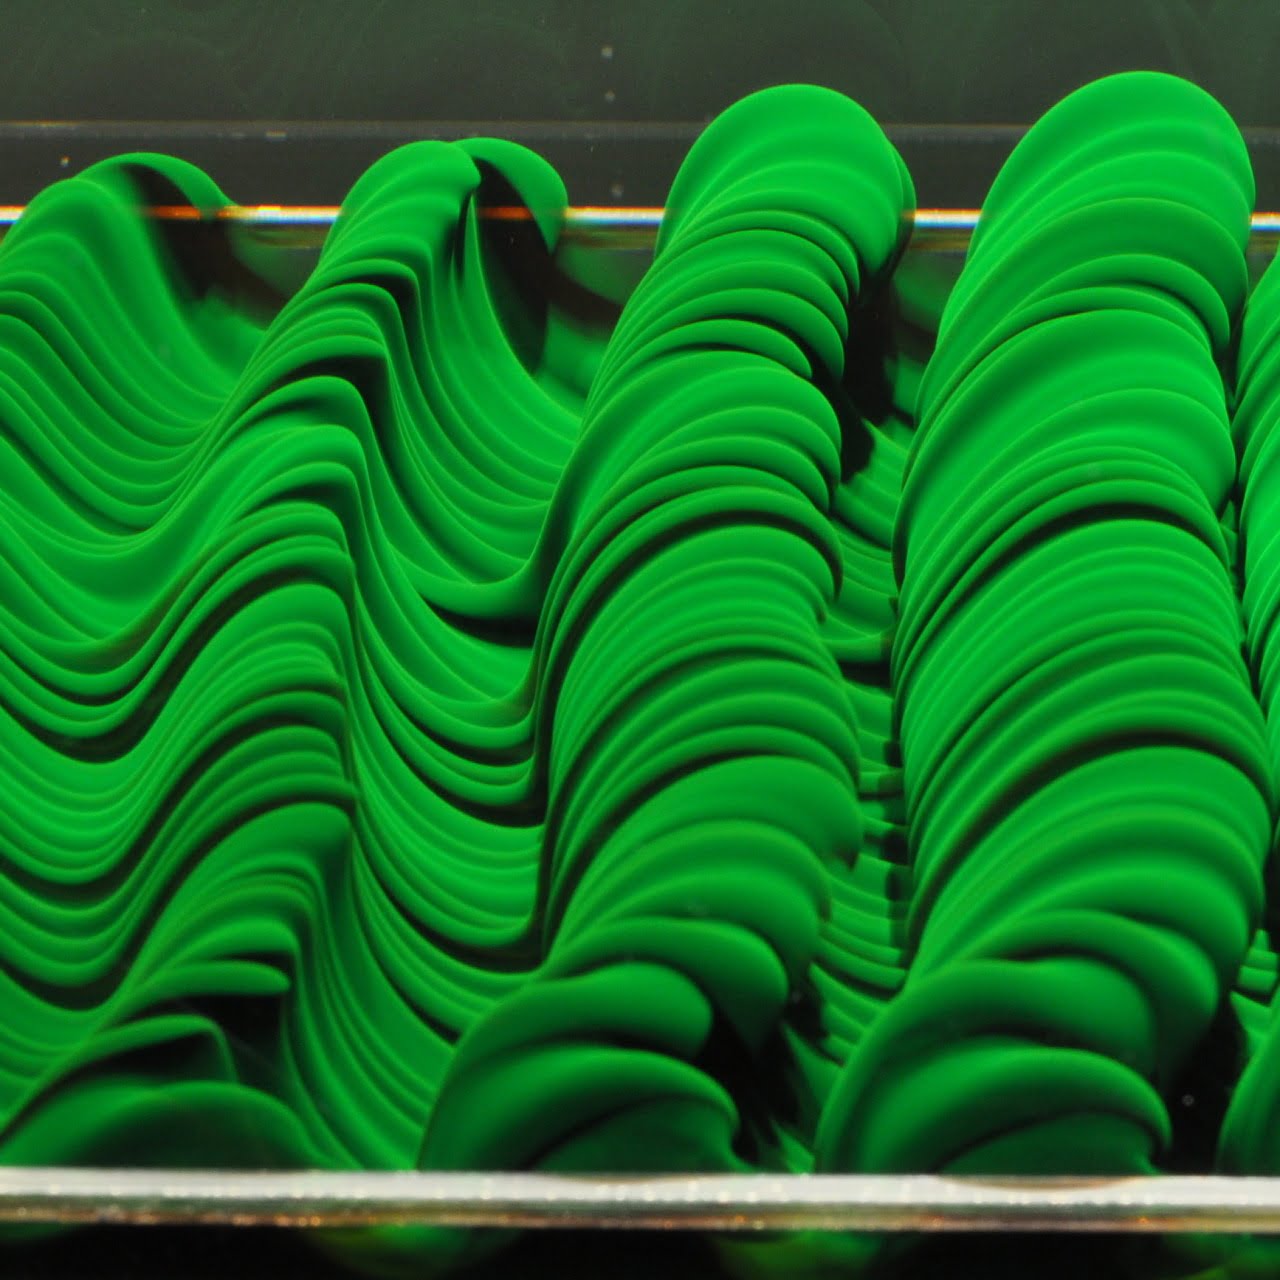
Here on Earth, placing a denser fluid over a lighter one creates an unstable equilibrium. Thanks to gravity, the heavier, denser fluid wants to sink and the lighter fluid wants to rise. Any small disturbance will kick this into action, just like a tiny nudge can send a ball rolling down the hill. For the fluid, that nudge manifests as waviness in the interface between the two fluids. That waviness will quickly grow into billows like those shown above as the Rayleigh-Taylor instability takes over and the heavy (clear) fluid trades places with the lighter (green) fluid. You’ve probably witnessed this effect yourself when pouring milk into iced coffee. To see it in action, check out the video of this experiment or my FYFD video on the Rayleigh-Taylor instability. (Image credit: M. Davies Wykes)
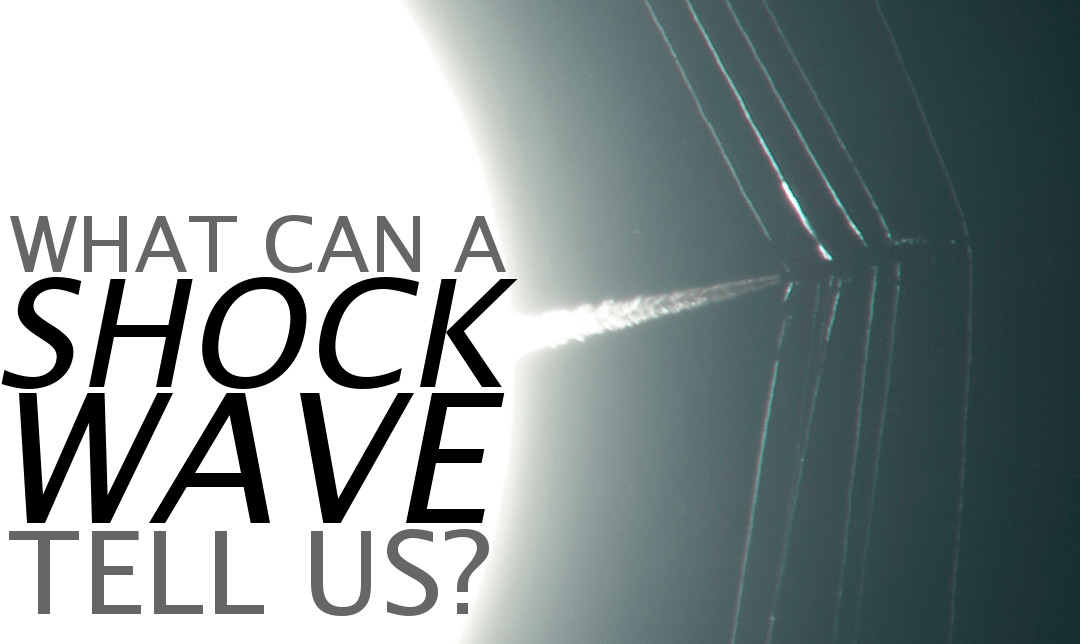
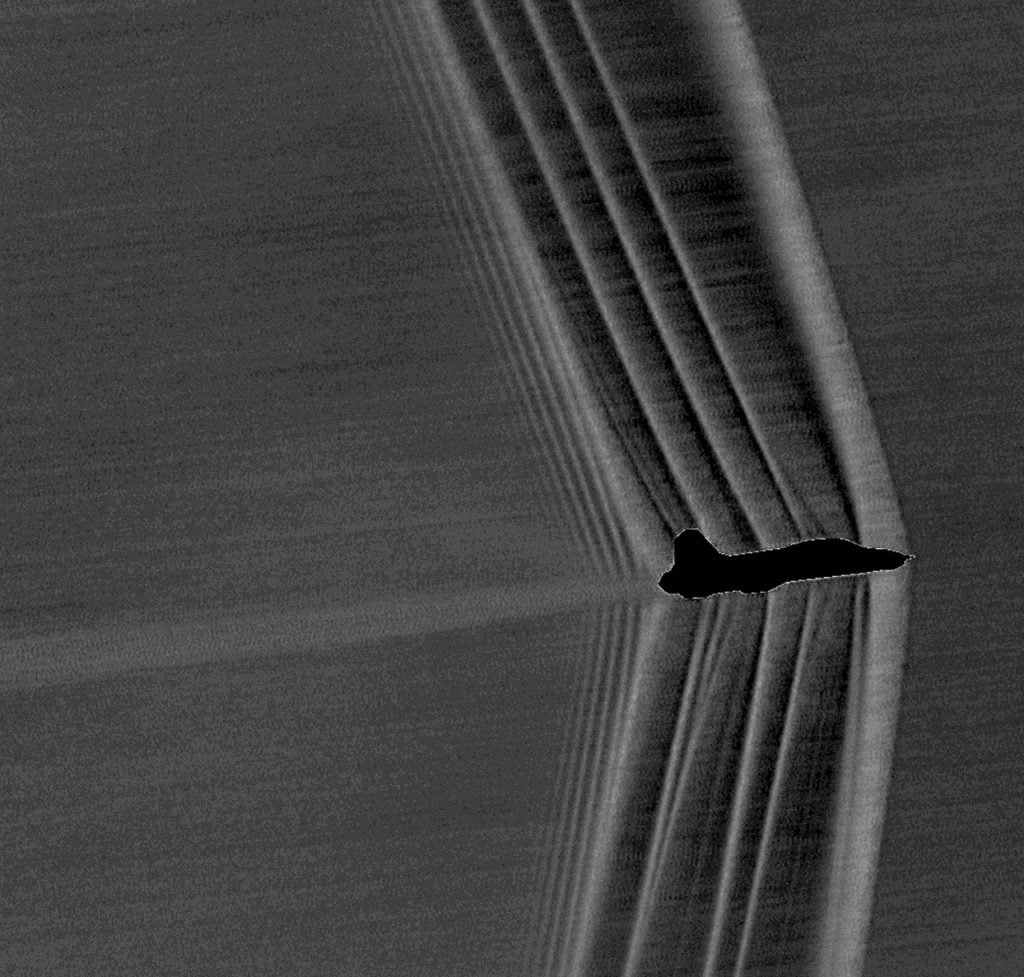
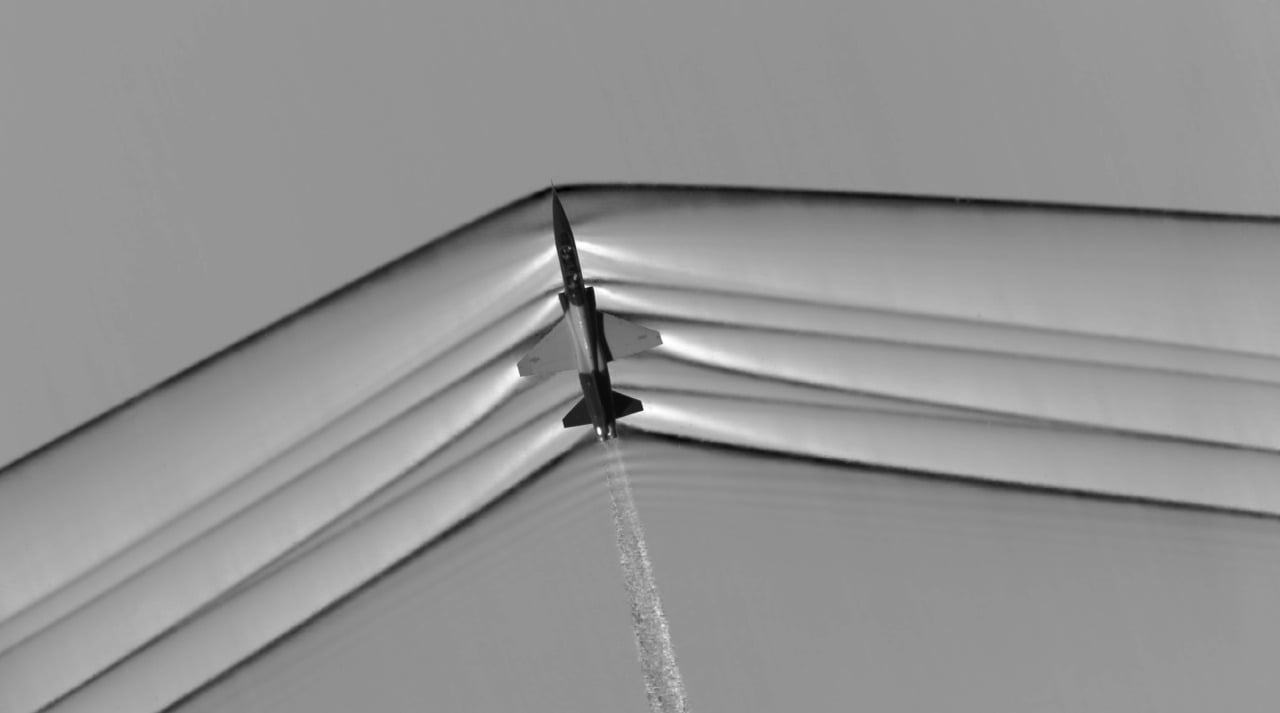
This week NASA released two new images of the shock waves surrounding T-38C jets in free flight. They’re the result of NASA’s new adaptations of the schlieren photography technique, which has let scientists visualize shock waves (in the lab, at least) for more than a century. To celebrate, I thought it would be fun to demonstrate some of the data engineers can extract from images like the one above. So I’m going to show you how to calculate how fast this plane was flying!
Shock waves depend a lot on geometry. This is not too surprising, really, since shock waves are nature’s way of quickly turning the air because there’s an object in the way. This leads to a very powerful observation, though: the angle of a shock wave depends on the geometry of the object and the Mach number of the flow. (The Mach number is the ratio of an object’s speed to the local speed of sound, so an object moving at Mach 1 is moving at the speed of sound.)
The reverse observation is also true: if we can measure the angle of a shock wave from a known geometry, then we can calculate the Mach number. Now, I don’t have any special information about the geometry of a T-38, so most of the shock waves in this picture can’t tell me much quantitatively.
But, it turns out, I don’t need to know anything about the geometry of the plane to figure out its Mach number. That’s because that very first shock wave over on the right is coming off a sharp probe mounted over the airplane’s nose. The probe is sharp enough, in fact, that I can treat it as though it’s a tiny point disturbance. That means that rightmost shock wave is a special kind of shock known as a Mach wave, and its geometry depends solelyon the Mach number. It’s a pretty simple equation, too:
So, all I have to do is fire up some software like GIMP or ImageJ and estimate the angle of that first shock wave.
I came up with an estimate of about 77 degrees for the shock wave angle, which gives Mach 1.026 for the plane’s speed. Keep in mind that a) I’m using a grainy photo; and b) I have no information about the plane’s orientation relative to the camera. Nevertheless, NASA’s caption reports that this plane was moving at Mach 1.05 in the picture. My quick and dirty estimate is only off by 2%!
Of course, engineers are interested in a lot more than estimating an aircraft’s speed from these photos. With a little more geometry information, they can gather a lot of useful data from these images. One of the goals for the new photography technique is to help study new aircraft designs that generate weaker shock waves and quieter sonic booms. (Original images: NASA)
With a large enough explosion, it’s actually possible to see shock waves. This high-speed camera footage shows the detonation of a car packed with explosives. After the initial flash, you can see the thin membrane of the blast wave expanding outward. This shock wave is a traveling discontinuity in the air’s properties–temperature, pressure, and density all change suddenly over an incredibly small distance. It’s this last variable–density–that enables us to see the effect. Density has a significant impact on air’s index of refraction (which also explains heat mirages). In this case, the shift in refractive index is large enough that we see the difference relative to the background, enabling our eyes to follow an otherwise invisible effect. (Video credit: Mythbusters/Discovery Channel; via Gizmodo)
These spectacular wave-like clouds are the result of the Kelvin-Helmholtz instability. When two layers of air move past one another at different velocities, an unstable shear layer forms at their interface. Disturbances in this shear layer grow exponentially, creating these short-lived overturning waves that quickly turn turbulent. The strong resemblance of these clouds to breaking ocean waves is no coincidence–the Kelvin-Helmholtz instability occurring between the wind and water is what generates many ocean waves. Kelvin-Helmholtz patterns are also common on other planets, like Jupiter, Saturn, and Mars. (Image credit: Breckenridge Resort; submitted by jshoer)
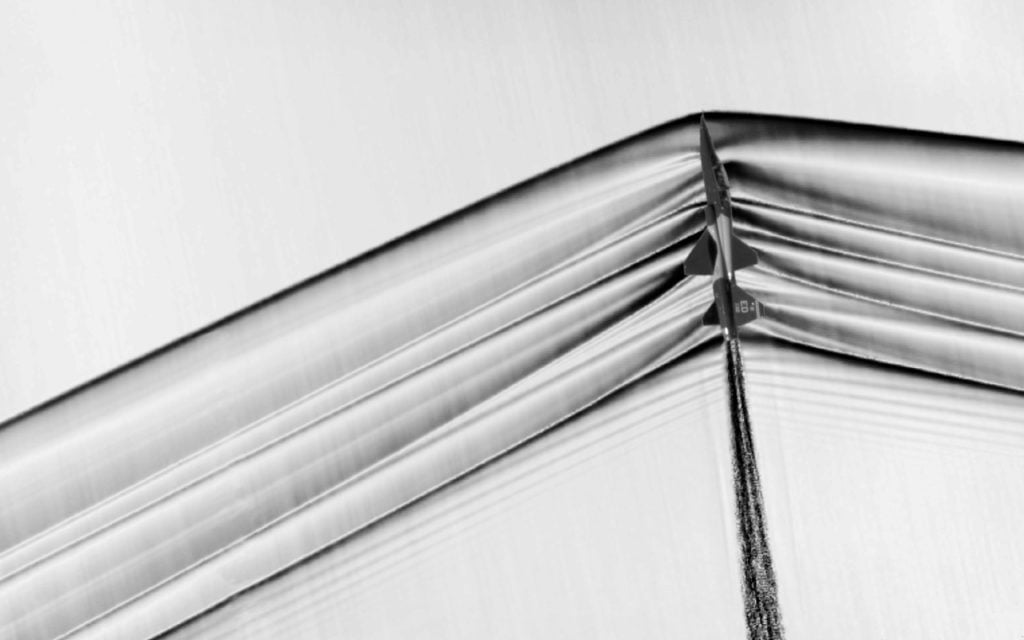
Schlieren optical systems have been used to visualize shock waves in labs for more than a century, but the technique did not translate well to photographing shock structures outside the lab. But now NASA’s Armstrong Research Center and Ames Research Center have developed a method that allows them to capture highly-detailed images of the shock waves around airplanes while they are flying. This is incredible stuff. Be sure to check out the high-resolution versions on this page, along with more description of the coordination necessary to pull off the photos.
The light and dark lines you see emanating from the airplane are places with strong density gradients. The dark lines are mostly shock waves, with the strongest shock waves appearing black due to the large change in air density. Many of the light streaks are expansion fans, areas where the density and pressure drop as air speeds up.
The goal of this research is to better understand shock wave structures around supersonic planes in order to reduce the noise supersonic aircraft cause when flying overhead. As you can see in the photos, the shock waves at the nose and tail of the aircraft persist far away from the aircraft; these are what cause the twin sonic boom heard when the plane flies by. (Photo credit: NASA; via J. Hertzberg)
Typically, shock waves are invisible to the human eye. Using sensitive optical techniques like schlieren photography, researchers in a lab can visualize sharp density gradients like shock waves or even the slight density variations caused by natural convection. But it takes some special conditions to make shock waves visible to the naked eye. The blast wave of the explosion in the photo above is a great example. The leading edge of the shock wave and the heat of the explosion create a strong, sharp change in density. That density change is accompanied by a change in the air’s refractive index. As light travels from the distance toward the camera, it’s distorted–more specifically, refracted–when it travels through the blast wave and its wake. And, in this case, that visual distortion is strong enough that we can clearly see the outlines of the shock waves moving out from the explosion. The apparent horizontal line through the blast wave is probably the intersection of a weaker secondary shock wave with the initial expanding shock wave. (Image credit: Defense Research and Development Canada; via io9)


