Kilauea’s 2018 eruption gave us some of the most stunning volcanic footage ever seen, a tradition carried on in this BBC footage. As powerful and destructive as lava is, it’s also critical to life as we know it here on Earth. Volcanoes are a piece of the tectonic activity on our planet that drives the carbon cycle, without which we’d have no oceans or breathable atmosphere. It’s tough to imagine the geological scales over which these cycles act, but fortunately, there are numerical simulations to help! (Image and video credit: BBC Earth)
Search results for: “smoke”

Stratospheric Effects of Wildfires
Australia’s bushfires from earlier this year are offering new insights into how pyrocumulonimbus clouds can affect our stratosphere. A massive, uncontrolled blaze between December 29th and January 4th generated a towering, turbulent cloud of smoke like the one shown above.
Using meteorological data, a new study shows this enormous cloud initially rose to 16 km in altitude, then began a months-long trek that circled the globe. The smoke plume ultimately stretched to over 1,000 km wide and reached a record altitude of over 31 km. Inside the plume, concentrations of water vapor and carbon monoxide were several hundred percent higher than normal stratospheric air.
Researchers found the plume extremely slow to dissipate, possibly due to strong rotational winds surrounding it. This is the first time scientists have observed these shielding winds, and work is still underway to determine how and why they formed. (Image credit: M. Macleod/Wikimedia Commons; research credit: G. Kablick III et al.; via Science News; submitted by Kam-Yung Soh)

Aerosol Transport
NASA Goddard has produced another gorgeous visualization of how various aerosols move around our world. This visualization is constructed from data collected between August 2019 and January 2020, which means that it captures numerous typhoons as well as the extreme bushfires that occurred in Australia.
Different colors represent different aerosol sources: carbon (red), sulfate (green), dust (orange), sea salt (blue), and nitrate (pink). The brighter the color, the higher the concentration of aerosols. With this, we see steady patterns of natural sea salt transport and the billowing flow of dust from Saharan Africa. But we can also see manmade pollution from sources across the Northern Hemisphere, as well as major output from the Australian bushfires. It’s a good reminder that none of us is truly isolated in this interconnected world of ours. (Video and image credit: NASA Goddard; via Flow Vis)

Icy Swirls
Rafts of sea ice follow swirling eddies in this satellite image of the Gulf of St. Lawrence. Just as with phytoplankton blooms and sediment, this thin sea ice can be moved by wind and currents to reveal hidden flow patterns. Experimentalists use many similar diagnostics that introduce bubbles, particles, smoke, and other tracers into flows to visualize motion that’s otherwise invisible. (Image credit: J. Stevens/NOAA/NASA; via NASA Earth Observatory)

Inferring Flows with Neural Networks
Fluid dynamicists have long used flow visualization methods to get a qualitative sense for flows, but it’s rare to derive much quantitative data from this imagery. But that may soon change thanks to a new computational technique, called Hidden Fluid Mechanics, that uses data from flow visualizations combined with physics-informed neural networks to derive the underlying velocities and pressures in a flow.
The technique relies on two important ideas. One is that the dye, smoke, or other method of visualizing the flow does not alter the underlying flow; it’s just something carried along by the fluid. In other words, the flow behaves exactly the same whether or not you inserted dye or smoke.
The second key idea is that the Navier-Stokes equations — which are derived from conservation of mass, momentum, and energy — accurately describe the physics of a flow. That assumption is critical to the technique since it uses those equations to constrain the flow fields the algorithm reconstructs.
So here, roughly speaking, is what the algorithm actually does: researchers feed it concentration data from a flow visualization — essentially how much smoke or dye is present at every point in space and time — and the neural network reconstructs, based on the Navier-Stokes equations, what velocity and pressure field would produce that concentration data.
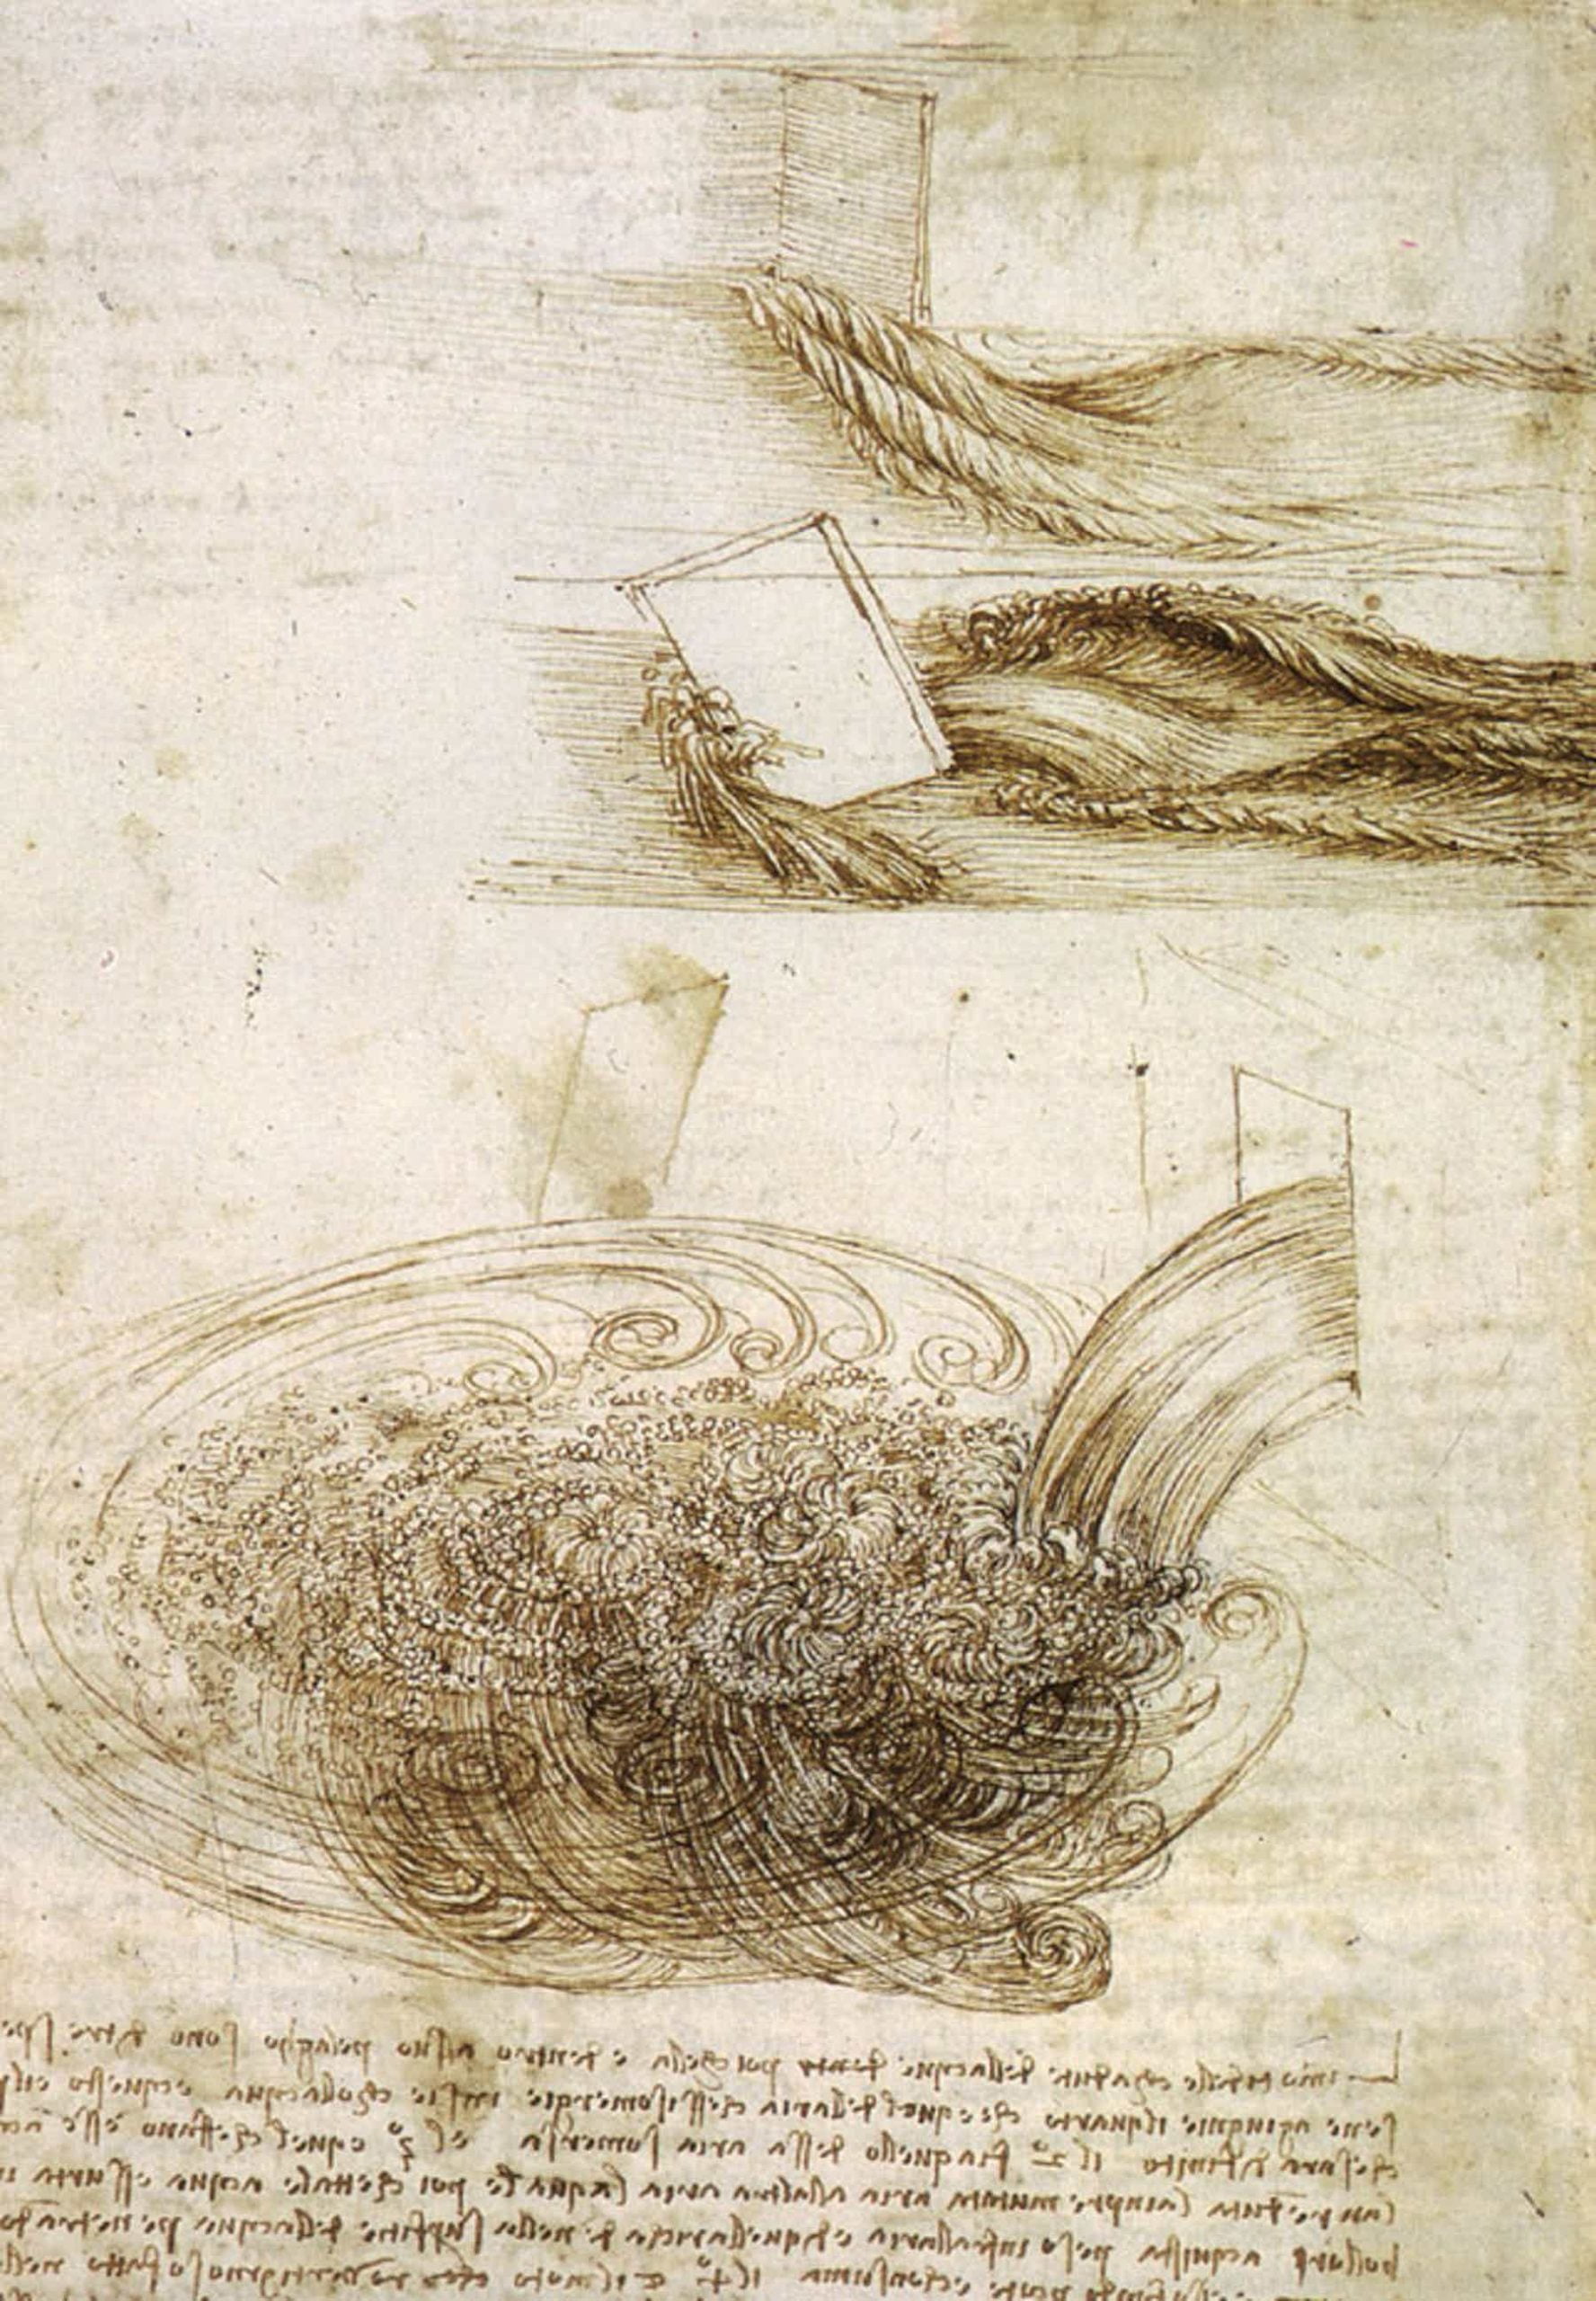
The researchers demonstrate the capabilities of their algorithm by comparing its results to flows where all the information is known. The first image in the gallery above shows concentration data for the flow in an aneurysm. The full flow field is known already from a numerical simulation, but the researchers gave their new algorithm only the concentration data. From that, it reconstructed the streamlines for the aneurysm’s flow, shown in the second image as “Learned”. The “Exact” streamlines on the left are taken from the original numerical simulation data. As you can see, the results are remarkably similar. (Image credit: drawings – L. da Vinci, others – M. Raissi et al.; research credit: M. Raissi et al.; submitted by Stuart H.)

Blowing Vortex Rings from Bubbles
When bubbles burst, we often pay attention to the retracting film and forming droplets, but what happens to the air that was inside? By placing a little smoke inside them, we can see. The air inside these bubbles is slightly pressurized compared to the ambient, and as such a bubble ruptures, its air gets pushed out the expanding hole. That momentum makes the air curl as it forces its way into the surrounding air, creating a stack of vortex rings. The researchers observed as many as six stacked vortices from bubbles just under 4 cm in diameter. (Image and research credit: A. Dasouqi and D. Murphy; video credit: Science; see also A. Dasouqi and D. Murphy)

Seeing the Song
We can’t always see the flows around us, but that doesn’t mean they’re not there. Audobon Photography Award winner Kathrin Swaboda waited for a cold morning to catch this spectacular photo of a red-winged blackbird’s song. In the morning chill, moisture from the bird’s breath condensed inside the vortex rings it emitted, giving us a glimpse of its sound. (Image credit: K. Swaboda; via Gizmodo; submitted by Joseph S and Stuart H)

Vortices and Ground Effect
Though typically unseen, the vortices that swirl from the tips of aircraft wings are powerful. Here you see a Hawker Sea Fury equipped with a smoke system used to visualize the vortices that form at the wingtip as high-pressure air from the bottom of the wing and low-pressure air from the top swirl together. As you can see, the vortices persist in the wake long after the plane passes. The size and strength of the vortices depend on the size and speed of the aircraft; this is why air traffic control requires smaller planes to wait longer to take off or land if there was just a larger aircraft on the runway.
The other cool thing to note here is how the wingtip vortices move apart from one another in the animation above. In flight, wingtip vortices usually stay roughly parallel to one another, but they drift downward in the aircraft’s wake. Near the ground, though, the vortices cannot move down, so instead ground effect forces them apart from one another, as seen here. (Image and video credit: E. Seguin; via Kelsey C.)

Fire Tornado in a Bubble
File this one under awesome tricks you shouldn’t try at home. Here bubble artist Dustin Skye demonstrates his handheld inverted fire tornado. First, he blows a large encapsulating bubble, then blows butane and smoke into a smaller secondary bubble. When he breaks the wall between the two, the mixture swirls into the larger bubble. Then, by breaking a narrow hole into the remaining bubble, Skye forms a swirling tornado. He’s using conservation of angular momentum here to concentrate the vorticity he created by blowing into the original butane bubble. As the big bubble shrinks, the vorticity inside gets pulled inward and speeds up – like when a spinning ice skater pulls his arms in. That’s how you get the tornado. And from there, it’s just a matter of lighting the exiting butane and air mixture. (Video credit: D. Skye; via Gizmodo)

The Great Smog of London
Our atmosphere is active and ever-changing – except when it isn’t. Some areas, including many cities, are prone to what’s known as a temperature inversion, where a layer of cooler air gets trapped underneath a warmer one. Because this means that a dense layer is caught under a less dense one, the situation is stable and – absent other changes in circumstances – will stick around. There are several ways this can happen, including overnight when areas near the ground cool faster than the atmosphere higher up.
When temperature inversions persist, they can trap pollutants and create health hazards. One of the worst of these recorded occurred in December 1952 in London. An anticyclone created a temperature inversion over the city that trapped smoke from coal burned to warm homes and reduced visibility – sometimes even indoors – to only a meter or two. Thousands of people died from the respiratory effects of the five-day smog, and it prompted major efforts to improve emissions and air quality. Temperature inversions cannot be avoided, but the Great Smog of London taught us the necessity of reducing their danger. (Image credit: Getty Images)


