Differences in surface tension can create Marangoni flow along an interface. Imagine a shallow bowl filled with a liquid. In the middle of the fluid, every molecule is surrounded on all sides by like molecules, which push and pull it equally in all directions. But at the surface, the fluid molecules are only acted on by similar molecules in some directions. This imbalance in molecular forces is what creates surface tension. When the surface tension is constant, the fluid surface is like a taut rubber sheet. Poke a hole in that sheet, and everything pulls away from the hole. Likewise, when the surface tension varies, fluid will move from areas of low surface tension toward areas of higher surface tension. This effect is easily demonstrated at home in a setup like the animation above. Pour milk (higher fat content is better) and food coloring in a shallow container. Then lower the local surface tension using dish soap or rubbing alcohol and watch the colors run away! (Image credit: Flow Visualization at UC Boulder, source video)
Search results for: “flow visualization”

The Churning of Corals


Corals may appear static, but near the surface the tiny hair-like cilia of these polyps are churning the water. Although it has been known for some time that corals have cilia, scientists had previously assumed they only moved water parallel to the coral’s surface. Instead recent flow visualizations show that the cilia’s movements generate larger-scale vortical flows near the coral that can help draw fresh nutrients in as well as flush waste away. This means that, instead of being reliant on currents and tides, corals can exert some control on their environment in order to get what they need. This insight into coral cilia may shed some light on the micro- and macroscopic flows generated by other cilia, like those in our lungs. For a similar example of seemingly-passive organisms generating their own flows, check out how mushrooms create air currents to spread their spores. (Image credits: O. Shapiro et al. and MIT News; source video; h/t to Katie B)

Soap Film Grass
In the summer months, a breeze can set long grasses waving in an impressive display. Similar behaviors are seen in aquatic plants during tides. Researchers simulate the behavior in two-dimensions using a flowing soap film and nylon filaments. Flow visualization reveals the strong differences between flow above and between the grass. Vortices recirculate between the filaments at speeds much slower than the flow overhead. The instantaneous interaction of the high-speed freestream, the unsteady vortices, and the resistance of the grass results in familiar synchronous waves of grain. (Video credit: R. Singh et al.)
The Upside-Down Jellyfish
The upside-down jellyfish, Cassiopea, rests its bell against the ocean floor and points its frilly oral arms up toward the sun for the benefit of the symbiotic algae living on it. In return, the algae provide some of the nutrients the jellyfish needs. The rest it obtains by filter feeding for zooplankton. The video above shows how a combination of flow visualization and simplified computational modeling can reveal the jellyfish’s methods for eating. A simple pulsing bell has limited fluid flow in the region of the jellyfish’s mouths, but the addition of a permeable layer (representative of the oral arms) significantly enhances mixing. (Video credit: T. Rodriguez et al.)

Advantages of Schooling
Many fish swim in close proximity to one another in large schools, causing scientists to wonder if this behavior is motivated primarily by defense against predators or whether fish derive some hydrodynamic advantages from schooling. Examining the fluid dynamics of an entire school of fish is rather impractical, so researchers approximate two neighboring swimmers using flapping hydrofoils. The images above show flow visualizations of the wakes of these two mechanical swimmers. When the two hydrofoils flap in-phase with one another (top image), one oscillation period produces a complicated pattern of many vortices zig-zagging behind the foils. This configuration produces more efficient propulsion than a single hydrofoil, meaning that more of the energy in the wake is used to produce thrust. The cost, however, is reduced thrust overall. The bottom image shows the wake pattern for hydrofoils flapping out-of-phase. This behavior enhanced thrust without reducing propulsive efficiency. The results suggest that schooling fish might choose different swimming strategies depending on the situation. (Image credits: P. Dewey et al.)
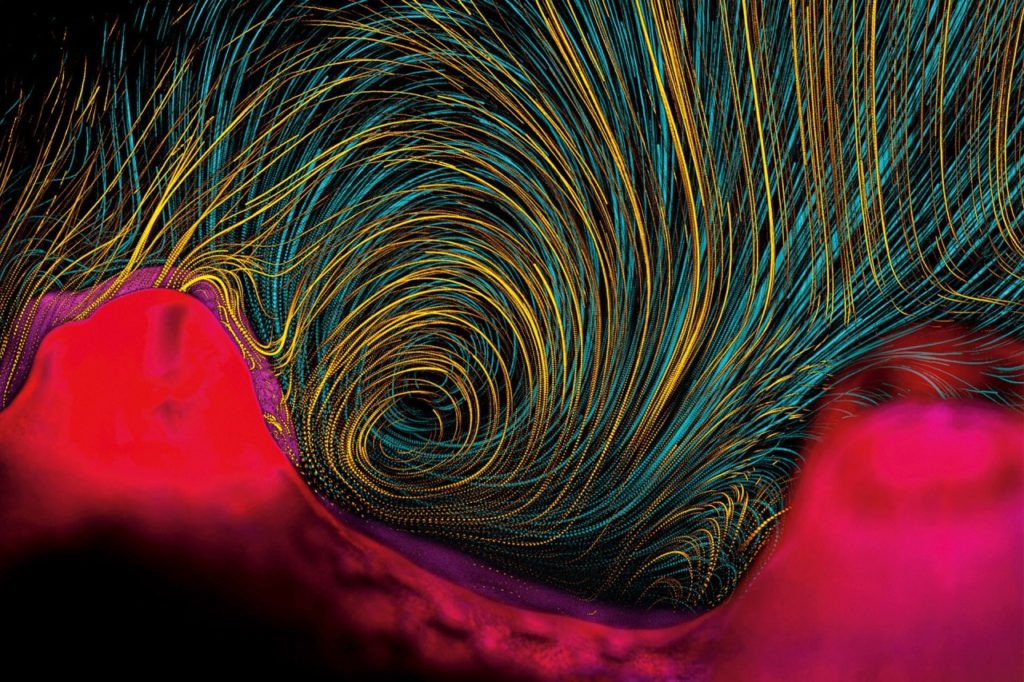
Australian Fire Tornado
The fire tornado is one of nature’s most impressive and terrifying examples of fluid dynamics. Although they are relatively common phenomena, it’s rare to get such a clear glimpse of them since they usually occur in the midst of giant wildfires. The fire tornado is driven by a combination of updraft from the fire and rotation from the surrounding flow. Take a look at how they form:
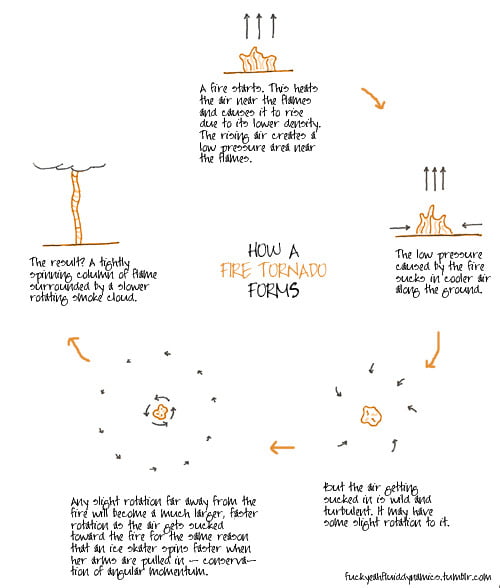
There are artificial fire tornadoes as well, including homemade ones. That said, please do not try this at home without full safety measures and extreme caution. In general, watching YouTube videos is a much safer way to enjoy this phenomenon. (Video credit: C. Tangey; h/t to Flow Visualization)
Measuring Wind Turbines with Snowfall
One of the challenges in large-scale wind energy is that operating wind turbines do not behave exactly as predicted by simulation or wind tunnel experiments. To determine where our models and small-scale experiments are lacking, it’s useful to make measurements using a full-scale working turbine, but making quantitative measurements in such a large-scale, uncontrolled environment is very difficult. Here researchers have used natural snowfall as seeding particles for flow visualization. The regular gaps in the flow are vortices shed from the tip of the passing turbine blades. With a searchlight illuminating a 36 m x 36 m slice of the flow behind a wind turbine, the engineers performed particle image velocimetry, obtaining velocity measurements in that region that could then be correlated to the wind turbine’s power output. Such in situ measurements will help researchers improve wind turbine performance. (Video credit: J. Hong et al.)

Shuttle Re-Entry
Complicated shock wave patterns envelope vehicles traveling at supersonic and hypersonic speeds. A shock wave is essentially a very tiny region–only a few mean free path lengths wide–over which flow conditions, including density, pressure, velocity, and temperature, change drastically. The image above shows a model of the Space Shuttle at a re-entry-like, high angle of attack at around Mach 20 in one of NASA Langley’s historic helium tunnels. The eerie glow outlining the shock structures around the model is a result of electron-beam fluorescence. In this flow visualization technique, a beam of high-energy electrons is swept over the model, causing the gas molecules to fluoresce according to temperature. (Photo credit: NASA Langley)
Put the Lid Down When You Flush
Hospital-acquired infections are a serious health problem. One potential source of contamination is through the spread of pathogen-bearing droplets emanating from toilet flushes. The video above includes high-speed flow visualization of the large and small droplets that get atomized during the flush of a standard hospital toilet. Both are problematic for the spread of pathogens; the large droplets settle quickly and contaminate nearby surfaces, but the small droplets can remain suspended in the air for an hour or more. Even more distressing is the finding that conventional cleaning products lower surface tension within the toilet, aggravating the problem by allowing even more small droplets to escape. To learn more, see the Bourouiba research group’s website. (Video credit: Bourouiba research group)
Pathlines vs. Streaklines
When considering fluid motion, there are many ways to describe trajectories through the flow. One is the pathline, the trajectory followed by an individual fluid particle. Imagine releasing a rubber duck down a stream. Following the duck’s position over time would give you a pathline. Now imagine that instead of releasing a single rubber duck you release lots of them – say one every half-second from the exact same starting spot. You would end up with a line of rubber ducks stretching downstream, each of them sharing the same origin but with a different starting time. This is called a streakline. Would the streakline of rubber ducks follow the same trajectory as the lone duck? Not if the flow is time-varying! In fact, for unsteady flows, pathlines and streaklines can give completely different pictures of a flow, as illustrated in the video above. Knowing and understanding the difference between these types of trajectories is extremely important when it comes interpreting flow visualizations in unsteady flows because some visualization methods produce pathlines and others produce streaklines. (Video credit: V. Miller and M. Mungal)