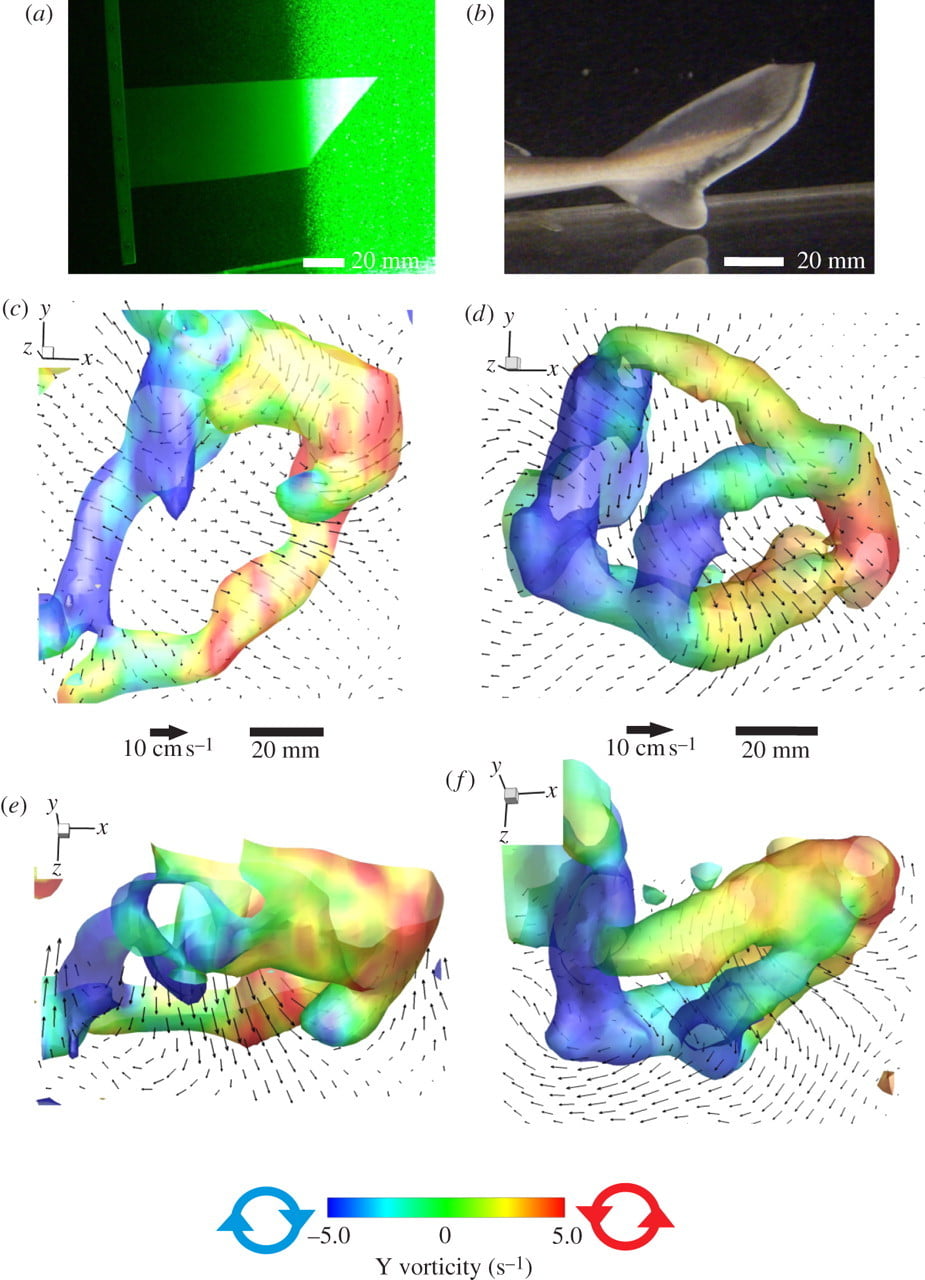
Volumetric imaging of swimming spiny dogfish, a type of shark, shows that their distinctively asymmetric tails produce a set of dual-linked vortex rings with every half beat of their tail. The figure above shows data from the actual shark on the right (b,d,f) and a similarly shaped robotic tail on the left (a,c,e). The second row contains lateral views (c,d) and the bottom row contains dorsal views (e,f) of the vorticity isosurfaces measured. The robotic tail does not demonstrate the same double vortex structure, leading scientists to suspect that the shark may be actively stiffening its tail mid-stroke to control its wake. The finding could help engineers design aquatic robots whose morphing fins help it swim more efficiently. For more, see Wired.
Search results for: “aerodynamics”
Aircraft Contrails
[original media no longer available]
Under the right atmospheric conditions, condensation can form, even at low speeds, as moist air is accelerated over airplane wings. This acceleration causes a local drop in pressure and temperature, which can cause water vapor in the air to condense. The condensation can sometimes get pulled into the wingtip vortices shed off of the wings, tail, and ailerons of an aircraft, as in the video above, making the aerodynamics of the airplane visible to the naked eye.
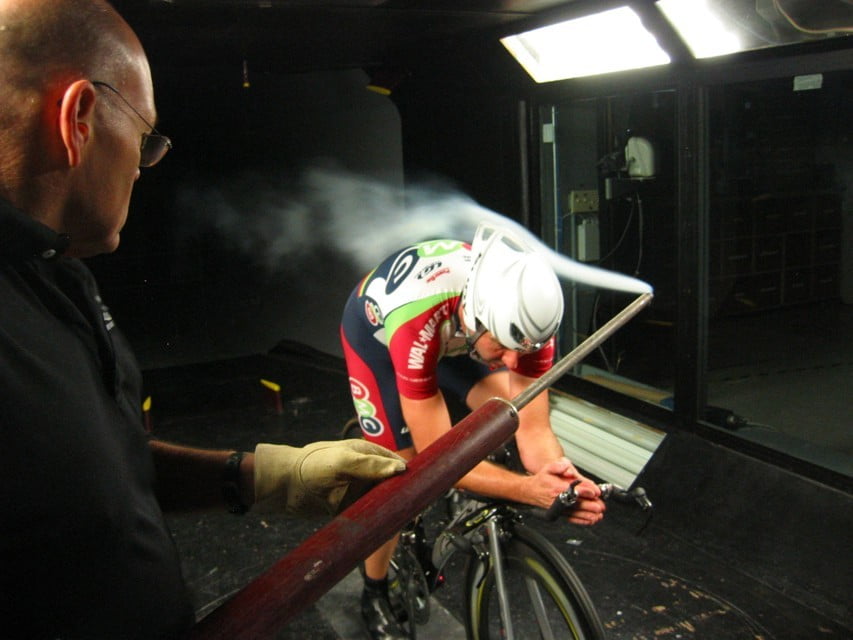
Tour de France Physics: Wind Tunnel Testing
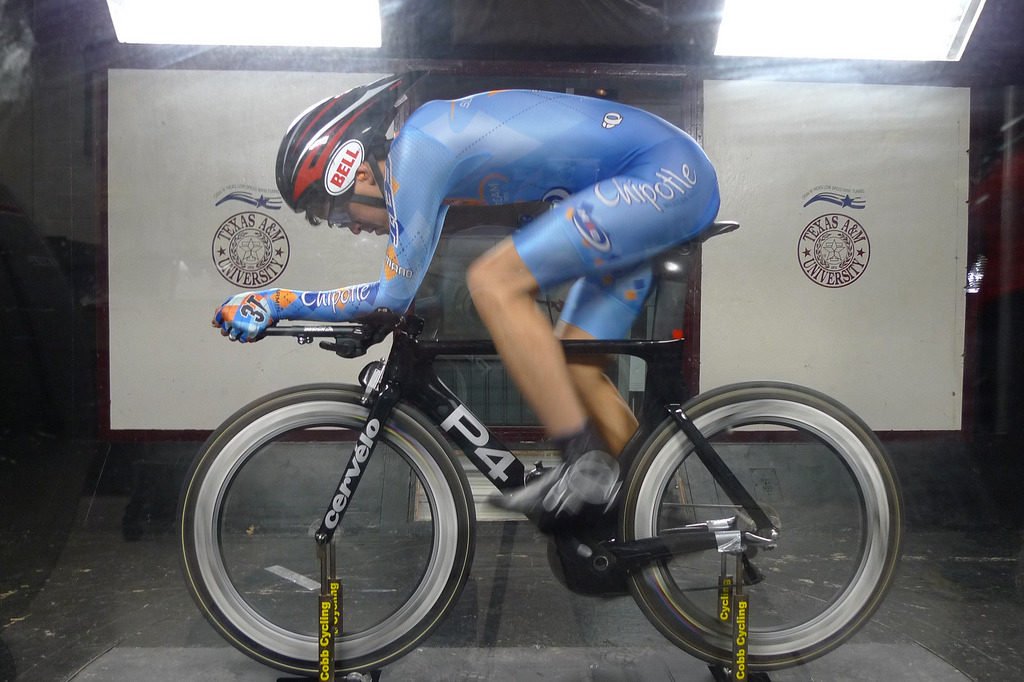
Over hours of racing, even a few grams of drag can be the difference between the top of the podium and missing out. For manufacturers as well as for individual professional cyclists, hours of wind tunnel testing help determine optimum configurations of equipment and positioning. During a day of wind tunnel testing, a cyclist may complete dozens of runs, in which bikes, wheels, helmets, skinsuits, and positioning are all tested and tweaked to find the best combination of aerodynamics.
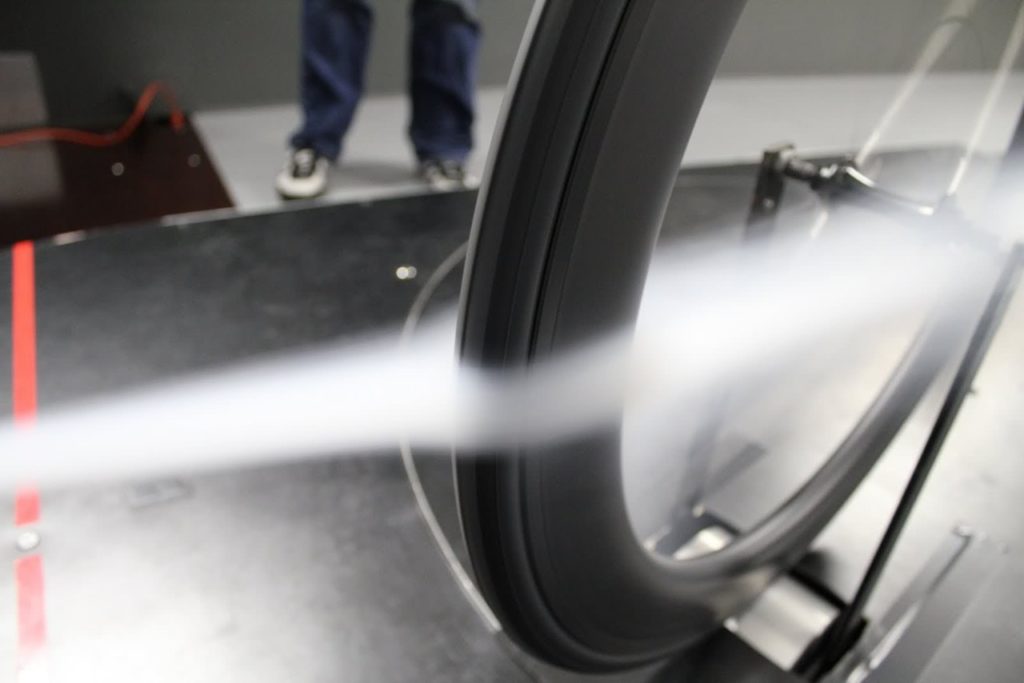
But wind tunnel results don’t always translate perfectly to the road, where buildings, people, cars and other cyclists may interfere with the freestream. And, as any cyclist will attest, the wind is constantly shifting and changing speeds as one rides. The Garmin-Cervelo pro team has developed a rig to measure wind speeds and angles experienced by cyclists in real world conditions. (The exact components used are unclear, but probably include some form of Pitot tube or 5-hole probe.) As more on-the-road data is collected, wind tunnel tests can be improved by placing greater emphasis on the most common wind angle conditions. (Photo credits: John Cobb, Flo Cycling, and Nico T)
This completes FYFD’s weeklong celebration of the Tour de France and the fluid dynamics of cycling. See previous posts on drafting in the peloton, pacelining and echelons, the art of the sprint lead-out train, and the aerodynamics of time-trialing.
Tour de France Physics: Time Trials
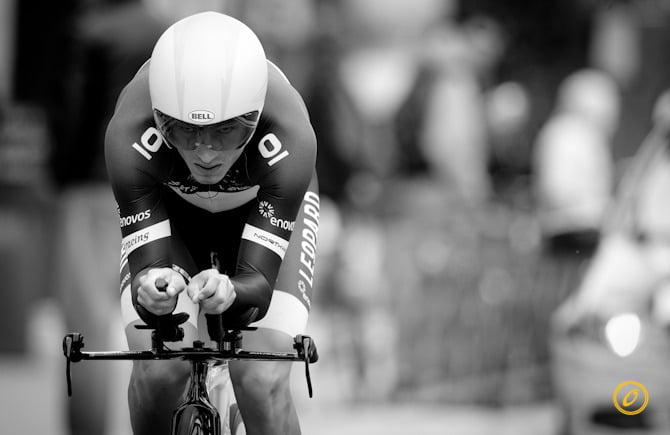
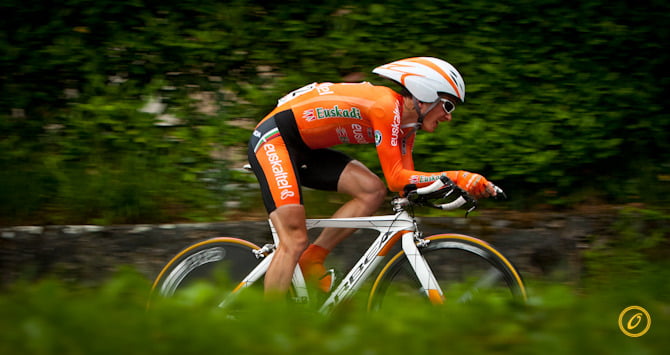
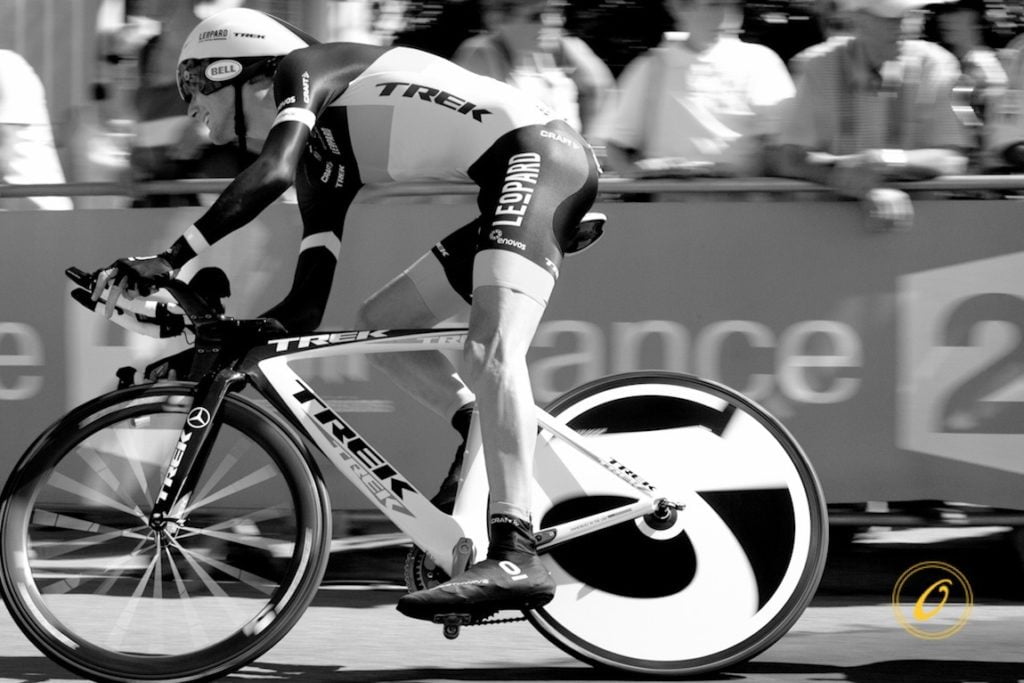
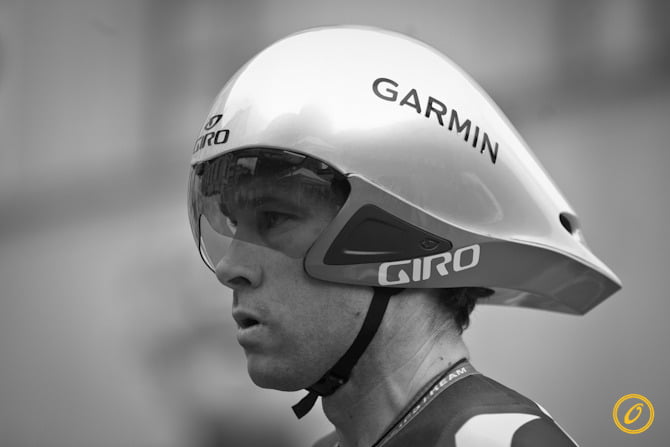
Unlike road stages in which cyclists can draft off one another to reduce drag, in the time trial a cyclist is on a solo race against the clock with nowhere to hide. As a result, the event features lots of technologies designed to reduce both pressure drag and skin friction on the cyclist. For time trials, cyclists wear skinsuits and shoe covers to eliminate any sources of flapping fabrics and to reduce skin friction. They ride bicycles designed to be as light and aerodynamic as possible. Instead of rounded tubing in the frames, these bikes consist of elongated airfoil profiles that direct air past and prevent separation that may increase pressure drag. The rims of their tires are wider and the back wheel is replaced with a disc wheel that allows no airflow aross the wheel. Like the airfoil tubing, these changes help prevent separation. Similarly, riders wear elongated helmets designed to be as aerodynamic as possible while the rider is in the “aero” position, with arms directed out over the wheels, head level, elbows tucked, and back flat. In wind tunnel tests, the rider best able to hold this position will experience the least drag. Even the addition or subtraction of a water bottle is not left to chance, with many time trial bikes designed to be more aerodynamic with a water bottle onboard (though you probably won’t catch the cyclists breaking their aero position to get a drink)! (Photos by Veeral Patel)
FYFD is celebrating the Tour de France with a weeklong exploration of the fluid dynamics of cycling. See previous posts on drafting in the peloton, and pacelining and echelons, and the art of the lead-out train.

Tour de France Physics: Pelotons
July is well underway and for cycling fans around the world that means it’s time for the Tour de France. This week at FYFD we’re going to do something a little different: in honor of cycling’s biggest race, every post this week will focus on some of the fluid dynamics involved in the sport.
On a bicycle, except when climbing, the majority of a rider’s energy goes toward overcoming aerodynamic drag. Riders wear close-fitting clothes to reduce skin friction and loss to flapping fabric, but most of their drag is pressure-based. A blunt object disturbs the airflow around it, usually resulting in separated flow in its wake. A high pressure region forms in front of the rider and a low pressure region forms in the separated flow behind them. This pressure difference literally pulls the rider backwards. Since drag goes roughly as speed squared, adding a headwind makes matters even worse for a cyclist.
In races, especially on flat stages, the majority of the riders will stay in a large group called a peloton in order to counteract these aerodynamics. By riding in the wakes of those in the front, riders in the peloton experience a much smaller front-to-back pressure difference and thus much less drag. For a rider in the midst of the peloton, the drag reduction can be as great as 40% (#). This allows riders to conserve energy for solo efforts near the end of the race or stage, like breaking away from the peloton in the final kilometers or winning a sprint for the finish line. (Photo credit: Wade Wallace)
Supersonic Bullet
[original media no longer available]
This video shows a CFD simulation of a bullet passing through a parallel channel at Mach 2. The simulation captures 3 milliseconds of real-time and shows the Mach number in the top view and the temperature in the bottom view. Note how the bow shock near the front of the bullet and the trailing shock behind it reflect off the walls of the channel and interact. Even though the calculation is inviscid, the shock waves cause intense heating (white) in front of and behind the bullet.

Flow Viz of a Locust
Smoke visualization in a wind tunnel reveals the airflow over a flying locust. Researchers are unraveling the aerodynamics of insect flight in order to produce better Micro Air Vehicles (MAVs) and miniature flying robots. #
Reader Question
aeronode-deactivated20130828 asks:
What’s your academic/professional background? (Just curious.)
Fair question! I am a fourth-year PhD student in aerospace engineering, focusing (naturally) on fluid dynamics. I have a bachelor’s and master’s degree, both also in aerospace engineering. My master’s thesis focused on turbulence and my current work is in high-speed aerodynamics.

Bristling Scales Give Sharks Speed
The shortfin mako shark is one of the ocean’s fastest and most agile hunters, thanks in part to flexible scales along its body. As water flows around the shark’s body, the scales bristle to angles in excess of 60 degrees. This causes turbulence in the boundary layer along the shark’s body and prevents boundary layer separation which would otherwise increase the shark’s drag. In this respect, the scales serve much the same purpose as dimples on a golf ball. (Abstract, National Geographic article) #

Flying Snakes Draft off Themselves
Some snakes in Southeast and South Asia are known to glide some 100 m between trees. Researchers filmed snakes, constructed computational models of their flights, and tested plastic models in a water tunnel. They found that the snakes angled their bodies such that they generate lift to counteract their fall and that the S-configuration they assume increases lift much the way flying in a V-formation does for geese. The wake from the forward portion of the snake interacts with the flow around the back of the snake and reduces downwash, which increases lift. In effect, the back of the snake is drafting off the front. #