Tag: wind tunnels

  • Featured Video Play Icon

    Skydiving in Wind Tunnels

    Skydivers and freefall acrobats utilize vertical wind tunnels as ground training facilities. Low-speed acrobatics, like gymnastics, relies on inertial forces and angular momentum for flips and attitude changes. But at freefall speeds, aerodynamic forces are much larger, and an acrobat’s orientation relative to the flow has a big effect on his stability and maneuverability. Simple movements of an arm or leg can significantly alter one’s aerodynamics, allowing the acrobats to choreograph controlled and synchronized motion. (Video credit: Red Bull)

    Author’s note – After much consideration, I’ve decided to move FYFD to a MWF posting schedule for the time being. Working full-time has its limitations, and I believe the less frequent posting schedule will allow me to dedicate more time to generating new content like FYFD videos. This was a tough decision, but I hope it will help FYFD grow in the long-term. – Nicole

  • Featured Video Play Icon

    Specialized’s Win Tunnel

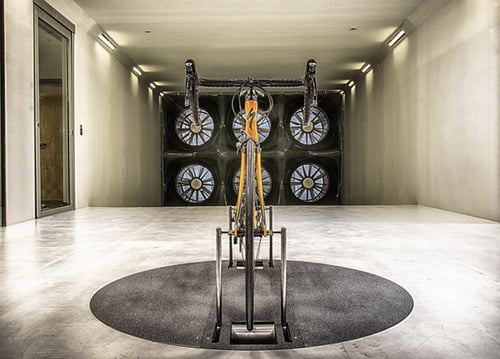
    Awhile back, I mentioned that bike manufacturer Specialized had built their own wind tunnel to test cycling equipment. In this video, they provide a walk-through of their facility. Although there are features unique to this tunnel and its intended purpose, much of what Chris and Mark describe is standard for any subsonic wind tunnel. The story begins upstream in the inlet and contraction, where air is pulled into the tunnel. Honeycomb flow straighteners direct the incoming air, followed by a series of mesh screens. These screens break up any turbulent eddies, which helps smooth and laminarize the flow. The test section is where measurements occur, whether on cyclists or other models. This part of the tunnel is usually equipped with many sensors and specialized equipment, like the balance shown. These allow researchers to measure quantities like force, velocity, pressure, and/or temperature. Then the wind tunnel widens gradually in a diffuser, which slows down the air and helps prevent disturbances from propagating upstream. Finally, the fans at the back provide the source of low-pressure that drives the air flow. (Video credit: Specialized Bicycles; submitted by J. Salazar)

  • AEDC 16-ft Supersonic Tunnel

    AEDC 16-ft Supersonic Tunnel

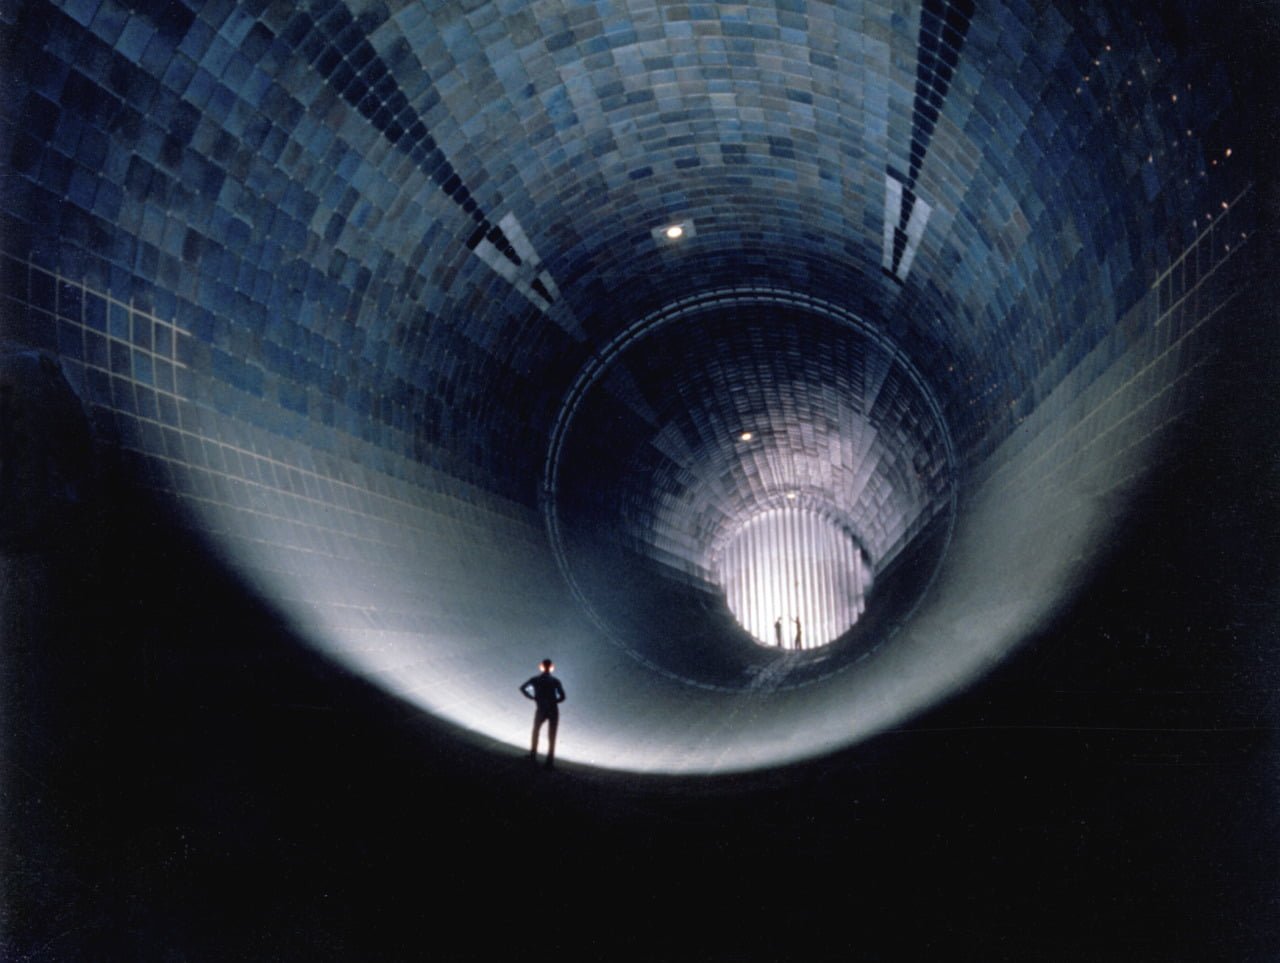
    This 1960 photo shows three men standing inside Arnold Engineering Development Complex’s 16-ft supersonic wind tunnel facility. The wind tunnel was capable of Mach numbers between 1.60 and 4.75 through a test section 4.8 meters wide and 20.2 meters long. It served as a large-scale testing facility for aircraft and propulsion systems. Like many large-scale and high-speed wind tunnel facilities in the United States, it is no longer active. In recent years, many unique wind tunnel facilities at NASA, military bases, and universities have been closed down, depriving researchers and engineers of the ability to include large-scale testing in their design and development of new technologies. These facility closures leave a substantial gap between the speeds and Reynolds numbers achievable in small-scale experiments and computational fluid dynamics and those experienced in flight. (Photo credit: P. Tarver)

  • Featured Video Play Icon

    Wind Tunnel Testing

    Wind tunnel testing is an important step in designing new aircraft. This video shows footage of visualization tests of the 21-ft wingspan Boeing X-48C model in NASA Langley’s Full-Scale Tunnel. The X-48C is a blended wing body design capable of higher lift-to-drag ratios than conventional aircraft, which should lead to a higher range and greater fuel economy. The video shows some smoke visualization that illustrates airflow around the airfoil-shaped craft. The long probe sticking forward from the starboard wing is used to measure air pressure, angle of attack, and sideslip angle of the model. Notice how smoke from the wand is pulled from below the leading edge of the wing up and over the top of the wing. This is because there is lower pressure over the top of the wing than the bottom, and, like an electrical charge seeking the path of least resistance, fluids flow preferentially toward lower pressures. (Video credit: NASA Langley)

  • Featured Video Play Icon

    Ski Jumping Aerodynamics

    Last summer we featured fluid dynamics in the Summer Olympics and there’s more to come for Sochi. Winter athletes like ski jumper Sarah Hendrickson are hard at work preparing, which can include time in wind tunnels, as shown here. There are two main diagnostics in tests like these: drag measurements and smoke visualization. The board Hendrickson stands on is connected to the tunnel’s force balance, which allows engineers to measure the differences in drag on her as she adjusts equipment and positions. This gives a macroscopic measure of drag reduction, and reduced drag makes the skier faster on the snow and lets her fly longer in the jump. The smoke wand provides a way to visualize local flow conditions to ensure flow remains attached around the athlete, which also reduces drag.  (Video credit: Red Bull/Outside Magazine; submitted by @YvesDubief)

  • Fluids Round-up – 25 May 2013

    Fluids Round-up – 25 May 2013

    Sometimes I come across cool links and stories about fluid dynamics that don’t quite fit into a typical FYFD post, but I’d like to start sharing those semi-regularly with round-up posts. Here’s some fun stuff I’ve seen lately:

    And, yes, that last Specialized video chat includes an FYFD shout-out about 49 minutes in. 🙂

    (Photo credit: Specialized)

  • Featured Video Play Icon

    Hummingbirds Singing with their Tail Feathers

    Aeroelastic flutter occurs when fluid mechanical forces and structural forces get coupled together, one feeding the other. Usually, we think of it as a destructive mechanism, but, for hummingbirds, it’s part of courtship. When a male hummingbird looks to attract a mate, he’ll climb and dive, flaring his tail feathers one or more times. As he does so, air flow over the feathers causes them to vibrate and produce noise. Researchers studied such tail feathers in a wind tunnel, finding a variety of vibrational behaviors, including a tendency for constructive interference–in other words two feathers vibrating in proximity is much louder than either individually. For more, check out the original Science article or the write-up at phys.org. (Video credit: C. Clark et al.)

  • Supersonic Oil Flow Viz

    Supersonic Oil Flow Viz

    This image shows oil-flow visualization of a cylindrical roughness element on a flat plate in supersonic flow. The flow direction is from left to right. In this technique, a thin layer of high-viscosity oil is painted over the surface and dusted with green fluorescent powder. Once the supersonic tunnel is started, the model gets injected in the flow for a few seconds, then retracted. After the run, ultraviolet lighting illuminates the fluorescent powder, allowing researchers to see how air flowed over the surface. Image (a) shows the flat plate without roughness; there is relatively little variation in the oil distribution. Image (b) includes a 1-mm high, 4-mm wide cylinder. Note bow-shaped disruption upstream of the roughness and the lines of alternating light and dark areas that wrap around the roughness and stretch downstream. These lines form where oil has been moved from one region and concentrated in another, usually due to vortices in the roughness wake. Image © shows the same behavior amplified yet further by the 4-mm high, 4-mm wide cylinder that sticks up well beyond the edge of the boundary layer. Such images, combined with other methods of flow visualization, help scientists piece together the structures that form due to surface roughness and how these affect downstream flow on vehicles like the Orion capsule during atmospheric re-entry. (Photo credit: P. Danehy et al./NASA Langley #)

  • Fluorescing Shock Waves

    Fluorescing Shock Waves

    Wind tunnel testing plays a major role in the planning of many space missions. Here a model of the Mars Sample Return Orbiter is tested at Mach 10 to determine the heat shield’s response to aerobraking off Mars’ atmosphere. The colors are the result of electron beam fluorescence, in which an electron gun is used to ionize molecules in the flow, which causes them to emit photons (light). The technique can be used for flow visualization–as in the case of the shock waves shown here–or to measure flow characteristics like density, temperature, and velocity. (Photo credit: Thierry Pot/DAFE/ONERA)

  • Martian Landing Physics

    Martian Landing Physics

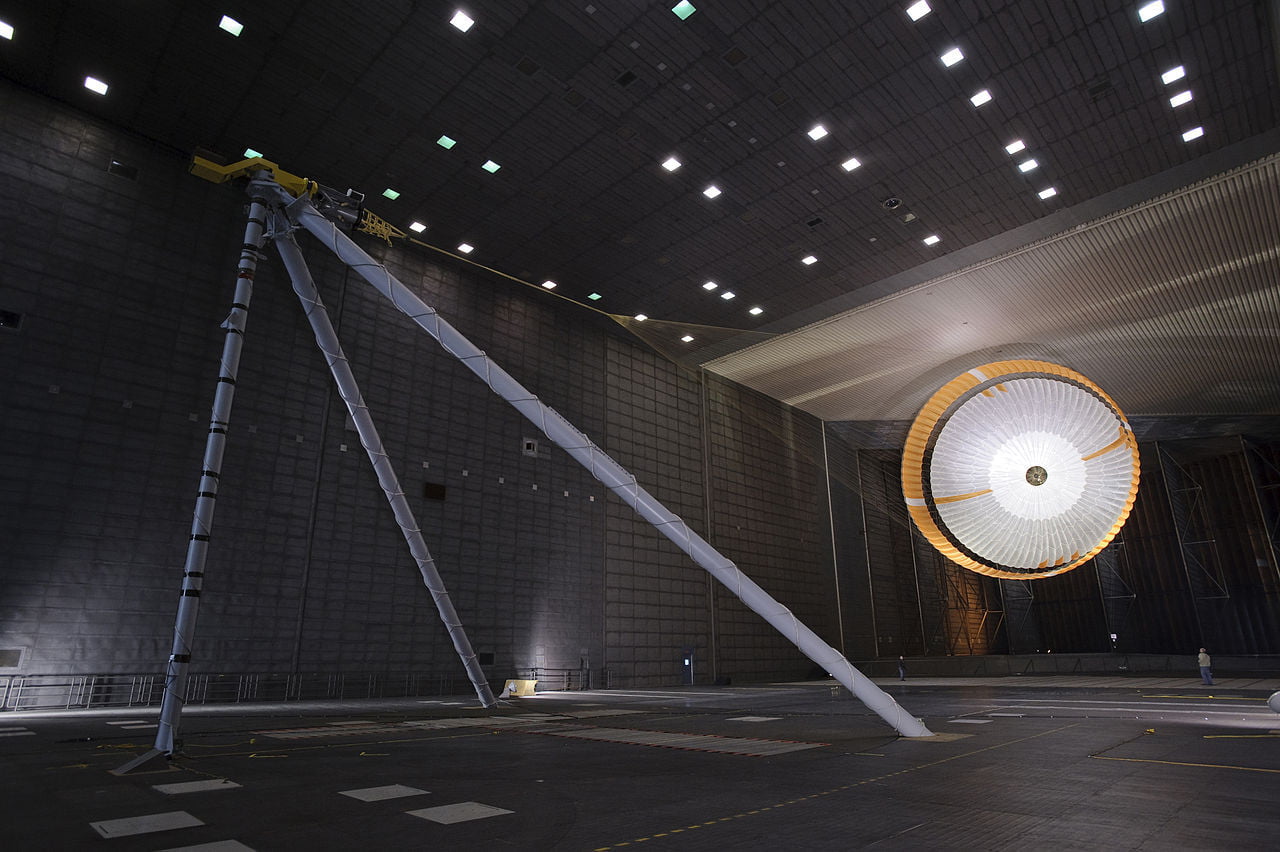
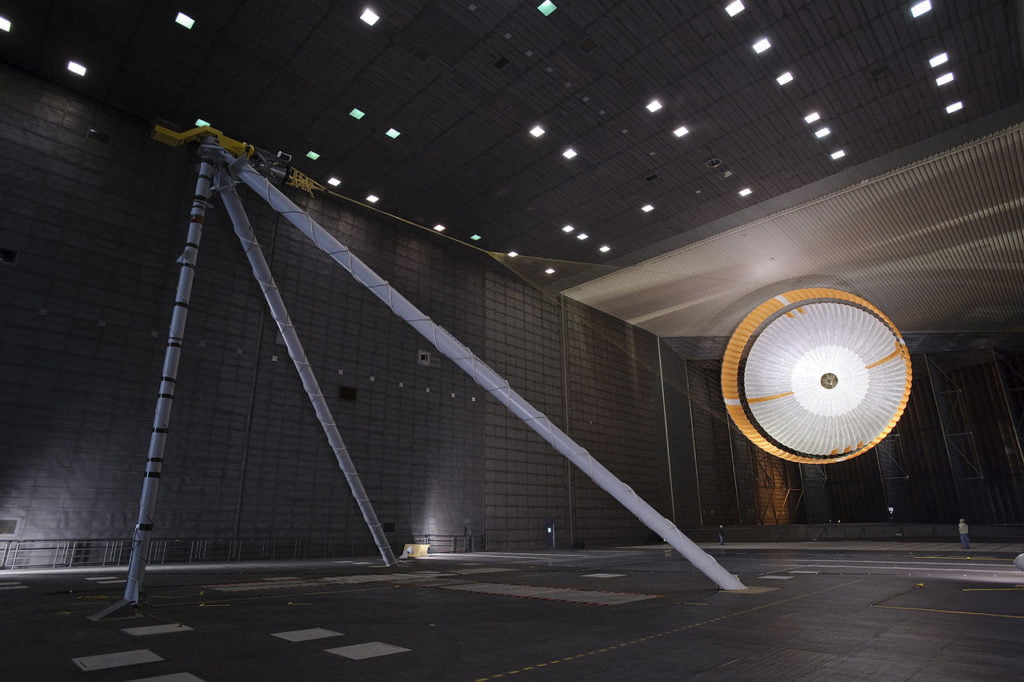
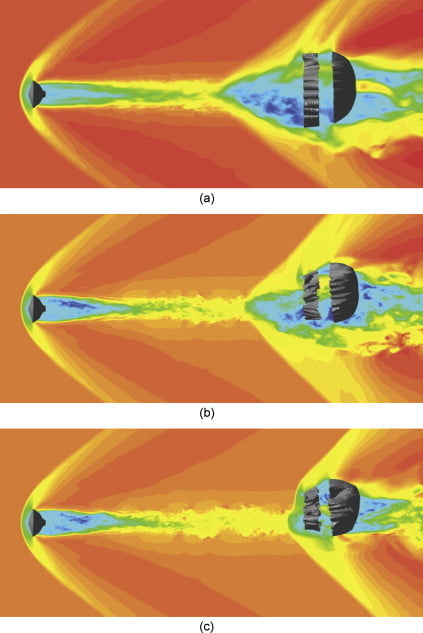
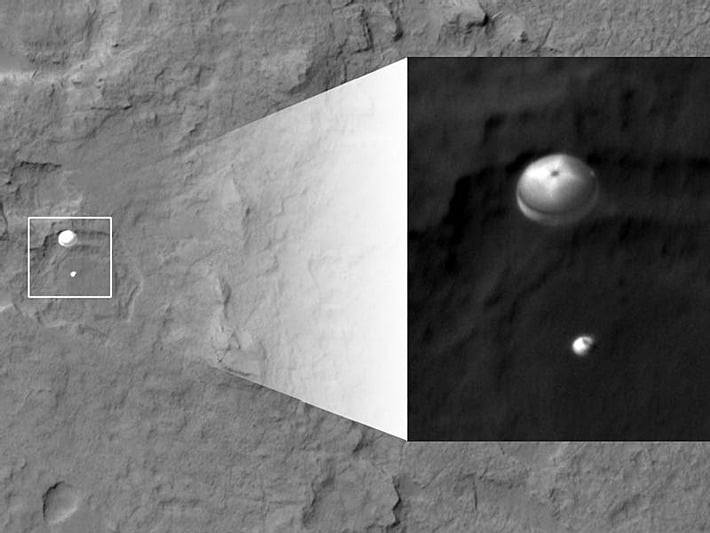
    A little over a week ago, NASA’s Curiosity rover landed on Mars, the culmination of years of engineering. The mission’s landing, in particular, was the subject of intense scrutiny as Curiosity’s size necessitated some new techniques in the final segments of the landing sequence. As it hit the Martian atmosphere at 13,000 mph, the compression of the carbon dioxide behind the capsule’s shock wave slowed the descent.  At roughly 1,000 mph–speeds still large enough to be supersonic–Curiosity deployed its parachute. Shown above are the parachute in numerical simulation (from Karagiozis et al. 2011), wind tunnel testing at NASA Ames, and during descent thanks to the Mars Reconnaissance Orbiter. The simulation shows contours of streamwise velocity at different configurations; note the bow shock off the capsule and the additional shocks off the parachute. These help generate the drag needed to slow the capsule. For an interesting behind-the-scenes look at the wind tunnel testing for Curiosity’s parachute check out JPL’s fourpart video series. Congratulations to all the scientists and engineers who’ve made the rover a success. We look forward to your discoveries! (Photo credits: K. Karagiozis et al., NASA JPL, NASA MRO)