
Pre-dawn launches provide some of the most dramatic rocket footage. This video is from an October 2nd Atlas V launch, and the really fun stuff starts at about 0:34. As the rocket climbs to higher altitudes, the atmospheric pressure around it decreases. As a result of this low pressure, the rocket’s exhaust gases balloon outward in a giant plume many times larger than the rocket. This happens in every launch, but it’s visible here because the rocket is at such a high altitude that its exhaust is being lit by sunlight while the observers on the ground are still in the dark. The ice crystals in the exhaust–much of the rocket’s exhaust is water vapor–reflect sunlight down to the earth. Around 0:47, a cascade of shock waves ripples through the plume just before the first-stage’s main engine cuts off. Once the engine stops firing, there’s no more exhaust and the plume ends. (Video credit: Tampa Bay Fox 13 News; submitted by Kyle C)
Tag: physics

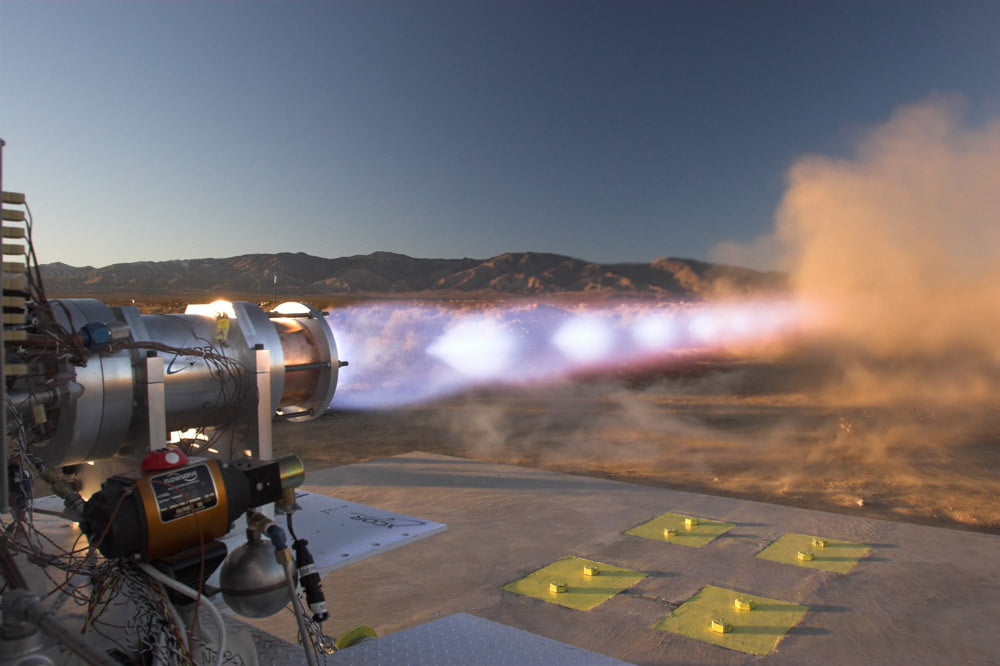
Shock Diamonds
Rocket engine exhaust often contains a distinctive pattern known as shock diamonds or Mach diamonds. These are a series of shock waves and expansion fans that increase and decrease, respectively, the supersonic exhaust gases’ pressure until it equalizes with atmospheric pressure. The bright glowing spots visible to the naked eye are caused by excess fuel in the exhaust igniting. As awesome as shock diamonds look, they’re actually an indication of inefficiencies in the rocket: first, because the exhaust is over- or underexpanded, and second, because combustion inside the engine is incomplete. Both factors reduce a rocket engine’s efficiency (and both are, to some extent, inescapable). (Photo credit: XCOR)

Un-Mixing a Flow
This video demonstrates one of my favorite effects: the reversibility of laminar flow. Intuition tells us that un-mixing two fluids is impossible, and, under most circumstances, that is true. But for very low Reynolds numbers, viscosity dominates the flow, and fluid particles will move due to only two effects: molecular diffusion and momentum diffusion. Molecular diffusion is an entirely random process, but it is also very slow. Momentum diffusion is the motion caused by the spinning inner cylinder dragging fluid with it. That motion, unlike most fluid motion, is exactly reversible, meaning that spinning the cylinder in reverse returns the dye to its original location (plus or minus the fuzziness caused by molecular diffusion).
Aside from being a neat demo, this illustrates one of the challenges faced by microscopic swimmers. In order to move through a viscous fluid, they must swim asymmetrically because exactly reversing their stroke will only move the fluid around them back to is original position. (Video credit: Univ. of New Mexico Physic and Astronomy)

Flowing Water on Mars?


Scientists have known for years that Mars once had liquid water on its surface, and they have many contemporary examples of frozen water ice on the Red Planet. But this week NASA announced the strongest evidence yet that liquid water still flows on Mars. Researchers have observed from orbit dark line-like features called recurring slope lineae (RSL) that develop, darken, and grow seasonally in many locations on Mars. The appearance of these features coincides with warmer surface temperatures (above -23 degrees Celsius), and the lines fade again when temperatures cool. Although scientists suspected the dark lines might be related to flowing water, the evidence remained circumstantial until spectral observations of multiple sites indicated that the darker features contained hydrated salts. In other words, briny salt water is still flowing at or near the Martian surface. (Image credits: NASA)

Healing Soap Films
As fragile as a soap bubble seems, these films have remarkable powers of self-healing. The animation above shows a falling water droplet passing through a soap film without bursting it. An important factor here is that the water droplet is wet–passing a dry object through a soap film is a quick way to burst it, as those who have played with bubbles know. The droplet’s inertia deforms the soap film, creating a cavity. If the drop’s momentum were smaller, the film could actually bounce the droplet back like a trampoline, but here the droplet wins out. The film breaks enough to let the drop through, but its cavity quickly pinches off and the film heals thanks to the stabilizing effect of its soapy surfactants. (Image credit: H. Kim, source)

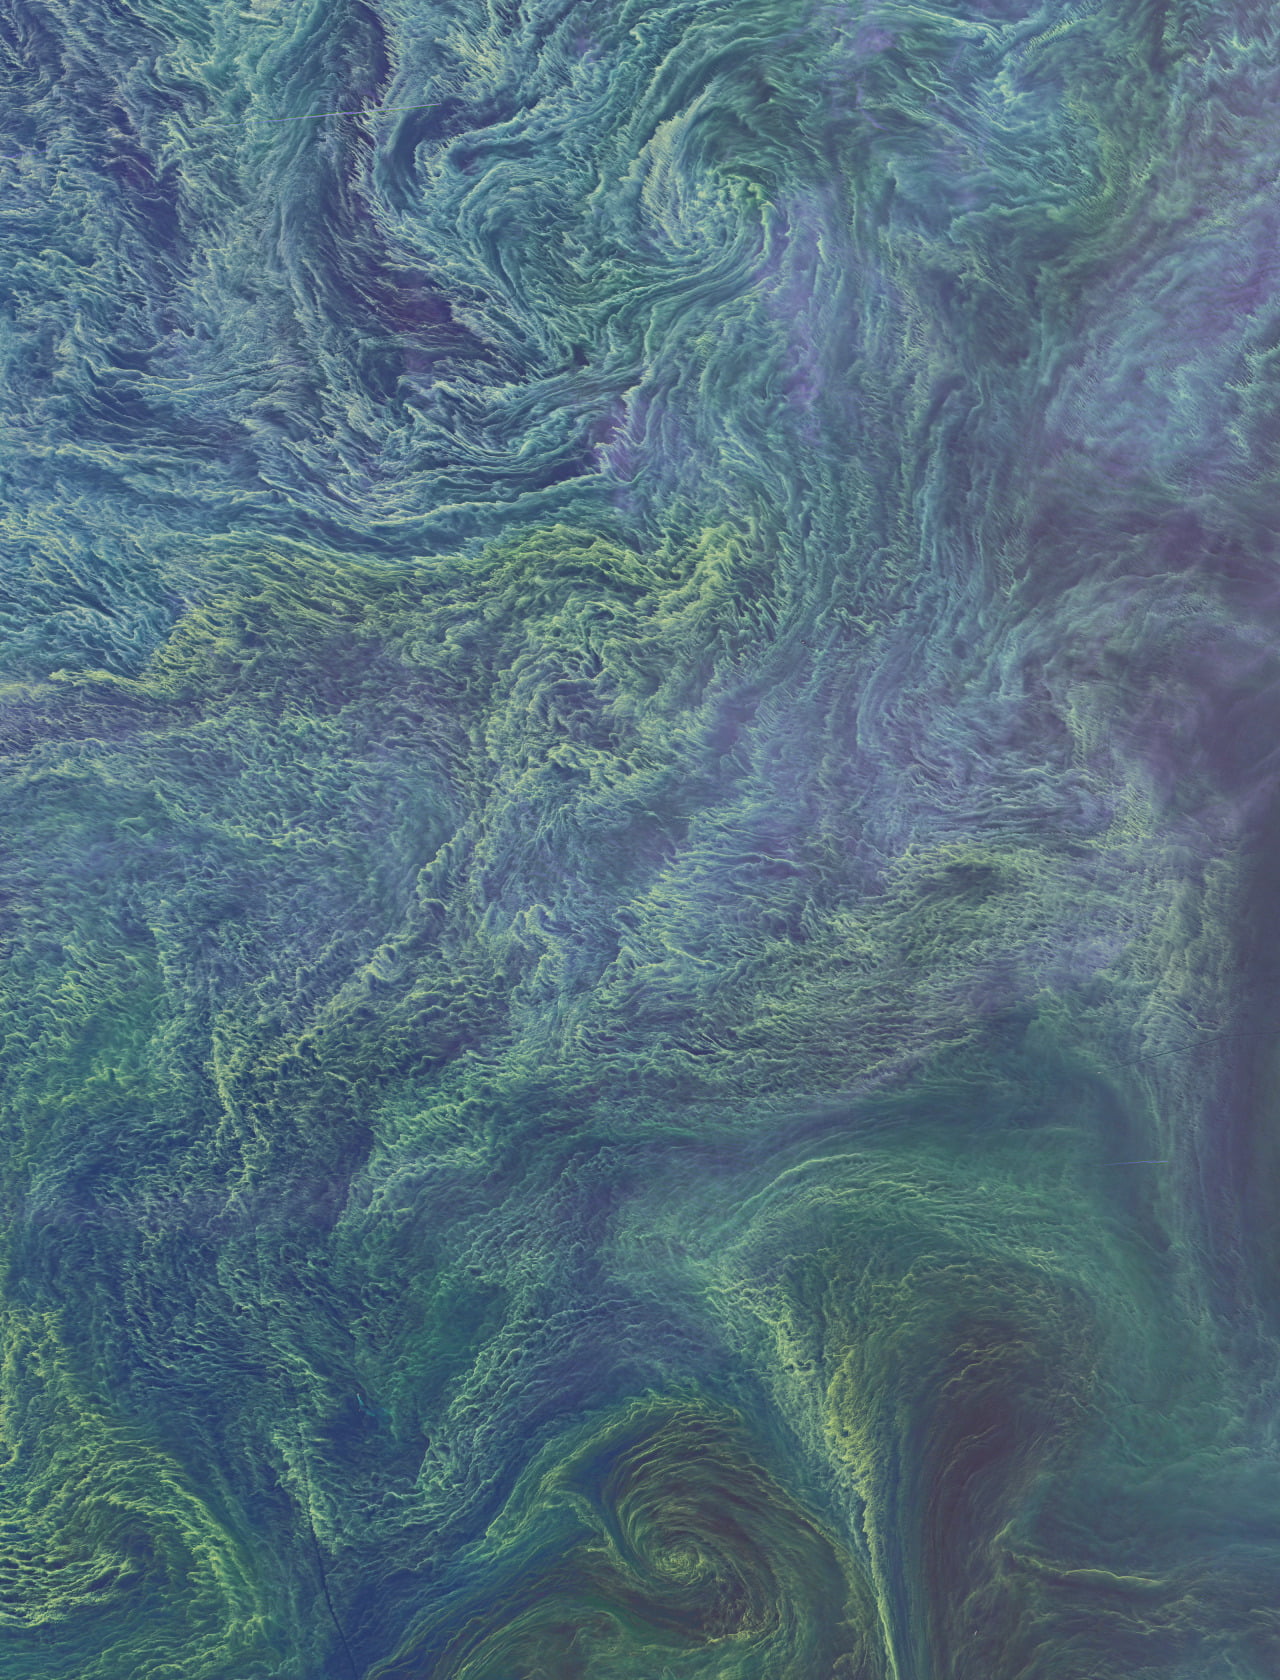
Phytoplankton Bloom
This incredible false-color satellite image shows a cyanobacteria phytoplankton bloom in the Baltic Sea. The image is roughly 900 km across and is beautifully detailed. Check out the full resolution version. The tiny phytoplankton act like tracer particles in the flow, sketching out the massive whorls as well as the tiny lacy wisps that make up the turbulent sea. Beautiful as they appear from orbit, such massive blooms can be dangerous to animal life, depriving large areas of the oxygen other animals need to survive. In recent years more and more large phytoplankton blooms are happening around the world as agricultural and industrial run-off supply waters with excess nitrogen and other nutrients favored by the phytoplankton. (Image credit: NASA Earth Observatory)
Sandscapes
Many of us have played with sand art–the rotating frames filled with water, sand, and air. In this video, Shanks FX demonstrates some of the realistic and surrealistic landscapes you can create using this toy. It also makes for a neat fluid dynamics demonstration. The buoyancy of the trapped air bubbles lets the sand sift slowly down instead of falling immediately. And the sand descends in a variety of ways–sometimes laminar columns and other times wilder turbulent plumes. (Video credit and submission: Shanks FX/PBS Digital Studios)

Self-Pouring Fluids
Non-Newtonian fluids are capable of all kinds of counter-intuitive behaviors. The animations above demonstrate one of them: the tubeless or open siphon. Once the effect is triggered by removing some of the liquid, the fluid quickly pours itself out of the beaker. This is possible thanks to the polymers in the liquid. The falling liquid pulls on the fluid left behind in the beaker, which stretches the polymers in the fluid. When stretched, the polymers provide internal tension that opposes the extensional force being applied. This keeps the fluid in the beaker from simply detaching from the falling liquid. Instead, it flows up and over the side against the force of gravity, behaving rather more like a chain than a fluid! (Image credit: Ewoldt Research Group, source)
Miniature Bursting Bubbles
Fizzy drinks like soda or champagne contain dissolved carbon dioxide which forms bubbles when the pressure inside its container is released. The tiny bubbles rise to the surface where the liquid film covering them can rupture, creating a small cavity at the surface. The cavity collapses in a matter of milliseconds (bottom animation). Above the surface, the cavity reverses its curvature to create a liquid jet (top animation) which can expel multiple tiny droplets. These droplets can tickle a drinker who hovers too close, but they also carry and distribute the aroma molecules that are part of the experience of a drink like champagne. (Image credit: E. Ghabache et al., source)
(Today’s topic brought to you by my impending nuptials to my favorite physicist/spacecraft engineer.)
The Inverted Glass Harp
You may be familiar with the glass harp, the instrument created by rubbing the rim of a partially-filled wine glass. But did you know that you can create the same effect by immersing an empty glass in water? In this video, Dan Quinn explains the physics behind both types of glass harps and why the pitch changes as you add or remove water. Vibration is the driving factor (as with most sound), and the key to the shifting pitches has to do with the change in mass of the material being vibrated. For more great physics, also be sure to check out Quinn’s previous video on tears of wine. (Video credit: D. Quinn)
