
One of the challenges in large-scale wind energy is that operating wind turbines do not behave exactly as predicted by simulation or wind tunnel experiments. To determine where our models and small-scale experiments are lacking, it’s useful to make measurements using a full-scale working turbine, but making quantitative measurements in such a large-scale, uncontrolled environment is very difficult. Here researchers have used natural snowfall as seeding particles for flow visualization. The regular gaps in the flow are vortices shed from the tip of the passing turbine blades. With a searchlight illuminating a 36 m x 36 m slice of the flow behind a wind turbine, the engineers performed particle image velocimetry, obtaining velocity measurements in that region that could then be correlated to the wind turbine’s power output. Such in situ measurements will help researchers improve wind turbine performance. (Video credit: J. Hong et al.)
Tag: particle image velocimetry

Reader Question: Does Flow Viz Alter Flow?
") gorbax asks:
gorbax asks: I’ve been wondering for a while, actually, how do we know when the method of flow visualization doesn’t actually alter the flow of a fluid itself?
This is a great question and one that fluid dynamicists have to deal with all the time. Ideally, we’d love to measure everything we want from a flow at all points at all times without doing anything to affect it. In reality, however, that just doesn’t happen. Some measurement techniques are less intrusive than others, but just about everything risks having some effect. This raises two questions: 1) How small can we make that effect? and 2) Do we even care if we’re affecting the flow?
With regards to the first, the onus is typically on the experimentalist to show that whatever visualization technique he/she uses is not significantly affecting the flow. For something like particle image velocimetry, which requires seeding the flow with particles, this means selecting particles that follow the flow rather than changing it and considering carefully how and where to seed the flow such that any added vorticity from the injection does not alter the flow significantly. Checking for this can be done many ways, for example with comparisons to other measurement techniques (with and without seeding) or by comparing to simulation.
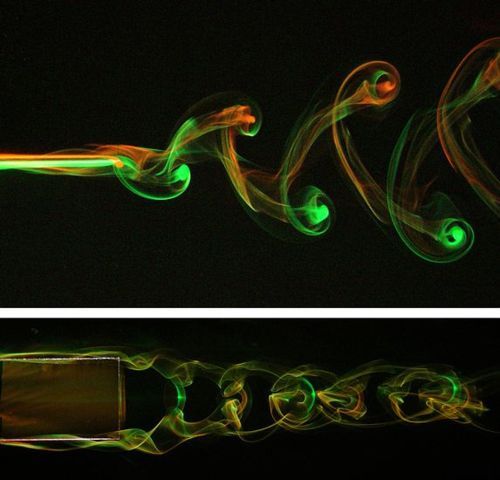
The second question–do we care?–is also a significant consideration. Because the purpose of flow visualization is often to get a qualitative feel for the flow field rather than quantitative information, it is often not a significant concern if there is some slight effect from the visualization technique. This can often be the case with smoke-wire and dye visualizations where we just want to see what’s going on.
Finally, there are some instances of flow visualization which are completely unobtrusive to the flow. Schlieren photography and infrared thermography are two examples. Both are optical techniques that act from a distance and take advantage of extant flow properties to make certain features visible. The real key is knowing what technique(s) will work for the flow you have and will give you the information you want. After that, it’s all about proper and thorough execution. (Photo credits: N. Vandenberge et al., T. Omer, M. Canals, P. Danehy et al., A. Wilkens et al., W. Saric et al.)

Reader Question: How Useful is Flow Viz?


Reader Andrew asks:
I’ve noticed you’ve posted a bunch of flow visualization/wind tunnel content. I’m just curious where how useful information is obtained from these. Is it just observation? Or are there instruments that are usually used in conjunction with these techniques to provide data?
Great question, Andrew! The answer can vary based on the technique and application. In some cases, flow visualization is used for purely qualitative observation, but in others it can provide more quantifiable data. For example, the water tunnel flow visualization of Google’s heliostat array gave very qualitative data about flow around a given configuration but allowed quick evaluation of many configurations. Flow visualization can also help identify key features for additional study like vortices in a wake. This identification of structure can be so useful that even in computational fluid dynamics, where researchers have all possible information about pressure, temperature, and velocity in a flow field, flow visualization is regularly used to identify underlying structures.
Some flow visualization methods can also give very specific information. Oil-flow visualization gives a snapshot of shear stress at the surface of an object, letting an engineer identify at a glance areas of laminar and turbulent flow as well as regions with vortices and streaks. Naphthalene flow visualization and infrared thermography are both great for identifying the location of laminar-turbulent transition and can do so across the span of an object, which is much easier than trying to traverse a probe across the entire object. And some forms of flow visualization allow for extraction of velocity field information, as in particle image velocimetry. In this technique, tiny particles seed the flow and carefully timed image pairs are taken and correlated to determine the flow field velocity based on the changes in particle positions between images.
Like every measurement, flow visualization methods have their strengths and limitations. But for many applications, flow visualization provides much more than just pretty pictures and thus remains an important tool in any fluid dynamicist’s arsenal!

How Maple Seeds Fly
Maple tree seeds flutter and spin as they descend. The above video, which shows flow visualization of a freely falling seed, demonstrates that the so-called helicopter seed’s autorotation creates a vortex along the leading edge. Watch as the seed’s “wing” sweeps through and you will notice the vortex along the upper surface. This leading edge vortex generates high lift on the maple seed, allowing it to stay in the air more effectively than other seeds, thereby increasing the maple’s reproductive range. (Video credit: D. Lentink et al.; see also Supplemental Materials)
Particle Image Velocimetry
One common experimental technique for measuring velocity in a flow is particle image velocimetry (PIV), shown above. Special particles are introduced–seeded–into the flow. Typically, these particles are small, neutrally buoyant, and have a refractive index significantly different from the background flow. One or more lasers are used to illuminate a section of the flow–a plane for 2D measurements or a cube for 3D. Rather than operating continuously, the laser is pulsed, producing very short exposure times of the order of hundreds of nanoseconds. A camera (or more than one camera for 3D measurements) captures a pair of images separated by this short exposure. The time between frames is so small that the particles will not have moved much between frames. Researchers can then correlate the two frames and derive velocity data from the motion of the particles.
Flow Visualization
[original media no longer available]
This video gives a neat introduction to some common and uncommon techniques used to visualize fluid flows.

")
")
")
")
 and schlieren photograph (right) of a droplet impact (from A. Wilkens et al.)") gorbax
gorbax