Tag: melting

  • Tracking Ice Floes

    Tracking Ice Floes

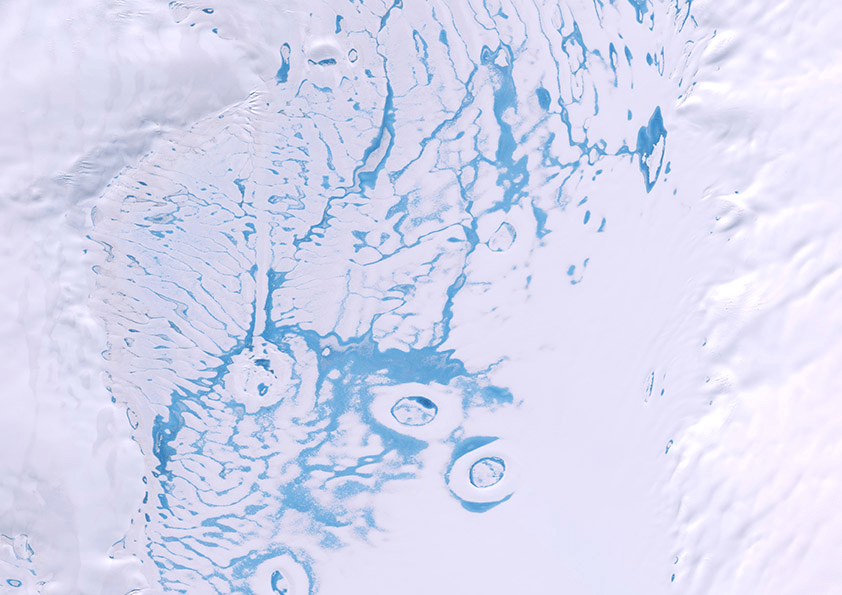
    To understand why some sea ice melts and other sea ice survives, researchers tracked millions of floes over decades. This herculean undertaking combined satellite data, weather reports, and buoy data into a database covering nearly 20 years of data. With all of that information, the team could track the changes to specific pieces of ice rather than lumping data into overall averages.

    They found that an ice floe’s fate depended strongly on the route it took: ice that slipped from its starting region into warmer, more southern regions was likely to melt. They also saw region-specific effects, like that thick sea ice was more likely to melt in the East Siberian Sea’s summer, possibly due to warmer currents. The comprehensive, fine-grained analyses possible with this ice-tracking technique offer a chance to understand why some Arctic regions are more vulnerable to warming than others. (Image credit: D. Cantelli; research credit: P. Taylor et al.; via Eos)

  • Slushy Snow Affects Antarctic Ice Melt

    Slushy Snow Affects Antarctic Ice Melt

    More than a tenth of Antarctica’s ice projects out over the sea; this ice shelf preserves glacial ice that would otherwise fall into the Southern Ocean and raise global sea levels. But austral summers eat away at the ice, leaving meltwater collected in ponds (visible above in bright blue) and in harder-to-spot slush. Researchers taught a machine-learning algorithm to identify slush and ponds in satellite images, then used the algorithm to analyze nine years’ worth of imagery.

    The group found that slush makes up about 57% of the overall meltwater. It is also darker than pure snow, absorbing more sunlight and leading to more melting. Many climate models currently neglect slush, and the authors warn that, without it, models will underestimate how much the ice is melting and predict that the ice is more stable than it truly is. (Image credit: Copernicus Sentinel/R. Dell; research credit: R. Dell et al.; via Physics Today)

  • Flipping Ice

    Flipping Ice

    In nature ice is ever-changing — growing, shrinking, and shifting. This poster illustrates that with a cylinder of ice floating in room temperature water. As the ice melts, it flips over into a new orientation, stays that way for a time, and then shifts again, as seen in the series of blue images. This flipping results from the melting flows around the ice, illustrated in the colorful central photo. This color schlieren image shows dense plumes of cold meltwater sinking beneath the ice. As that cold water drips down the sides of the ice, it leaves behind a wavy, patterned surface. Eventually, melting from the bottom of the ice leaves the remaining ice top-heavy, which triggers a flip into a more stable orientation. (Image and research credit: B. Johnson et al.)

  • Melting Ice Cap

    Melting Ice Cap

    This award-winning photo by Thomas Vijayan shows waterfalls of ice melt off the Austfonna ice cap. The third-largest glacier in Europe, Austfonna is located in Norway’s Svalbard archipelago. Like other glaciers, it sees rising temperatures and increased melting due to climate change. Vijayan highlights that melting with his focus on the many waterfalls slicing through the ice. All that meltwater contributes to changes in local salinity as well as rising sea levels worldwide. (Image credit: T. Vijayan; via Nature TTL POTY)

  • Icelandic Glacial Caves

    Icelandic Glacial Caves

    Expedition guide and photographer Ryan Newburn captures the ephemeral beauty of the glacial caves he explores in Iceland. These caves are in constant flux, thanks to the run and melt of water. The scalloped walls are a sign of this process of melting and dissolution. The icicles, too, hint at ongoing melting and refreezing. Caves can appear and disappear rapidly; they’re a dangerous environ, but Newburn freezes them in time, letting the rest of us experience a piece of their majesty. See more of his images on his Instagram. (Image credit: R. Newburn; via Colossal)

  • Featured Video Play Icon

    “Eternal Spring”

    With every spring comes the thaw. Warming temperatures melt winter’s ice, carving it away to reveal the surfaces beneath. Christopher Dormoy’s macroscale timelapse “Eternal Spring” captures this dynamic, showing the process drop-by-drop and rivulet-by-rivulet. It’s also a commentary on melting in general as human-driven climate change chips away at ice that formed over millennia. (Video and image credit: C. Dormoy)

  • Summer Melt

    Summer Melt

    A warm summer in 2022 has resulted in record melting on Svalbard. Located halfway between the Norwegian mainland and the North Pole, more than half of Svalbard is normally covered in ice. But with glaciers in retreat and firn — a surface layer of compressed porous snow — melting, pale blue ice is getting direct exposure to the sun and warm air temperatures. The result has been melting 3.5 times larger than the average melt between 1981 and 2010. Look closely and you’ll find deep blue meltwater ponds dotting the ice, too. The run-off of meltwater has likely carried extra sediment into the surrounding waters, accounting for some of the paler water colors along the coast. (Image credit: J. Stevens/USGS; via NASA Earth Observatory)

  • Leidenfrost On Ice

    Leidenfrost On Ice

    We’ve seen many forms of Leidenfrost effect — that wild, near-frictionless glide that liquid droplets make on a very hot surface — over the years, but here’s a new one: the three-phase Leidenfrost effect. Researchers found that they could generate a Leidenfrost effect using an ice disk placed on an extremely hot surface. During the effect, the ice and its melting layer of water glide on vapor, hence the name.

    The team found that getting a three-phase Leidenfrost effect requires a much, much higher temperature than the regular Leidenfrost effect. Water will get its glide on at 150 degrees Celsius. Getting ice to glide on the same surface required a stunning 550 degrees Celsius! Why the big difference? The challenge is that water layer, which, by definition, has a 100-degree difference between its boiling side and its frozen boundary. It takes so much heat to maintain that layer that there’s little energy left over for evaporation; that’s why it takes so much more energy to get the three-phase Leidenfrost effect. (Image and research credit: M. Edalatpour et al.; via Ars Technica; submitted by Kam-Yung Soh)

  • Mushy Layers

    Mushy Layers

    In many geophysical and metallurgical processes, there is a stage with a porous layer of liquid-infused solid known as a mushy layer. Such layers form in sea ice, in cooling metals, and even in the depths of our mantle. Within the mushy layer, temperature, density, and concentration can vary dramatically from one location to another.

    The image above shows a mushy layer made from a mixture of water and ammonium chloride. Above the mushy layer, green plumes drift upward, carrying lighter fluid. Look closely within the mushy layer and you’ll see narrow channels feeding up to the surface. These are known as chimneys. In sea ice, chimneys like these carry salty brine out of the ice and into the seawater, increasing its salinity. See this Physics Today article for more details on the dynamics of mushy layers. (Image credit: J. Kyselica; via Physics Today)

  • The Shapes of Melting Ice

    The Shapes of Melting Ice

    Water is an odd substance because it is densest at 4 degrees Celsius, well above its melting point at 0 degrees Celsius. This density anomaly means that melting ice takes on very different shapes, depending on the temperature of the water surrounding it. At low temperatures (under 4 degrees Celsius), the cold water melting off the ice is denser than the surroundings, so it sinks. The sinking fluid melts lower portions of the ice faster, leading to an inverted pinnacle (Image 1).

    In contrast, at higher temperatures (above 7 degrees Celsius), the meltwater is lighter than the surroundings and therefore rises, creating an upward-pointing pinnacle (Image 3). At intermediate temperatures, some areas of the ice see rising meltwater and some see sinking. This complicated flow pattern sets up vortices that result in a scalloped edge along the ice (Image 2). (Image and research credit: S. Weady et al.; via APS Physics)