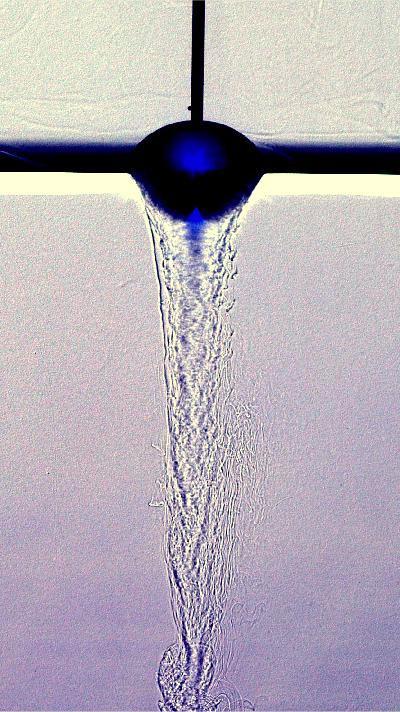
In sports, flocks of birds, and schools of fish, we’re accustomed to thinking that the followers get an aerodynamic or hydrodynamic advantage over the leaders, but this may not always be the case. Here are two flags placed one after another in a soap film flowing from top to bottom. The flags are passive, meaning that their motion is entirely dependent on the flow around them; they cannot exert any resistive force of their own. In this case, scientists observe an effect known as inverted drafting. The lead flag actually experiences less drag – by as much as 50% – than the following flag. This seems to be a result of flow around the second flag having an upstream influence on the motion of the first. (Image and research credit: L. Ristroph and J. Zhang, pdf)
Tag: flow visualization

How Cycling Position Affects Aerodynamics


New FYFD video! How much does a rider’s position on the bike affect the drag they experience? To find out I teamed up with folks from the University of Colorado at Boulder and at SimScale to explore this topic using high-speed video, flow visualization, and computational fluid dynamics.
Check out the full video below, and if you need some more cycling science before the Tour de France gets rolling, you can find some of my previous cycling-related posts here. (Image and video credit: N. Sharp; CFD simulation – A. Arafat)
ETA: Please note that the video contained in this post was sponsored by SimScale.

Watching Radiation
We’re used to radiation being invisible. With a Geiger counter, it gets turned into audible clicks. What you see above, though, is radiation’s effects made visible in a cloud chamber. In the center hangs a chunk of radioactive uranium, spitting out alpha and beta particles. The chamber also has a reservoir of alcohol and a floor cooled to -40 degrees Celsius. This generates a supersaturated cloud of alcohol vapor. When the uranium spits out a particle, it zips through the vapor, colliding with atoms and ionizing them. Those now-charged ions serve as nuclei for the vapor, which condenses into droplets that reveal the path of the particle. The characteristics of the trails are distinct to the type of decay particle that created them. In fact, both the positron and muon were first discovered in cloud chambers! (Image credit: Cloudylabs, source)

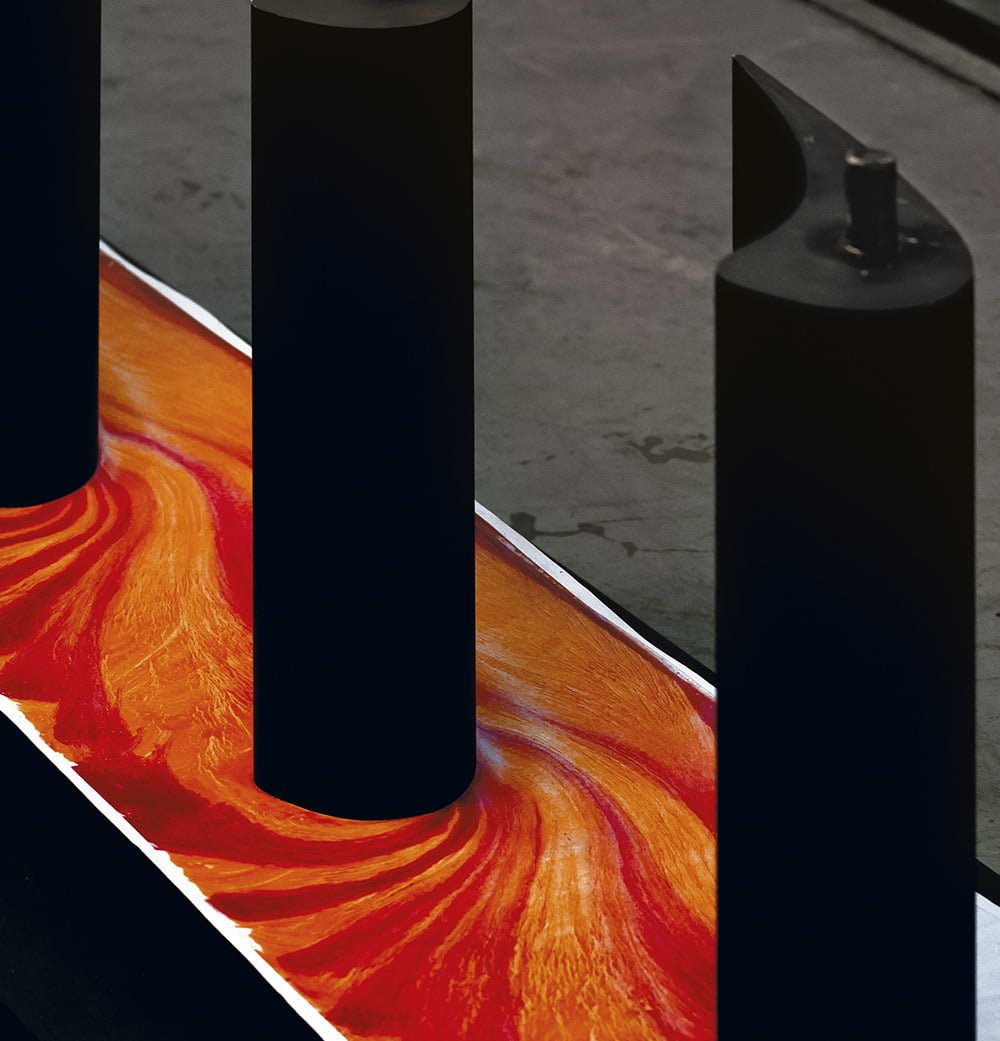
Flow in a Turbine
Fluid flows are complex, complicated, and ever-changing. Researchers use many techniques to visualize parts of a flow, which can help make what’s happening clearer. One technique, shown above, uses oil and dye to visualize flow at the surface. The vertical, black, airfoil-shaped pieces are stators, stationary parts within a turbine that help direct flow. After painting the stator mount surface with a uniform layer of oil, the model can be placed in a wind tunnel (or turbine) and exposed to flow. Air moving around the stators drags some of the oil with it, creating the darker and lighter streaks seen here. Notice how the lines of oil turn sharply around the front of the stator and bunch up near its widest point. Those crowded flow lines tell researchers that the air moves quickly around this corner. (Image credit: D. Klaubert et al., source)

Shadows of Flow
In the latest Veritasium video, Derek demonstrates how to see gas motions that are normally invisible using a schlieren photography set-up. Schlieren techniques have been important in fluid dynamics for well over a century, and Derek’s set-up is one of the two most common ways to set up the technique. (The other method uses two collimating mirrors instead of a single spherical or parabolic one.) As explained in the video, the schlieren optical set-up is sensitive to small changes in the refractive index, making density changes or differences in a gas visible. This makes it possible to distinguish gases of different temperatures or compositions and even lets you see shock waves in supersonic flows. (Video and image credit: Veritasium; submitted by Paul)


Reconnecting
Vortices are a common feature of many flows. Here we see a helical vortex tube spinning in a swirling flow. The vortex itself is visible thanks to air trapped in its low-pressure core. As the vortex spins, two sections of it come together. This results in what’s known as vortex reconnection: the vortex lines break apart and rejoin in a new configuration – as a small independent vortex ring and a shorter section of helical vortex. Events like this are common but usually hard to observe directly. They’ve been previously visualized using vortex knots and have even been sighted in the quantum vortices of superfluid helium. (Image credit: S. Skripkin, source; research credit: S. Alekseenko et al., pdf)

Sorting by Bubble

Microfluidic devices, also known as labs-on-a-chip, require clever techniques for processes like sorting particles by size. One such technique uses an oscillating bubble to sort particles. When the bubble vibrates back and forth (left) it creates what’s known as a streaming flow – large regions of recirculation (shown as gray ellipses in the right image). If the bubble is placed inside a channel, we say that two flows have been superposed; the device combines both the left-to-right flow of the channel and the recirculating streaming flow.
Introduce a micron-sized particle into this combined flow, and it will get carried to the bubble and then bounced around by its effects (left). In fact, the larger the particle is, the more the bubble deflects it relative to the flow. You can see this in the image on the right as well. Here the frame rate has been matched to the bubble’s vibration, so the bubble appears stationary, and the particle paths look smooth. The gray lines show the fluid’s path, and individual solid particles are introduced at the left. The largest particle gets strongly deflected as it passes the bubble and exits at the top-right. A fainter, smaller particle follows after it. Being smaller, the bubble’s deflection on it is weaker, and this second particle exits along a path to the center-right. The result is a fast and simple method for particle sorting. (Image and research credit: R. Thameem et al., source)

Eroding Candy


When you pop a hard candy in your mouth, you probably don’t give much thought to the fluid dynamics involved in dissolving it. The series above shows a hard candy suspended in water being slowly eaten away. As sugars in the candy dissolve into the water, the fluid becomes denser and falls away. This creates the downward flow visible in the center of the image. As sugar-laden water sinks, fresher water is pulled in alongside the walls of the candy. That flow helps erode the candy, creating a rougher surface. Since rough surfaces have a greater surface area exposed (than a smooth surface), they prompt further and faster dissolution. That strengthens the downward flow, pulls in more ambient water, and keeps the whole process going. (Image credit: M. Wykes)
Quad Copter Schlieren
Schlieren photography is a classic method of flow visualization that utilizes small variations in density (or temperature) to make otherwise unseen air motion visible. Because changing air’s density or temperature changes its index of refraction, variations in either quantity show up as dark and light regions. Here researchers use it to reveal some of the airflow around a small quadcopter, including the vortices that spiral off each propeller and help generate the lift necessary for take-off. The full video includes a couple of neat demos, including what happens when the blades are wet (shown below). In that case, the wingtip vortices are somewhat disrupted by strings of water droplets being flung off the blades by centrifugal force. Beautiful! (Video and image credit: K. Nolan et al., source; submitted by J. Stafford)


A Drip’s Vortex


Drip food coloring into water and you can often see a torus-shaped vortex ring after the drop’s impact. That vortex rings form during droplet impact has been well known for over a century, but only recently have we begun to understand the process that leads to that vortex ring. Part of the challenge is that the vortex formation is very small and very fast, but recent work with x-ray imaging has allowed experimentalists to finally capture this event.
When a drop impacts a pool, surface tension draws some of the pool liquid up the sides of the drop. At the same time, the impact causes ripple-like capillary waves down the sides of the drop. This causes pool liquid to penetrate sharply into the drop, triggering the spirals that mark the forming vortex ring. When drops impact with even higher momentum, multiple vortex spirals can form, as seen on the lower right image. The authors observed as many as four rings during an impact. For more, check out the (open access) article. (Image and research credit: J. Lee et al., source)