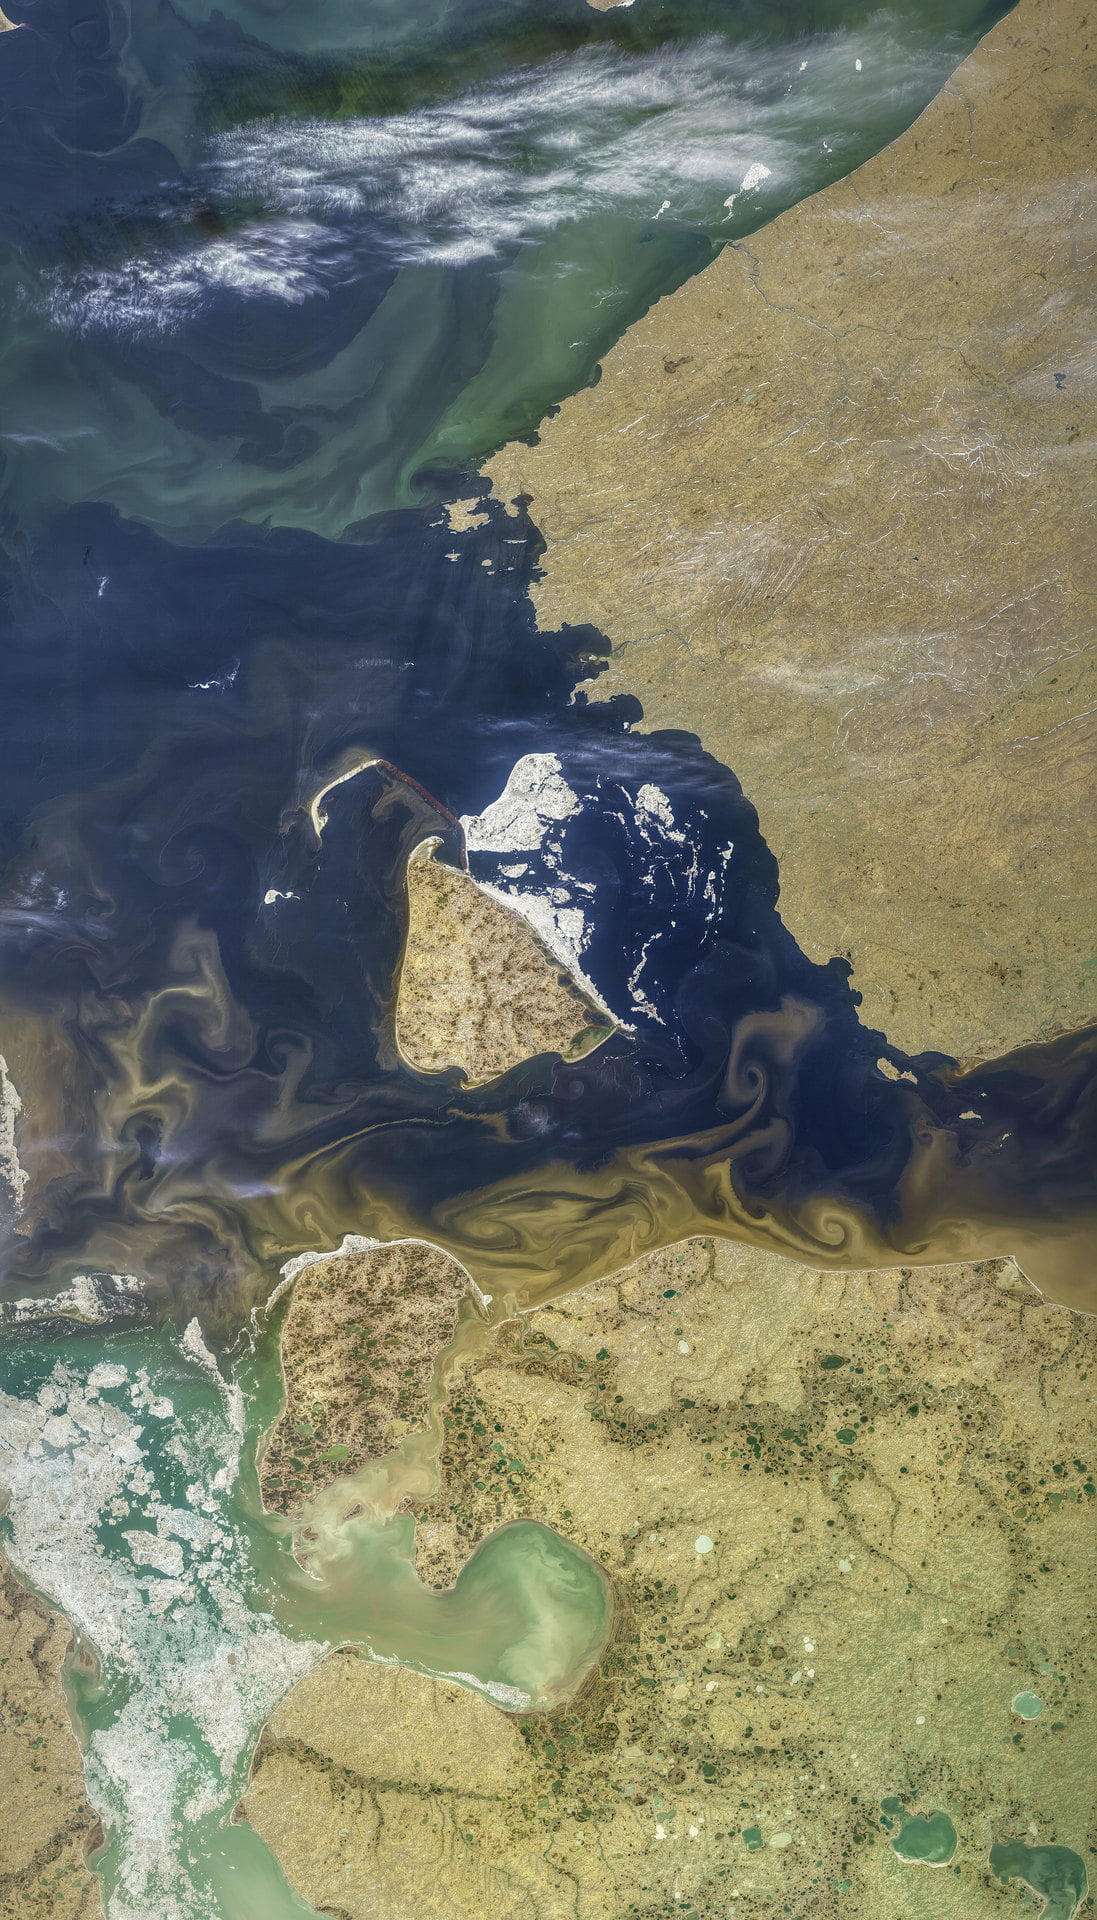
These colorful swirls show sediment and organic matter carried into the Arctic Ocean. Like dyes or tracer particles in a lab experiment, this run-off reveals the complicated patterns of mixing where freshwater and salt water mix. Delicate as they appear, these eddies are tens of kilometers across. Zoom in on the full resolution image to really appreciate the details, like the feathery edges between layers. (Image credit: N. Kuring; via NASA Earth Observatory)
Tag: flow visualization

Inside the Canopy


If you’ve ever gone into the woods on a windy day, you know that conditions there are drastically different than in the open. To blowing wind, trees of different sizes act like enormous roughness that disturbs the flow. Inside the canopy, flows can become incredibly complicated and many of the common techniques used by researchers no longer hold.
You can get a sense for this complexity with the second image above, which visualizes data from a wind tunnel experiment. The gray blocks represent roughness elements – the trees of this wind-tunnel-scale forest – and the large, blue arrow shows the direction of the flow. The thin colored lines show the paths taken by particles in the flow. The lines’ colors indicate what height the trajectory began at.
Notice how the blue and purple lines are relatively straight and oriented in the direction of the flow. This indicates that the flow here is relatively steady and uncomplicated. At the lower heights, though, especially in the green and yellow regions, the pathlines are far more twisted and complex. The flow here is turbulent, and the particles’ trajectories don’t necessarily correlate at all to the winds higher up. (Image credit: T. Japyassu and R. Shnapp et al.; research credit: R. Shnapp et al.; submitted by Ron S.)

Entraining Bubbles
If you stand on a bridge and watch the current flow past pylons below, you’ll see disturbances marking the wakes. Dragging a rod – or an oar – at a high enough speed through the water creates something similar: a wavy cavity in the fluid surface that surfs along behind the rod. The faster you pull the rod, the harder you’ll have to work, until that wake becomes so turbulent that it begins entraining air bubbles, like the tiny ones seen above. Once entrainment starts, the drag coefficient drops somewhat, presumably due to changes in the pressure distribution around the rod. The characteristics of air entrainment change with object size as well. Larger rods can entrain air through the cavity and not just in the wake. (Image and research credit: V. Ageorges et al.)

Dissolving Pills


This short film from Macro Room shows how pills dissolve in timelapse. Dissolution is a complex process driven both by flow and chemical concentration. Any small motion in the water helps erode the surface, and as the chemicals dissolve, the subsequent variations in the concentration drive additional flow. This is why we often see a turning point in how quickly the pills come apart. The initial breakdown is slow, but once enough of the pill dissolves, it enhances the surrounding flow, which increases erosion. Notice how many of the pills – liquid-filled capsules, especially – have a point where fluid begins streaming away from them. Unlike the capsules, the solid pills seem to get an extra boost from bubbles that form and then pull away material. (Image and video credit: Macro Room; submitted by clogwog)

Jets from Lasers
Laser-induced forward transfer (LIFT) is an industrial printing technique where a laser pulse aimed at a thin layer of ink creates a tiny jet that deposits the ink on a surface. In practice, the technique is plagued with reproducibility issues, in part because it’s difficult to produce only a single cavitation bubble when aiming a laser at the liquid layer. This is what we see above.
The laser pulse creates its initial bubble just above the middle of the liquid layer. Shock waves expand from that first bubble and quickly reflect off the liquid surface (top) and wall (bottom). When reflected, the shock waves become rarefaction waves, which reduce the pressure rather than increasing it. This helps trigger the clouds of tiny bubbles we see above and below the main bubble.
The effect is worst along the path of the laser pulse because that part of the liquid has been weakened by pre-heating, but impurities and dissolved gases in the liquid layer are also prone to bubble formation, as seen far from the bubble. The trouble with all these unintended bubbles is that they can easily rise to the surface, burst, and cause additional jets of ink that splatter where users don’t intend. (Image and research credit: M. Jalaal et al.; submitted by Maziyar J.)

Phytoplankton Swirls
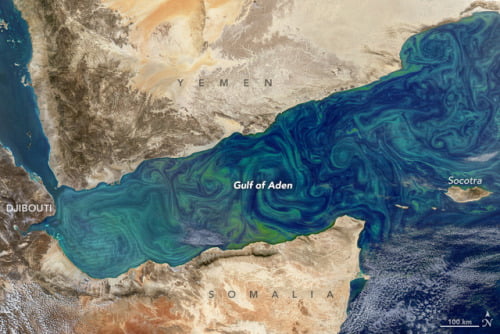
A winter bloom of phytoplankton appears as green and teal swirls in this false-color satellite image of the Gulf of Aden. Although phytoplankton can be an important food source for fish and other marine animals, in recent years we’ve observed more frequent toxic blooms. Currently, physical sampling of the phytoplankton is necessary to determine what type they are, but scientists are working to use multi-spectral imaging to identify different species remotely. As harmful as they can be, blooms like these help visualize the flow and mixing in different coastal regions. Here, for example, we can see distinctive turbulent eddies in the Gulf that are tens of kilometers across. (Image credit: N. Kuring/NASA; via NASA Earth Observatory)
“Aurora”


In “Aurora”, artist Rus Khasanov uses fluids to create a short film full of psychedelic color and cosmic visuals. As in a soap bubble, the bright colors – as well as the pure black holes – come from the interference of light rays. The colors directly relate to the thickness of fluid, and they allow us to see all the subtle flows caused by variations in surface tension. (Video and image credit: R. Khasanov)

Magnetic Storms
Periodically, our sun releases plasma in a coronal mass ejection. Afterwards, the local magnetic field lines shift and reorganize. We can see that process in action here because charged particles spin along the magnetic lines, outlining them as bright loops in this imagery. This sequence – one of the best examples of this phenomenon to date – was captured by NASA’s Solar Dynamics Observatory in early 2017. To understand behaviors like these, scientists use magnetohydrodynamics, a marriage of the equations of fluid mechanics with Maxwell’s equations for electromagnetism. (Image credit: NASA SDO, source)

Transporting Droplets


Transporting droplets easily and reliably is important in many microfluidic applications. While this can be done using electric fields, those fields can impact biological characteristics researchers are trying to measure. As an alternative, a group of researchers have developed the concept of “mechanowetting,” a technique that uses surface tension forces to hold droplets on a traveling wave.
Now visually, it’s a bit tough to see what’s going on here. In the animations, it looks like the droplets are just sticking to a moving surface, but that’s an illusion. The surface the droplet is sitting on is fixed and unmoving. It’s a thin silicone film that covers a ridged conveyor belt. The belt underneath can (and does) move. This creates a traveling wave. Instead of that wave simply passing beneath the droplet, it triggers an internal flow and restoring force that helps the drop follow the wave. The effect is strong enough that small droplets are even able to climb up vertical walls or stick upside-down. (Image, research, and submission credit: E. de Jong et al.)

Oil-on-Water Impact
Although many people have studied droplet impacts over the years, there’s been remarkably little work done with oil-on-water impacts. One of the things that makes this situation different is that the oil and water are completely immiscible, which means we can see aspects of the impact process that are invisible with, say, water-on-water impacts.
The animation above shows an underwater view of the oil droplet’s impact. The energy of the initial impact creates an expanding crater and an unstable crown splash. That crown splash contains both water and oil. After it ejects some droplets, the rim stabilizes, but we can still see small perturbations along its edge as it starts to retract. In the water, high surface tension damps out these perturbations. Not so for the oil! As the crater retracts, the small disturbances along the rim get stretched into mushroom-shaped fingers that point inward toward the impact site. Because the index of refraction is different between oil and water, we can see the fingers clearly near the end of the animation. (Image and research credit: U. Jain et al.; submitted by Utkarsh J.)


