Search results for: “drag”

  • Sochi 2014: Speedskating Suits

    Sochi 2014: Speedskating Suits

    Long track speed skating is a race against the clock. Skaters reach speeds of roughly 50 kph, so drag has a significant impact. This is why skaters stay bent and spend straightaways–their fastest segments on the ice–with their arms pulled behind them. It’s also why their speedsuits have hoods to cover their hair. This year the U.S. speed skaters are wearing special suits designed by Under Armour and Lockheed Martin especially for their aerodynamics. The suits feature a mixture of fabrics including raised surface features on the hood and forearms. These bumps are designed to trip turbulent flow in these regions. It seems counterintuitive, but drag is actually lower for a turbulent boundary layer than a laminar one at the right Reynolds number range. This is because turbulent boundary layers are better at staying attached to non-streamlined bodies. The longer flow stays attached to the skater, the smaller the pressure difference between the air in front of the skater and the air in his wake. The suit’s seams and even its hot-rod-like flames were placed with this effect in mind. Only time will tell whether the suits really give skaters a competitive edge, but since Sochi’s low-altitude increases drag on skaters, they will appreciate some extra speed. For more, NSF has an inside look at the suit’s development. (Photo credits: Under Armour)

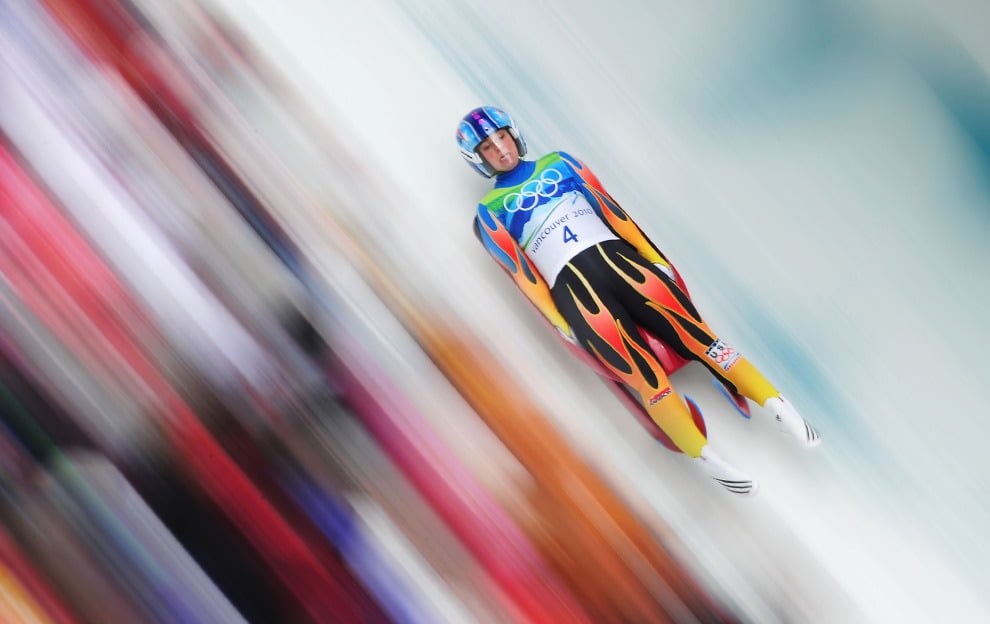
    FYFD is exploring the fluid dynamics of the Winter Olympics. Check out previous posts on how lugers slide fast and why ice is slippery, and be sure to stay tuned for more!

  • Sochi 2014: Luge

    Sochi 2014: Luge

    Like athletes in many of the gravity sports in the Winter Olympics, lugers want to be as aerodynamic as possible to minimize their drag. Once a luger has started sliding, only gravity can increase their speed – every other force, from friction to drag, pulls away valuable time. Luge sleds are built on sharp runners and athletes slide feet-first in a position much more streamlined than the head-first position of skeleton. Both contribute to the much higher speeds in luge – up to 140 kph (87 mph). Luge is also the only sliding sport measured down to thousandths of a second, so every gram of drag* makes a difference. Lugers keep their heads pulled back and wear full helmets to keep the air flow consistent and attached as much as possible. It is also typical for them to spend time in the wind tunnel, testing their sled’s aerodynamics, adjusting their position, and even testing their suits. (Photo credit: S. Botterill)

    * For those wondering, yes, drag is a force and a gram is a unit of mass, not force. However, it is not unusual when testing athletes in wind tunnels to compare drag between configurations in terms of grams.

    FYFD is celebrating the Games with a series on fluid dynamics in the Winter Olympics. Stay tuned for more!

  • Featured Video Play Icon

    Shooting a Bullet Through a Water Balloon

    This high-speed video of a bullet fired into a water balloon shows how dramatically drag forces can affect an object. In general, drag is proportional to fluid density times an object’s velocity squared. This means that changes in velocity cause even larger changes in drag force. In this case, though, it’s not the bullet’s velocity that is its undoing. When the bullet penetrates the balloon, it transitions from moving through air to moving through water, which is 1000 times more dense. In an instant, the bullet’s drag increases by three orders of magnitude. The response is immediate: the bullet slows down so quickly that it lacks the energy to pierce the far side of the balloon. This is not the only neat fluid dynamics in the video, though. When the bullet enters the balloon, it drags air in its wake, creating an air-filled cavity in the balloon. The cavity seals near the entry point and quickly breaks up into smaller bubbles. Meanwhile, a unstable jet of water streams out of the balloon through the bullet hole, driven by hydrodynamic pressure and the constriction of the balloon. (Video credit: Keyence)

  • Fluids Round-up – 11 January 2014

    Fluids Round-up – 11 January 2014

    It’s a big fluids round-up today, so let’s get right to it.

    (Photo credit: Think Elephants International/R. Shoer)

  • Featured Video Play Icon

    What Makes Squids Fast

    Cephalopods like the octopus or squid are some of the fastest marine creatures, able to accelerate to many body lengths per second by jetting water behind them. Part of what makes its high speed achievable, though, is the way the animal changes its shape. In general, drag forces are proportional to the square of velocity, meaning that doubling the velocity increases the drag by a factor of four. The energy necessary to overcome such large drag increases generally prevents marine animals from going very fast (compared to those of us used to moving through air!) But drag is also proportional to frontal area. Like the bio-inspired rocket in the video above, jetting cephalopods begin their acceleration from a bulbous shape and then shrink their exposed area as they accelerate. Not only does this shape change help mitigate increases in drag due to velocity, it prevents flow from separating around the animal, shielding it from more drag. The result is incredible acceleration using only a simple jet for thrust. For example, the octopus-like rocket in the video above reaches velocities of more than ten body lengths per second in less than a second. (Video credit: G. Weymouth et al.)

  • Featured Video Play Icon

    Holiday Fluids: Santa’s Aerodynamics

    Today we have some holiday-themed fluid dynamics: visualization of flow around Santa’s sleigh! This is a flowing soap film visualization at a low speed (author Nick Moore has some other speeds as well). Santa’s sleigh is what aerodynamicists call a bluff body–a shape that is not streamlined or aerodynamic–and sheds a complicated wake of vortices. Like any object moving through a fluid, Santa’s sleigh generates drag forces made up of several components. There is viscous drag, which comes from friction between the sleigh’s surface and the fluid, and form drag (or pressure drag), which comes from the shape of the sleigh. That wake full of complicated vortices significantly increases the sleigh’s pressure drag, requiring Rudolph and the other reindeer to provide more thrust to counter the sleigh’s drag. Speaking thereof, the visualization does not take into account the aerodynamics of the reindeer, who, in addition to providing the sleigh’s thrust, would also affect the flowfield upstream of the sleigh. This post is part of this week’s holiday-themed post series. (Video credit: N. Moore)

  • Reader Question: What is Viscosity?

    Reader Question: What is Viscosity?

    Reader thesnazz asks:

    Is there a difference between surface tension and viscosity, or are they two manifestations of the same process and/or principles? If you know a given fluid’s surface tension, can you predict its viscosity, and vice versa?

    This is a good question! To answer it, let’s think about where surface tension and viscosity come from. Like many concepts in fluid dynamics, these quantities describe for a whole fluid the properties that arise from interactions between molecules.

    To prevent this becoming overly long, I’m going to tackle this over a couple posts. Today, I’ll talk about viscosity.

    One way to describe a fluid’s viscosity is as a measure of its resistance to deformation. Another way to think of it is how easily momentum is transmitted from one part of the fluid to another. The diagram above is the classic representation. A layer of fluid is sandwiched between two flat plates. If the top plate moves, friction requires that the fluid particles in contact with the plate get dragged along. This shears the fluid just below that and drags it along, but not quite as much. Those fluid particles do the same to their neighbors and so on down to the stationary second plate, where the fluid is at rest.

    Viscosity is the property that determines how much those neighboring fluid particles move; the more viscous the fluid, the more the neighboring bits of fluid resist getting pulled along. This is a property that’s inherent to a fluid. It comes from how the molecules of the fluid interact with one another, but there are no simple expressions to calculate the viscosity of a liquid or a gas from the individual interactions of its molecules. Instead we experimentally measure viscosity values and use empirical formulas to approximate how viscosity changes with temperature and other effects. (Image credit: Wikimedia)

  • Making Better Tags for Tracking Turtles

    Making Better Tags for Tracking Turtles

    Tagging equipment is used on all manner of aerial and marine creatures to gather data about animal behavior in their natural environments. It can be difficult, though, for researchers to gauge what effects the tags have on an animal. A recent study by T. T. Jones et al. used drag measurements on marine turtle casts to estimate the effects of common tagging equipment. They found that, on large turtles, the equipment increases a turtle’s drag by as little as 5%, but for smaller species or juvenile turtles, the drag cost can be much larger – in some cases doubling a turtle’s drag when swimming. Such large increases in drag may significantly change a tagged turtle’s behavior and skew results or even endanger the animal. The researchers suggest a model that allows others to estimate a tag’s drag effects across species. (Image credits: T. Gray and M. Carey; research credit: T. T. Jones et al.; via PopSci; submitted by Chi M.)

  • Fluids Round-up – 21 September 2013

    Fluids Round-up – 21 September 2013

    First off, I’d like to give a special shout-out to FYFD’s friends at Pointwise, who were kind enough to invite me for a visit this week. For any readers looking for CFD grid-generation software, check them out; they are a fantastic bunch and very good at what they do.

    My thanks again to everyone who donated this week to help get me to the APS conference. The campaign is still open if anyone wants to get in on the FYFD wallpapers and stickers on offer to donors. As a reminder, any funds beyond conference costs will go toward improving FYFD, including getting equipment to make FYFD videos. On to the fluids round-up!

    (Photo credit: L. Gilman)

  • Featured Video Play Icon

    Wind Tunnel Testing

    Wind tunnel testing is an important step in designing new aircraft. This video shows footage of visualization tests of the 21-ft wingspan Boeing X-48C model in NASA Langley’s Full-Scale Tunnel. The X-48C is a blended wing body design capable of higher lift-to-drag ratios than conventional aircraft, which should lead to a higher range and greater fuel economy. The video shows some smoke visualization that illustrates airflow around the airfoil-shaped craft. The long probe sticking forward from the starboard wing is used to measure air pressure, angle of attack, and sideslip angle of the model. Notice how smoke from the wand is pulled from below the leading edge of the wing up and over the top of the wing. This is because there is lower pressure over the top of the wing than the bottom, and, like an electrical charge seeking the path of least resistance, fluids flow preferentially toward lower pressures. (Video credit: NASA Langley)