The Earth’s inner core is a hot, solid iron-rich alloy surrounded by a cooler, liquid outer core. The convection and rotation in this outer core creates our magnetic fields, but those magnetic fields can, in turn, affect the liquid metal flowing inside the Earth. Most of our models for these planetary flows are simplified — dropping this feedback where the flow-induced magnetic field affects the flow.
The simplification used, the Taylor-Proudman theorem, assumes that in a rotating flow, the flow won’t cross certain boundaries. (To see this in action, check out this Taylor column video.) The trouble is, our measurements of the Earth’s actual interior flows don’t obey the theorem. Instead, they show flows crossing that imaginary boundary.
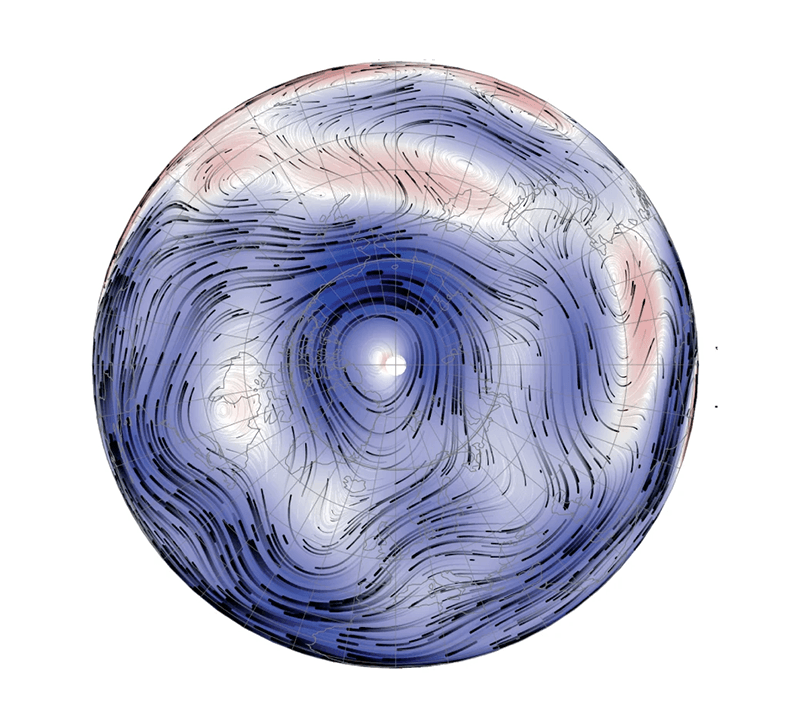
To explore this problem, researchers built a “Little Earth Experiment” that placed a rotating tank (representing the Earth’s inner and outer core) filled with a transparent, magnetically-active fluid inside a giant magnetic. This setup allowed researchers to demonstrate that, in planetary-like flows, the magnetic field can create flow across the Taylor-Proudman boundary. (Image credit: C. Finley et al.; research credit: A. Pothérat et al.; via APS Physics)


")