Category: Research

  • Submarine Canyons Focus Waves

    Submarine Canyons Focus Waves

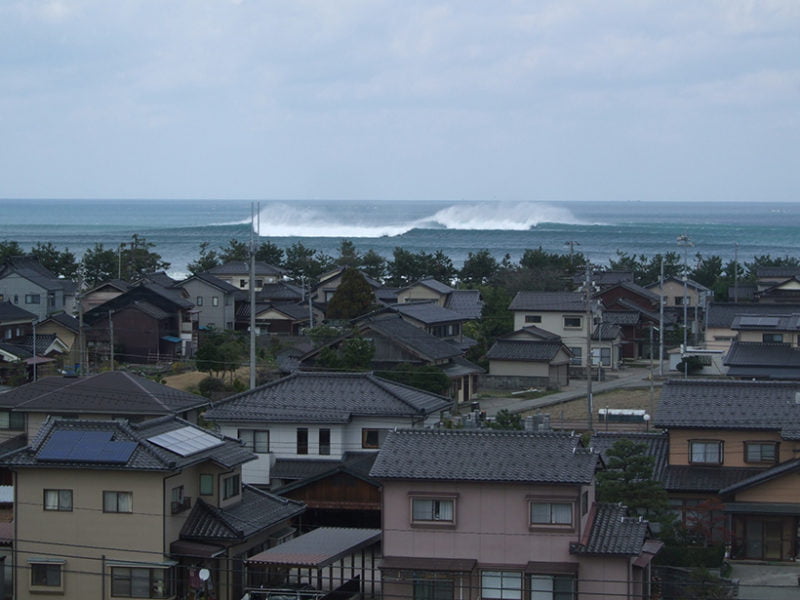
    In winter months Toyama Bay in Japan can get hammered by waves nearly 10 meters in height. These waves, known as YoriMawari-nami, pose dangers to both infrastructure and citizens, and, thus far, are not captured by typical forecasting models.

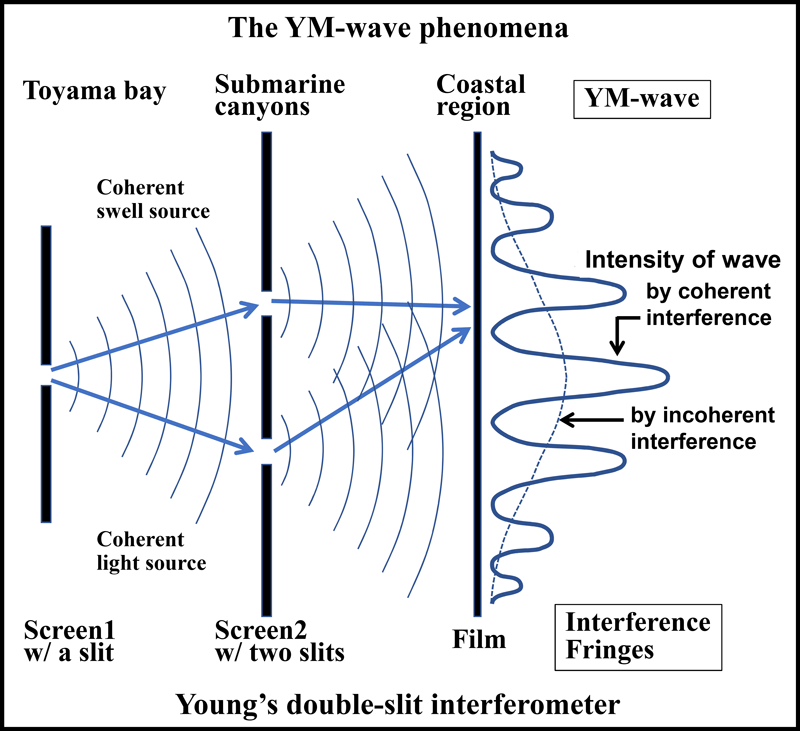
    A new study indicates that these waves have their origin in the particular topography of Toyama Bay and the physics behind the double-slit experiment. The shape of Toyama Bay is such that only waves from the north-northeast can propagate all the way to shore. That restriction essentially creates a single, coherent source for waves in the bay.

    The bay is also home to submarine canyons that stretch like underwater valleys from the continental shelf down toward the deeper ocean. To the incoming waves, these canyons act much like the slits in the double-slit experiment, creating two sets of waves whose fronts can interfere. In some positions, a wave crest will combine with a wave trough, cancelling one another out. But in other spots, two wave crests will meet and combine, creating the much larger YoriMawari-nami wave.

    Diagram illustrating the similarity of the YM-wave phenomenon to Young's double-slit experiment. By H. Tamura et al.

    Toyama Bay is not the only spot in the world where this phenomenon happens. The same physics is behind some of the most popular surf spots in the world, including Half-Moon Bay in California and Nazaré, Portugal. In all of these cases, properly predicting wave heights requires tracking an extra variable — wave phase — that most models leave out. That’s why forecasters have struggled with Toyama Bay’s waves. (Image credit: wave – M. Kawai, diagram – H. Tamura et al.; research credit: H. Tamura et al.; via AGU Eos; submitted by Kam-Yung Soh)

  • Pearls On a Puddle

    Pearls On a Puddle

    Leave a drop of coffee sitting on a surface and it will leave behind a ring of particulates once the water evaporates. But what happens to a droplet made up of multiple liquids that evaporate differently? That’s the subject of this new study. Researchers mixed a volatile drop (isopropyl alcohol) with a smaller amount of a non-volatile liquid and observed how this changed the droplet’s splash rim and evaporation pattern.

    When the surface tension difference between the two liquids was large, the researchers found that the splash formed fingers along its rim (Image 1). The fingers consist almost entirely of the non-volatile component, driven to the outskirts of the drop by Marangoni forces. The dark and light bands you see in the image are interference fringes, which the researchers used to track the film’s thickness.

    When the researchers used liquids with similar surface tensions, the droplet rim instead formed pearl-like satellite droplets. Once the volatile liquid evaporated away, the remaining liquid merged into a thick film. (Image and research credit: A. Mouat et al.; via APS Physics; submitted by Kam-Yung Soh)

  • Hydrodynamics of Sheep

    Hydrodynamics of Sheep

    As we’ve discussed previously, not all fluid-like behavior occurs within a literal fluid. Many groups of organisms — humans included — behave like a fluid en masse. Herds of sheep are a fantastic example of this, and now researchers have actually analyzed footage of sheep as a fluid!

    The authors find strong evidence for emergent collective behavior among the sheep, as well as a tendency for the flock to minimize its perimeter. In other words, even though the sheep do not physically exert an attractive force on one another, they behave as though the flock has surface tension! For a herd animal, this behavior makes sense since it minimizes the exposure of individuals to predators. (Image credit: top image – S. Carter, drone footage – M. Bircham; research credit: M. de Marcken and R. Sarfati; submitted by Kam-Yung Soh)

    ETA: Thanks to commenter gib for finding the original author of the drone footage!

  • Ice Rings Caused By Underlying Eddies

    Ice Rings Caused By Underlying Eddies

    Observations of strange ice rings on Lake Baikal, the world’s deepest lake, have puzzled scientists for decades. Surveys of satellite imagery have revealed rings on Baikal and two other lakes dating back to the 1960s and some of our earliest satellite images. The rings are roughly 5-7 km in diameter, with a dark layer of thin ice about 1 km wide around a brighter layer of thick ice.

    A new study, buoyed in part by on-the-ground observations during Siberian winter, argues that the ice rings observed on the surface are related to eddies of warmer water circulating below. The researchers were able to capture several eddies in their measurements, including one migratory one. The size, shape, and location of these sub-surface eddies are consistent with ice ring appearance. The kilometers’ wide eddies are several degrees warmer at shallow depths and rotate approximately once every 3 days.

    The researchers suspect the eddies form long before the ice does. Infrared observations in late autumn suggest the eddies form from a combination of wind and influx of river water into the lakes. Then, as ice does form, it’s affected by the underlying circulation. (Image credits: NASA, 1, 2; research credit: A. Kouraev et al.; via Gizmodo)

  • Vortex Collisions Leave Clues to Turbulence

    Vortex Collisions Leave Clues to Turbulence

    Vortex ring collisions have long been admired for their beauty, but they’re now shedding light on the fundamental interactions that lead to turbulence. By dying just the cores of colliding vortex rings (Image 2), researchers observed anti-symmetric perturbations that develop along each core as they interact. These are indicative of what’s known as the elliptical instability.

    But the breakdown doesn’t stop there. Instead, as the elliptical instability develops, it generates a set of secondary vortex filaments that wrap around the original cores (Image 3). Just like the original vortex cores, those counter-rotating secondary filaments interact with one another, develop their own elliptical instability, and generate a set of smaller, tertiary filaments (Image 4).

    What’s exciting is that this process gives us a physical mechanism for the turbulent energy cascade. Researchers have talked for decades about energy passing from large-scale eddies to smaller and smaller ones, but this work lets us actually observe that cascade in the form of smaller and smaller pairs of vortex filaments interacting. To see more, check out some of our previous posts on this work. (Image and research credit: R. McKeown et al.; via Cosmos; submitted by Ryan M. and Kam-Yung Soh)

  • Levitation Without Boiling

    Levitation Without Boiling

    One way to levitate droplets is to place them on a surface heated much higher than the droplet’s boiling point. This creates the Leidenfrost effect, where a droplet levitates on a thin layer of its own evaporating vapor. In this study, the situation is quite different.

    Although the underlying pool of liquid — here, silicone oil — is heated, its temperature is well below the boiling point of the water droplet. But the droplet still levitates over the pool, thanks to an air layer fed by convection. Aluminum powder in the oil reveals large-scale convection in the pool; note how the oil moves radially toward the droplet. That movement drags the air in contact with the oil with it, which forms the vapor layer keeping the droplet aloft.

    One side effect of this convection-driven levitation is that the droplet hovers over the coldest point in the oil. That fact suggests that users can manipulate the droplet’s motion by tuning the underlying heating. (Image and research credit: E. Mogilevskiy)

  • To Beat Surface Tension, Tadpoles Make Bubbles

    To Beat Surface Tension, Tadpoles Make Bubbles

    For tiny creatures, surface tension is a formidable barrier. Newborn tadpoles are much too small and weak to breach the air-water surface in order to breathe. Researchers found that, instead, the 3 millimeter creatures place their mouths against the surface, expand their mouth to generate suction, and swallow a bubble consisting largely of fresh air.

    When they’re especially small, some of these species are essentially transparent (Image 1), allowing researchers to see the bubble directly. But even as the tadpoles aged (Images 2 and 3) and grew strong enough to breach the surface, they observed many instances in which the tadpoles continued this bubble-sucking method to breathe. (Image and research credit: K. Schwenk and J. Phillips; via Cosmos; submitted by Kam-Yung Soh)

  • Surface Jets in Coalescing Droplets

    Surface Jets in Coalescing Droplets

    What goes on when droplets merge is tough to observe, even with a high-speed camera. There are many factors at play: any momentum in the droplets, surface tension, gravity, and Marangoni forces, to name a few. A new study that simultaneously records multiple views of coalescence is shedding some light on these dynamics.

    The results are particularly interesting for droplets that are somewhat physically separated so that they only coalesce after one drop impacts near the other. In this situation, with droplets of equal surface tension, researchers observed a jet that forms after impact (Image 1) and runs along the top surface of the coalescing drops (Image 2). That location is a strong indication that the jet is created by surface tension and not other forces.

    To test that further, the researchers repeated the experiment but with droplets of unequal surface tension. They found that when the undyed droplet’s surface tension was higher (Image 3), Marangoni forces enhanced the surface jet, as one would expect for a surface-tension-driven phenomenon. But if the dyed droplet had the higher surface tension (Image 4), it was possible to completely suppress the jet’s formation. (Image, research, and submission credit: T. Sykes et al., arXiv)

  • Using Electric Fields to Avoid Dripping

    Using Electric Fields to Avoid Dripping

    Anyone who’s painted a room at home is familiar with the frustration of drips. At certain inclinations, practically every viscous liquid develops these gravity-driven instabilities. They’re troublesome in manufacturing as well, where viscous films are often used to coat components and unexpected drips can ruin the process.

    To avoid this, researchers are adding electric fields into the mix. For dielectric fluids — liquids sensitive to electric fields — this addition acts like extra surface tension, stabilizing the film and preventing drips from forming. The researchers’ mathematical models predict the electric field strength necessary for a given fluid layer depending on its inclination. (Image credit: stux; research credit: R. Tomlin et al.; via APS Physics)

  • Inferring Flows with Neural Networks

    Inferring Flows with Neural Networks

    Fluid dynamicists have long used flow visualization methods to get a qualitative sense for flows, but it’s rare to derive much quantitative data from this imagery. But that may soon change thanks to a new computational technique, called Hidden Fluid Mechanics, that uses data from flow visualizations combined with physics-informed neural networks to derive the underlying velocities and pressures in a flow.

    The technique relies on two important ideas. One is that the dye, smoke, or other method of visualizing the flow does not alter the underlying flow; it’s just something carried along by the fluid. In other words, the flow behaves exactly the same whether or not you inserted dye or smoke.

    The second key idea is that the Navier-Stokes equations — which are derived from conservation of mass, momentum, and energy — accurately describe the physics of a flow. That assumption is critical to the technique since it uses those equations to constrain the flow fields the algorithm reconstructs.

    So here, roughly speaking, is what the algorithm actually does: researchers feed it concentration data from a flow visualization — essentially how much smoke or dye is present at every point in space and time — and the neural network reconstructs, based on the Navier-Stokes equations, what velocity and pressure field would produce that concentration data.

    The researchers demonstrate the capabilities of their algorithm by comparing its results to flows where all the information is known. The first image in the gallery above shows concentration data for the flow in an aneurysm. The full flow field is known already from a numerical simulation, but the researchers gave their new algorithm only the concentration data. From that, it reconstructed the streamlines for the aneurysm’s flow, shown in the second image as “Learned”. The “Exact” streamlines on the left are taken from the original numerical simulation data. As you can see, the results are remarkably similar. (Image credit: drawings – L. da Vinci, others – M. Raissi et al.; research credit: M. Raissi et al.; submitted by Stuart H.)